Comparing Evaluation Heuristics with
Human Testers
By: David Skiöld & Kristian Toro
Main field: Computer Science
Thesis: Bachelor 180 credits
VT 2020
Abstract - Through our work we validated the symmetry and leniency heuristics used to evaluate content which has been procedurally generated in a mixed-initiative tool called the Evolutionary Dungeon Designer (EDD). This was done by analyzing and comparing how said heuristics differs from what a human player perceives the metrics to be. A user study was performed for which we developed a game for human testers to try and experience different dungeons, in order to collect the data needed for making the necessary comparisons. We propose potential improvements to the metrics that are intended to represent difficulty and aesthetics used in EDD so that they could better match their intended goals. In general, the testers found the maps to be close to the expected difficulty but there was a big discrepancy in the symmetry metric and how aesthetic they found the maps. We further discuss how the research performed by us could be expanded upon for the purpose of making further improvements to automatic evaluation heuristics, by either making similar research on games of different genres or on games with different game mechanics.
1. Introduction
Procedural content generation (PCG) pertains to the algorithmic creation of some relevant content, for example rulesets, maps and enemies with minimal user input to be of use in games[1]. PCG is relevant in the creation of video games because it can cut down on the time and money spent on creating artifacts by allowing content to be generated by an algorithm [2]. This could reduce the workload on game developers and speed up the production of games. With the help of PCG, human creators have been able to express themselves in new ways. In game development, for instance, PCG has been used in Mixed-Initiative Co-Creative (MI-CC) interactions, MI-CC being the joint creation of content between a human user and a computer, not only to reduce the workload put on the human creator, but also to foster their creativity [3]. Within the paradigm of PCG there is a specific type of algorithms which are Search-Based, meaning they are a form of generate-and-test algorithms. They score the candidates instead of rejecting or accepting them and generate new candidates based on previously well-performing characteristics. In search-based PCG (SBPCG) it is important to have some evaluation of each artifact created so the algorithm can evaluate the quality of the created artifacts [4].
Togelius et al. presented data-driven models for use with PCG which would permit the automation of PCG based on the player’s opinions without a player actually testing it. In fact, they achieved some success in this, but also clarified the importance of the game they used for the modeling being a popular game and therefore giving them a large collection of data to use [5].
There are several ways of evaluating PCG systems, these include but are not limited to: human testers evaluating the created product, evaluating the expressive range, or using an AI-agent to use and evaluate the produced content [1]. These ways will be further explained in sections 2 and 3 of this document. There is also some significance to evaluating the metrics used in the PCG system as there may be a difference to how an automated evaluation of produced content scores the created content versus how a human tester would experience it. For example, Mariño et al. found that there were differences in the evaluation by automated metrics and by human testers when evaluating PCG created Infinite Mario Bros (IMB) levels [3] and Summerville et al. went on to classify how large this difference was [6]. Besides IMB there are other games which also use PCG to create an infinite world such as Minecraft, or simply to generate a new map every time you play it to increase replay value such as Terraria. However, we will instead focus on another system for creating game-levels, namely the Evolutionary Dungeon Designer (EDD). EDD is a MI-CC tool used to easily create dungeons for games using an evolutionary approach. Within EDD, a designer can create and edit dungeon levels as well as get design suggestions from the tool itself [7]. For the purposes of our work we define dungeon crawler games as games where a player explores rooms as parts of a larger whole, fighting enemies and picking up loot as they go. An example of such a game would be The Binding of Isaac.
According to Shaker et al.[1] there is a value in evaluating what is created when using PCG, and there is importance in ensuring that what has been created has a value. This is normally done with a set of evaluation heuristics. Rather than using only such heuristics, we evaluate the differences between the findings with evaluation heuristics and the findings with human testers through game tests performed
on the artefact created which uses EDD, as well as validate them. Therefore, the research questions we have chosen are:
• RQ1: How is the players’ experience affected when we apply different ranges of feature dimensions in EDD, and how does it differ from how EDD evaluates them?
o RQ1.1: How is symmetry connected to how aesthetical a room is perceived to be by a
player?
o RQ1.2: How is leniency connected to how difficult a player perceives a room to be?
This work is intended to provide a useful comparison between using human evaluation and automatically evaluating a PCG created artefact. Most importantly, the study will shed light on level design heuristic validation that will further strengthen and improve automatic evaluations to better relate to what a human player expects. Moreover, the research locates potential flaws or discrepancies in how evaluation metrics are used and how they relate to the created artefact.
Furthermore, the choice of using the symmetry and leniency metrics for our study was made because they had clearly stated goals in previous research [7]. EDD does contain more metrics, such as number of spatial patterns, number of meso patterns, linearity etc. However, these metrics are not as clear in what goal they wish to fulfill as the leniency and symmetry metrics. The chosen metrics are also quite subjective, meaning it is difficult to evaluate them properly without having human testers.
With this study we have brought forth suggestions on possible changes to the leniency and symmetry metrics, which are presented in this paper. We have also provided some motivation for creating a new metric with the goal of aesthetics to replace symmetry for that goal, if a metric with such a goal would be considered in the future.
For our thesis, we have chosen to follow the design science methodology. With design science research there is usually an object of study and two major activities, and these activities have a context associated with them[8]. The object of study in the case of our study was the artefact created for the purpose of evaluating the evaluation metrics. This artefact is a game capable of loading rooms from maps created in EDD filled with content, such as walls and enemies, a game which a player can play through and evaluate. Furthermore, the two activities iterated through were: 1. a development phase where we created and improved upon the artefact, and 2. an evaluation phase where we used the artefact to evaluate and investigate the relevant metrics. Finally, the context was improved metrics for the EDD that matches with what human users find satisfactory.
2. Previous Work
Procedural Content GenerationThe definition of PCG we will use is that of Togelius et al: PCG is the algorithmic creation of game content with limited or indirect user input [9].
Search-Based Procedural Content Generation (SBPCG) is an approach within PCG algorithms which is useful for creating content for games, provided you have a way of evaluating every created artefact. It is a generate and test approach where the fitness function grades the participants rather than accepting or denying them. Furthermore, the new candidates created are created based on the fitness of previous candidates so as to generate better and better candidates. As long as you can reliably evaluate what is created each iteration, and thereby determine a fitness of created content, it is likely that what you have created could be used instead of a human created substitute for that content [4].
An early example of a game where PCG was a core mechanic was Rogue (alternative title:
Rogue: Exploring the Dungeons of Doom), a simple dungeon crawler where the treasures, monsters and dungeons are procedurally generated with a goal of making no game the same as the previous one [10].
Evaluating PCG
When evaluating PCG systems, it is important to evaluate it based on the intended outcome of said algorithm [1]. Therefore, when we are talking about a search-based approach, it is important to understand the underlying purpose of the evaluations and metrics used and what intended outcomes they are meant to lead to.
Though difficult to properly evaluate a created PCG system, there are at least two good ways of doing so. The first is to evaluate the expressive range, meaning all the potential levels it could create and the likelihood of it using certain structures. The second one is evaluation via players. This method is based around explicitly asking play testers about the created content. It can be done in smaller playtest groups where some players consume a large amount of content or in a crowd-sourced way which lends itself towards machine learning [1]. For the evaluation used in the work of Togelius et al., for instance, logs the players performance on a tutorial level played to next let the player play two different levels generated by two different PCG systems that have received the player's performance data, the player then selects whichever level they preferred[5]. Furthermore, Cook et al. introduces another way of evaluating and classifying systems to make them easier to use for developers other than those who created the system. They suggest two features they call smoothness and codependency, which evaluate how the output changes depending on the input given by the developer. The smoothness feature evaluates how much a change in an input value would impact the output of a metric . The codependency instead shows how much changing the value of one parameter impacts the smoothness of another [11].
Beyond these strategies some PCG systems are simply evaluated by their creators. Such things that are generally analyzed and evaluated in those cases might be the efficiency and running time, analysis of generated levels based on their suitability for an intended game[3], or with less formal evaluation metrics created in consort with designers[12].
There are also the so-called procedural personas used by Holmgård et al. [13]. These automated personas are artificial agents who play through a map and evaluate it based on how they do. They developed several such types of personas based on varying types of players such as Monster Killer and Treasure Collector. These personas would have different goals in mind and different ways of evaluating the playability of the levels they are used on and were generated using a two population genetic algorithm[13].
Furthermore, a somewhat similar evaluation method based on the procedural personas developed in [13] was created for and used with maps created in EDD by Terins and Mossberg [14]. They created a simple dungeon crawler game where EDD maps could be loaded for the automated AI agents to then go through and evaluate.
Finally, Mariño et al. have developed a PCG system which created levels for a platformer game using only symmetry as its metric and then evaluated the system using human testers. They found that they could generate levels in IMB that were not only satisfactory but better than levels created by both other generators and professional designers [15].
Player Experience Modeling
Player experience modeling (PEM) is a form of user modeling within games that incorporates behavioral, cognitive and affective patterns of players [1]. PEM is highly important for improving the current techniques used for generating procedural content. In contrast to basing the models entirely on general assumptions, more precise models can be made from player experience for the development of models that automatically design aspects of a game, such as levels. Furthermore, in Modeling Player Experience for Content Creation, Pedersen et al. discuss possible ways of doing so and the importance of the testbed system. In their case there was a significant importance in the use of a popular game for the data collection, as it allowed them to gather a large amount of data [16].
Another example of using PEM is in the study performed by Melhart et al. where they tried to find a way to model the motivation of the players. They used machine preference learning to model the player’s motivation by treating it as an ordinal phenomenon. The resulting models were found to have an average accuracy of 80% with the highest ones having at least 92% accuracy [17]. This means these types of strategies could be used in the future by game developing companies to, with some accuracy, predict what motivations could spark interest in gamers in different games and therefore develop the games with clear player experiences in mind.
Designer Modeling
Designer modeling has its similarities to player modeling but is far more complex and can be seen as second-order player modeling. The main distinction from player modeling is that designer modeling is a method that incorporates the designer’s intentions to satisfy the player through making a
co-creational design with a computer-aided design (CAD) tool [18]. A designer model is considered successful if it can recognize the preferences, process and goal of the designer’s interaction with the tool. Thus, extensive data of the designer’s choices, rankings or ratings among alternatives is required to fulfill that criteria [18].
In [19], Alvarez et al. presented a form of designer modeling called Design Style Clustering which is used to classify the designers’ designs made in EDD. From the data collected from their research, twelve sets of clusters were built. They then created a roadmap of design styles from these clusters. This roadmap of designer personas is suggested to grant a content generator the possibility to predict the designer’s upcoming decisions as well as offering fitting content suggestions within a MI-CC tool, while still managing to avoid heavy computational cost [19].
Evolutionary Dungeon Designer
The Evolutionary Dungeon Designer (EDD) is a MI-CC tool used to easily create dungeons for games using an evolutionary approach. In the EDD the user can edit both the entire layout of the dungeon by adding/removing rooms but also by editing the layout of the rooms themselves. Furthermore, the user can create rooms of whatever width/height they want and connect these rooms via doors, as well as place out tokens in the rooms representing walls, floors, enemies, treasures, and bosses. EDD can consequently make suggestions on how to change the room from there using different PCG algorithms. These changes are dependent on a list of metrics and what inputs the user gives as to how each metric should be used. The rooms created are also partitioned into spatial and meso patterns to be used in the generation [7].
Moreover, the metrics we are evaluating within EDD, leniency and symmetry, are defined by Alvarez et al. [7]. Leniency - calculates at any given point how challenging the room is. It does so by using the number of enemies in the room as well as how safe the doors in the room are and the counterbalancing amount of treasure within the room. This range is expressed as a number between 1 and 0 with 1 being an ‘easy’ room and 0 being a ‘difficult’ room.
Symmetry - is the consideration of the aesthetic aspects of the room and is calculated by X and Y axis as well as diagonal backslash and front-slash through the room. The highest value is then used as the score of how symmetrical a room is.
There are more metrics in EDD, such as linearity, number of meso patterns, number of spatial patterns, similarity etc. but the leniency and symmetry metrics are clearer in their goals, namely, evaluating how difficult a room is and how aesthetic a room is respectively.
Evaluating Metrics
Mariño et al. showed that even though automated metrics give one outcome, it is not necessarily the same outcome as human evaluation would give. In their case they evaluated two levels against one another and the outcomes from automated evaluation showed these levels similar to one another in the case of their metrics, linearity, leniency etc. However, when human players played and evaluated these levels they found significant differences in such things as leniency, which was also one of the metrics used in the automated evaluation [3]. Summerville et al., as an example, then expands on this evaluation and they do so by examining the extent of the difference between the human testers evaluations and that of the automated evaluations [6].
3. Method
3.1Design Science Research
To answer the proposed research questions we used the design science research methodology [8], which is focused on problem solving and using the innovation of an artefact to do so. This methodology includes the creation of the artefact, the following iterative evaluation, and after said evaluation the improvement of the artefact.
Design science research methodology is highly focused on the iterative development and testing of an artefact alongside the research being made, which was the most relevant aspect for the choice of a methodology for this research. The design science process involves six steps, however, there is no necessity to follow these steps sequentially [20]:
1. Problem identification and motivation
This step includes the definition of a research problem and then justifying what value a possible solution will bring. How the problem is defined may shape the solution so splitting up or minimizing the problem might result in a better solution.
2. Define the objectives for a solution
After the problem is defined in step 1 the quantitative or qualitative objectives of the solution should be found and defined.
3. Design and development
Decide upon an architecture and the desired functionalities of the artefact followed by then creating the artefact.
4. Demonstration
Show how the artefact is used, by for example: experimentation, case studies etc. to solve one or more parts of the problem.
5. Evaluation
Measure how well the artefact supports a solution to the problem. Use the objectives from step 2 and compare them to the results from step 4.
6. Communication
The last step is to communicate the importance of the problem, the artefact and its utility as well as the rigor of its design to relevant audiences.
3.2
Practical execution of the method
Problem identification and motivation
The intentions of a designer, whether it comes to designing an entire game or certain aspects of a game, might not always be perceived similarly by human players. Extensive evaluation of the design is helpful, as it can provide the designer with valuable information on how to improve the design. With PCG systems like EDD, an evaluation can give insight into the metrics used and if they need fine tuning, or even if there could be other aspects that have not been considered while designing the tool. Thus, one method is to automatically evaluate the content with an AI-agent. This method was used by Terins & Mossberg., as they developed the Automatic Dungeon Evaluator (ADE) [14] for evaluating EDD.
Automatic testing has the benefits of being less costly in terms of time and money in general compared to having human testers [14], an example of one that is rather fast is the procedural personas by Holmgård et al.[13]. Although, even if an AI-agent is well designed to replicate human behavior, it is not certain that all human aspects have been taken into consideration. Neither can designers anticipate all the possible situations that the agent might find itself in [1]. It is possible to draw conclusions from the AI-agent’s rating of the maps, but unlike human testers, they are unable to provide any other feedback apart from the aspects of the game that they are programmed to rate.
Define the objectives for a solution
The main goal of this thesis was to evaluate if the players’ experience matches with what the designers tried to make when using the automated evaluations of EDD, communicated through the artefact designed for this specific purpose. In order to do so we studied how the metrics leniency and symmetry affect the human player’s experience and made comparisons between the human player’s experience and the intentions behind the metrics used in EDD. To be able to make the evaluation the developed artefact had to be able to build playable levels from maps generated in, and imported from, EDD.
Design and development
According to Shaker et al. [1] there is a large value in evaluating what is created with the PCG algorithm and there is importance in ensuring that what has been created has a value to the creator, this
is normally done with a set of evaluation heuristics. In the case of this study, instead of using only such heuristics, an artefact in the form of a game was developed. The artefact’s purpose was enabling evaluation and comparison of human players’ evaluations of the levels generated by EDD to their evaluations of maps created by a human with the same goal regarding the player experience in mind. When creating the maps in EDD we first built the layout of the maps by creating the empty rooms and connecting them via doors and selected which rooms would have which scores for the different metrics. Thereafter we applied the metrics chosen, for example: leniency and symmetry, and selected the first room suggested by the tool with the right scores for the metrics. For example, if we wanted a room with a leniency of 0.2 and symmetry of 0.4 we would apply the symmetry and leniency metrics in EDD and pick the first suggested room with a leniency of 0.2 and a symmetry of 0.4.The content generated by EDD was imported into and presented through the artefact. Finally, the game itself was created with Unity [21]. The version of Unity that we used was Unity 2019.3.3f1.
Demonstration
Though evaluating a PCG system by using some automated evaluation heuristic is valuable [1], such as expressive range, there is also considerable value in evaluating it with a user study. As Mariño et Al. showed in [3], there can be a significant difference between what is perceived by the user and by an automated system, they also concluded that it is difficult to replace a good user study with such computational metrics.
Using a questionnaire is the most common method for gathering data from design experiments. In fact this method is used in 70 percent of the cases according to [22]. This method let the testers define their experiences and impressions of the artefact from the playtests by answering a set of questions. The questions we used consisted of a mix of both open-ended questions and close-ended questions as we wanted some answers to be easier to summarize and some that could provide us with deeper feedback [23]. The quantitative questions we wrote to be more easily summarized were inspired by Likert-type scales [24]. Some of the advantages of questionnaires according to Kabir [23] is that
1. Large amounts of data can be easily collected in a short period of time.
2. The results can be quickly quantified by the researcher and it is relatively easy to analyze the data objectively.
3. When the data is quantified, you can use it comparatively to other research. All these are certainly relevant to us and our work as we have limited time and there is previous research evaluating the same PCG system as we are evaluating (though using automated personas instead of human testers), and a comparison may be relevant. The other method for collecting data we considered was by interviews. Some advantages of interviews according to Kabir [23] is: 1. Social cues can give the interviewer extra information. 2. The interviewer can pose follow-up questions giving them extra information, etc. The main advantage to us would be the capability to pose follow-up questions but with the extra difficulties with planning and the extra time it would take to conduct interviews we decided questionnaires were the way to go in our case.
However, because of the disconnect between playing through a full set of rooms in a dungeon and then afterwards answering questions about them we decided it would be good to also have another way of gathering data while the testing was in session. We decided on using the think-aloud [25] method where the testers are instructed before the session starts to verbalize their thoughts and problem-solving processes while using our artefact. While they are playing the game, we recorded what they were saying (as well as what they were doing) to then transcribe into a document for further analyzing.
When we chose to also use the think-aloud method along our questionnaires we considered the possibility of gaining usable data with the method. On the one hand the task would be simple enough for players (especially experienced) to vocalize their thinking process surrounding the game and the maps, making it somewhat suitable. On the other hand, there was a risk that because of their extensive previous experience with more complex games they would not give any thought to, nor vocalize anything about the layout of the map [25]. Furthermore, this method is mainly used to obtain data about the cognitive process when solving problems [25] which, though present in the game, might not be the exact kind of data we are interested in. So instead of undergoing the full process of the think-aloud method we decided to use the data gathering principle of the method and then analyze the parts we found to be useful to gain qualitative data from the testers firsthand while playing. Using the raw data from such a method without using the full method is not unheard of [26] and we consider the time spent using
this alternative way of data gathering to be worth it, because of the large amount of qualitative data which can be gathered.
The tests were performed through a series of playtests, where human testers were asked to rank the different game levels according to how difficult they found them to be and how aesthetical they thought they were on a Likert-type scale [24]. Prior to the playtests, the players were asked to pay attention to which room number they were currently in and what aspects of each room, if any, that proved to be difficult to them during the playtests. In addition to evaluating the difficulty of beating a level they were also asked to evaluate how aesthetical and logical they found the level layout to be. Furthermore, during these playtests, the players were asked to verbalize their thought process, especially regarding the difficulty level of and the aesthetics of the rooms they were in. Finally, this was recorded and transcribed to be analyzed and discussed later in this document.
Evaluation
Our selection criteria were persons in the 18-27 years old range, mainly with a previous understanding of dungeon crawler games, or similar games. They had to also be capable of participating in the tests over distance (further explained in section 5. Experiments).
The evaluation of the metrics, such as leniency and symmetry, was based on the results gathered from the playtests and the feedback that the human players provided. The evaluation was made based on the differences between two types of levels, namely ones created using the EDDs automated systems and ones created by us. The maps created by us were created with the same goal in mind as those created automatically. For example: a difficult room may be created automatically with a leniency of 0.2, then a room would be created by us that we would consider difficult while still being within the same range of leniency (~0.2). When creating the maps with EDD we put in the heuristics we want to use and then chose the first room suggested by the automated room-creating process. During a playtest, the testers received a quick explanation of the game's mechanics and how to control the player entity. After the explanation, the testers were to play the generated levels made for the evaluation. To make sure that they got some time to try out the mechanics before the first few difficult rooms we decided to have the first room in each map be an easy (high leniency) room. There were four maps for them to play through in sequential order. The players were asked to play one of the four available maps at a time. After playing through a map, the players were asked to answer the questions in the survey that were relevant to that map before proceeding to the next. While in the maps however they were allowed to choose for themselves in what order they decided to tackle the rooms with the only limit being the doors between rooms, for example MAP 2 was only completable in one way because the rooms were connected in a sequential order but in MAP 1 there were several possible paths to choose from.
Communication
The artefact which was designed for the purpose of performing the research in this paper is further explained in Section 4 of this document. Likewise, our findings are reported in Section 6 and later discussed in section 7. Since no previous study has examined the EDD metrics using human testers testing in a game environment, we are providing a potentially useful insight into the differences between how the automated evaluation would score different rooms versus how a human would. Additionally, the artefact we have developed potentially provides future researchers with a base for further testing EDD created dungeons in a game environment.
4. The Artefact
The artefact we have created is a simple dungeon crawler game where the maps are loaded from the XML files created when using EDD. The artefact was created using the Unity game engine and was created for PC-systems. Unity was chosen because it is the game engine that we have most experience with and could therefore build the artefact that we had in vision much quicker than we would be able to with another game engine.
4.1
Gameplay and game mechanics
The game is played in a sideways top-down view. All the rooms are loaded into the same scene. The camera is placed so that only the current room the player is in can be viewed. The camera switches
location when the player goes through a door that leads to another room. Each room is surrounded by impassable walls. Something we considered is the difference in experience the game could give if the treasures spawned through the treasure-tiles was random. To counteract this, we made a system where the same treasures would spawn deterministically in the same spots for everyone playing a map. The actual function of the treasure tiles in EDD is discussed by Baldwin & Holmberg [27] where they propose it could be any form of valuable item that can be collected by the player. They also give some examples of possible treasures, such as currency, weapons, armor and consumable items. As such we decided to have three different types of treasure: score treasure, weapons, and keys. The rooms can contain any of the following objects:
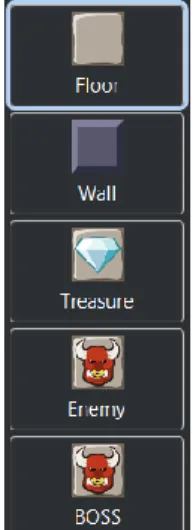
• Floor: The floor in the game is one large mesh, which all the rooms are placed upon.
• Wall: The walls inside a room are the same as the walls surrounding the room. An example of the wall tile can be seen in Figure 4.1.
Figure 4.1. The representation of a wall-tile Figure 4.2. The representation of the
as seen in our artefact player character as seen in our artefact.
• Player: The player entity can be controlled by a human player. It can move around in the room it is in by pressing the W, A, S, D keys. The player starts with a basic single shot weapon, this weapon can be used by pressing the left mouse button. It will continue to fire shots after a certain delay if the left mouse button is held down. The shots originating from the player’s position are fired in the direction towards the mouse cursor’s position. The shots disappear when they collide with a wall or an enemy. The player loads in on a map with 10 health. When the health reaches below 1, the player is defeated. A visual example of the player with the basic weapon can be seen in Figure 4.2.
• Weapon: The weapons can each shoot an infinite amount of shots without needing reloading or extra ammunition. There are three different weapons available to the player
- the single shot weapon which the player starts with.
- the burst fire weapon which fires three bullets per burst but with a slightly longer delay between bursts than the single shot weapon.
- the shotgun weapon, which fires four bullets per shot, each bullet having a chance of receiving a small random offset in the direction they will be shot, firing with less frequency between shots than the other two weapons. The weapons can shoot an infinite amount of shots.
• Enemy: A simple enemy entity with a simple AI which will navigate towards the player on alert and attack them if close enough. The AI uses Unity’s NavMeshAgent, the area it can navigate through has been baked on the floor mesh and the walls that are put on the floor will carve a hole in the baked NavMesh, removing that area from which the enemy entity can walk. The enemy AI has a field of view and will be alerted if the player enters the enemy’s field of view. The enemy will also be alerted as soon as the player fires a shot in the same room. When alerted, the enemy will not stop being alerted unless the player leaves the room. Enemies have only one health and will be defeated by being shot once. An example of what the enemy looks like can be found in Figure 4.7.
• Door: Each door tile in a room is connected to another door tile in another room. When the player entity moves into a door, the player will be transported into another room to the position of the door that is linked to the door the player came from. The in-game representation of which can be found in Figure 4.8.
• Key: Some rooms will have a key located in them. If they do, all the doors in the same room will be locked upon entering that room and the player will not be able to leave the room until the key has been collected. A key will only spawn if there is a locked door in the room and no locked doors can spawn if there is no treasure in the room. A key can be obtained by moving into its position.
• Score Treasure: Small blue orbs, as seen in Figure 4.6, which increases the player’s score upon collection. Score treasure can be obtained by moving into its position.
• Weapon Treasure: Large blue orbs that contain a weapon. Collecting one can change what weapon the player entity holds. Weapon treasure can be obtained by moving into its position. • Boss: An enemy of larger scale. This enemy moves slower. In addition to having the close-range
attack like the regular enemies does, this enemy also has a ranged attack, being able to shoot five shot bursts towards the player’s position. The boss can withstand 10 attacks before it dies. When a player is in a room, the room’s full layout is completely visible to the player as well as the positions of all the enemies, treasures, keys, and doors. Information that is not available to the player is what is in the other rooms, where each door leads to, and how much health the enemies have. The objective of the game is to go through all of the rooms of the current dungeon without dying.
4.2
UI
When building the artefact, we were not overly concerned with the UI, as such the UI choices were artefact were rather simple:
• We have a start screen where the player can select between four different pre-generated maps. There is also a test map which is more intended for testing out the mechanics. What this menu looks like can be seen in Figure 4.3.
• To convey to the player how well they were doing during play the player's life and score is visible in the top left corner of the screen as seen in Figure 4.4.
Figure 4.3. UI menu element showing the
Figure 4.4.
selectable maps and which order they are
UI element describing the players
to be played in.
current health and score. Currently
showing a health of 9 (nine) and a score
of 1 (one).
4.3
EDD tiles translated
The game was created with the intention of being simplistic and not adding too much beyond the types of content already created by EDD. As such we have only added game mechanics where we felt there was a need to do so, for example, by adding different kinds of treasure. In this section, each available type of tile that is used within EDD for generating maps are described. The representations of the game entities as seen in EDD can be found in Figure 4.5.
• Floor: If the tile from EDD is a floor tile, the space is empty in the game. • Wall: On a wall tile, a wall object will be placed in the game.
• Enemy: Wherever an enemy tile is placed in EDD, the game will load an enemy entity.
• Door: The door tiles will hold the information of which door they are connected to in which room. We have added another functionality where doors will randomly need a key to be opened, as mentioned in section 4.1. This function is not a part of EDD.
• Treasure: Treasure has been parted into three different kinds of treasure: Score treasure, which increases the player's score; Weapon treasure, which can swap out the player’s current weapon into another; and Key, which is used to unlock a locked door in the current room. There is only one kind of treasure tile in EDD, the type of treasure is therefore determined within our artefact. The visuals on each treasure type differs so that the player can distinguish each treasure with ease.
• Boss: The boss tile takes up 3x3 grid spaces, unlike all the other tiles that have the size of 1x1. In the game this tile spawns a boss enemy larger than the standard enemies. Visually it is simply the same enemy as in Figure 4.7, but it is three times as large.
Figure 4.5. The representations of Figure 4.6. The representation of The Different tile types as seen in EDD a treasure tile as seen in our artefact
Figure 4.7. The representation of an enemy Figure 4.8. The representation of
.as seen in our artefact. a door as seen in our artefact.
5. Experiments
We performed 14 tests, our testers were aged 18-27 years old and 13 of the testers had some or extensive experience with dungeon crawler games and one did not. The tests were mainly performed using Discord [28] (a service enabling us to talk to the testers and see what they were doing over distance) and OBS (Open Broadcaster Software, a software allowing us to record the participants screen) [29] (to record both what the testers were streaming but also their voices), the reason we decided to perform all our tests over distance instead of in person was because of the Covid-19 virus pandemic and the recommendation by both Malmö University and by the Swedish government to stay at home and not meet in person.
The structure of our experiments was as follows:
• The tester played through 4 maps. After each map played, the tester answered a set of questions about how difficult they experienced the map to be and how aesthetically pleasing the disposition of game items were. We showed the testers pictures of the rooms to ensure that there
was no confusion about which room was which. This was especially important since certain maps allowed the player to visit rooms in a non-sequential order.
• During the playtests the players were encouraged to talk aloud about the map, during which time we recorded and then transcribed what was said to later use for our analysis.
5.1 Think-Aloud:
During the tests we encouraged the testers to talk aloud about their experiences and thoughts about the map. This was recorded and then transcribed so we could use the relevant parts for our analysis. The difference in relevance between the think-aloud data and the data from our questionnaire is that data collected by the think-aloud is usually more in-depth and qualitative [22]. The data collected during the think-aloud may also be less formal [22] meaning that if there is something they find difficult to voice in the questionnaire they might find it easier to simply tell us person to person. The way we will be analyzing data recorded from the think-aloud is to look for patterns in their experience, such as for example: voicing dislike for something, that they particularly liked something, or that they think something should be changed. During this recording we also recorded whenever the players died which may prove useful when comparing the leniency of the maps.
5.2 Questionnaire:
We made the decision to have both multiple-choice questions and free-text questions in our questionnaire. The reason we wanted both is so that we both get some quantitative data that is easier to analyze from the multiple-choice questions and some qualitative data which goes further in depth from the free-text questions [22]. The quantitative data is also easier to relate to the EDD and the automatic evaluations of the maps recorded when we created them.
Within the questionnaire we also included some questions about the tester, such as age and previous experience with dungeon crawlers.
The quantitative questions asked were about the testers’ experience regarding the objectives of the metrics, leniency and symmetry, that we evaluated. These objectives of the metrics were:
• Leniency - calculates at any given point how challenging the room is. It does so by using the number of enemies in the room as well as how safe the doors in the room are and the counterbalancing amount of treasure within the room.
• Symmetry - is the consideration of the aesthetic aspects of the room and is calculated by X and Y axis as well as diagonal backslash and front-slash through the room. The highest value is then used as the score of how symmetrical a room is.
We concluded to ask the testers about how difficult they found the maps to be (“Rate how difficult you found the rooms in the third map to be, where 1 being not so difficult and 5 very difficult.”) and then when analyzing the result flipping the scale so as to be more in line with the leniency metric, which goes from difficult when it is low to easy when it is high. The other quantitative question we put forth was “Rate how logical/aesthetical the placement of game entities (walls, enemies, treasures) were in the rooms in the first map, where 1 being the lowest and 5 the highest.”. By stating this question, we tried to relate the goal of the symmetry metric in EDD [7] to what a tester should experience where a high symmetry should result in a more aesthetical map and a low symmetry should result in a less aesthetical map.
5.3 The maps
These are the maps we created for the tests. Along with the maps, the goals/metrics they were created with are also listed here. In EDD each metric has a score between zero (0) and one (1). We chose to have four maps for the testers as we thought the tests would take an appropriate amount of time, meaning the testers would have enough time to form a proper understanding of the game and the maps.
5.3.1 MAP 1
In the first map the rooms were all created using the leniency and symmetry metrics in EDD to different extents. When making these rooms we selected our metrics in EDD and chose the first room suggested with the values we were looking for. The resulting rooms in EDD can be seen in Figure 5.1. When numbering the rooms, we go from room 1 at the top left, room 2 top right, room 3 middle left etc. The first map loaded into our artefact can be seen visualized in Figure 5.2.
Room 1: leniency-1.0 symmetry-1.0. Room 2: leniency-0.6 symmetry-1.0. Room 3: leniency-0.2 symmetry-1.0. Room 4: leniency-0.6 symmetry-0.4.
Room 5: leniency-0.4 (with the added note that one enemy was turned into a boss-enemy) symmetry-0.2.
This can further be seen in Figure 7.1.
Figure 5.1. What the entirety of the first map Figure 5.2. What the entirety of the first
looked like while in EDD. map would look like with the rooms laid
out in the same manner as in Figure 5.1. but in the artifact
5.3.2 MAP 2
In the second map the rooms were created by us with the goal of making them easy, medium or hard for a player to go through victorious. When designing them we ensured to keep the same range in the leniency score as the, from EDD, generated rooms in MAP 3. The resulting map as seen in EDD can be found in Figure 5.3 and then as seen in our artefact in Figure 5.4.
Room 1: easy leniency-1.0. Room 2: medium leniency-0.5. Room 3: hard leniency-0.1. Room 4: easy leniency-0.8.
Figure 5.3. What the entirety of the second map Figure 5.4 What the entirety of the second
looked like while in EDD. map would look like with the rooms laid
out in the same manner as in Figure 5.3. but in the artifact
5.3.3 MAP 3
The third map was created in EDD entirely with the leniency metric in mind. The results of which are visualized in Figure 5.5 as seen in EDD and in Figure 5.6 as seen within our artefact.
Room 1: leniency-1.0. Room 2: leniency-0.5. Room 3: 0.1.
Room 4: leniency-0.8.
Room 5: leniency-0.33 (with the added note that one enemy was turned into a boss-enemy). This can further be seen in Figure 7.1.
Figure 5.5. What the entirety of the third map Figure 5.6. What the entirety of the third
looked like while in EDD. map would look like with the rooms laid
out in the same manner as in Figure 5.5. but in the artifact
5.3.4 MAP 4
MAP 4 was once again created in EDD with both leniency and symmetry in mind but with a different layout for how the rooms are connected. The layouts and connections are shown in Figure 5.7 and as it was later played through in Figure 5.8. These rooms were created by choosing the metrics we wanted followed by selecting the first room with the right scores suggested by EDD.
Room 2: lenience-0.4 symmetry-0.6 Room 3: leniency-1.0 symmetry-1.0. Room 4: leniency-0.6 symmetry-0.4. This can further be seen in Figure 7.1.
Figure 5.7. what the entirety of the fourth map Figure 5.8. What the entirety of
Looked like while in EDD. map would look like with the rooms laid
out in the same manner as in Figure 5.3. but in the artifact
6. Results
In this section we will bring up and show all results from the tests involving the artefact. This will include both the data gathered from the questionnaire (Found in Appendix 1) and the results from the transcribed think-aloud.
6.1 Presentation of quantitative data
6.1.1 MAP 1
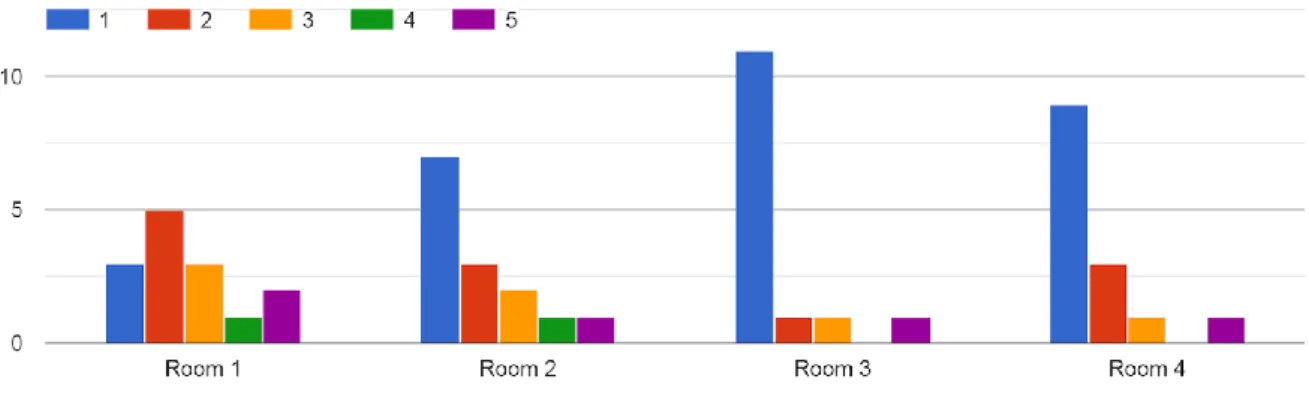
As is discussed in section 5 the first map was created using both the leniency and the symmetry metrics within EDD. As such we put forward these two questions and received the results presented in Figure 6.1 and Figure 6.2:
Figure 6.1 shows the answers to the question regarding the difficulty level of the different rooms in the first map where 1 means they found the room easy and 5 meaning they found it very difficult.
Figure 6.2 shows the answers given to the second question about the rooms in MAP 1. This question is about how subjectively aesthetically pleasing they found the rooms in MAP 1 to be with 1 being the lowest and 5 being the highest.
6.1.2 MAP 2
As MAP 2 was created by us simulating what our perceived difficulty level would be while still fitting with the same range of leniency scores as MAP 3. The only question about this map is about the difficulty level experienced by the players, as shown in Figure 6.3:
Figure 6.3 shows the answers to the question regarding the difficulty level of the different rooms in the first map where 1 means they found the room easy and 5 meaning they found it very difficult.
6.1.3 MAP 3
As MAP 3 was created with only the leniency metric being actively used, we only had one quantitative question about this map. The results are shown in Figure 6.4:
Figure 6.4 shows the answers to the question regarding the difficulty level of the different rooms in the first map where 1 means they found the room easy and 5 meaning they found it very difficult.
6.1.4 MAP 4
The rooms in the fourth map were created using both the symmetry and leniency metrics in the EDD; as such there are once again two questions about this map. The results for the leniency are shown in Figure 6.5 and the results for symmetry in Figure 6.6:
Figure 6.5 shows the answers to the question regarding the difficulty level of the different rooms in the first map where 1 means they found the room easy and 5 meaning they found it very difficult.
Figure 6.6 shows the answers given to the second question about the rooms in MAP 4. This question is about how subjectively aesthetically pleasing they found the rooms in MAP 4 to be with 1 being the lowest and 5 being the highest.
6.2 Presentation of Qualitative Data
6.2.1 Questionnaire free-text
The questions in our questionnaire (found in Appendix 1) that allow for the tester to write free-text about their experience are of two different kinds. The first one being focused on the perceived difficulty and aesthetics, and the second about the connections of the rooms to each other. The first kind of question is more important for answering our research question while the second one is a way for us to make sure the players did not have significantly different experiences based on their chosen path throughout the dungeons. The second question also lends us some insight into how we could have designed maps differently with more connections in mind and might support any future work which includes maps created in EDD.
Moreover, we decided to analyze all the free-text questions of the first kind together for common themes as a lot of the answers were not tied to our subject, but rather about the game-design itself (example: people complaining about the shotgun weapon).
Consequently, the themes we found within the answers were two-pronged. The first one was an overall dislike for when the enemies were very close to the doors of a room, when this was the case in one of the rooms in the map the answers to the questions about the map were all influenced by that one room. There are several testers who voiced that this resulted in taking damage or dying before they could react properly or making up a strategy for the room they just entered. Similarly, some players praised the second map for simply not having any enemies close to the doors proving that their experience from earlier maps had made them apprehensive about the enemy’s placement going into that map. An example of this was one tester who answered: “inga direkt innanför dörrarna vilket va bra” which translates to none directly inside the doors which was good meaning they found it an improvement that there were no enemies by the door in the room they traveled to.
Finally the second theme was that maps 2 and 4 felt more linear and easier than maps 1 and 3. An example would be: “den här banan var roligare men lite för lätt generellt sett, jag gillade bossrummet” which translates to this map was more fun but a bit too easy generally, I liked the bossroom and this seems to be a common direction between a lot of the testers.
6.2.2 Think-Aloud
When inspecting the transcribed text from the think-aloud, there were several main themes that became apparent. The first one being a general dislike for enemies that were placed too close to a door
when the player entered a new room, it made it feel unfair, or as a “dirty move” as one player put it. This was pointed out many times. This was not something that the players necessarily perceived as hard, but instead they saw it as unfair. Some of the rooms that had enemies by the door were rated as having low difficulty by the players, but they still pointed out that they didn’t like that they took damage and that they could not really do anything to avoid it. In some cases, on the other hand, an abundance of enemies next to the door resulted in the player giving the room a higher difficulty value. Furthermore, some players lost interest in retrying if the rooms they died in were rooms they considered to be unfair. On the contrary the players were motivated to keep trying if a room seemed hard but beatable, as they found the challenge to be more fun. Players got very excited when they beat the more challenging rooms. Another theme tied to the perceived difficulty is that players did not think the rewards were appropriate for the difficulties of the room. For example, the first room in MAP 1 had a lot of treasure but the boss-room had only one treasure.
Moreover, another theme we picked up on was that the players thought the enemies and the boss appeared to be more or less threatening depending on the map layout. One player was sure they had different logic (smarter/dumber AI) between maps and that the bosses had a different amount of health. When told that was not the case the tester identified that it was most likely because of the layout of the room rather than any other advantage.
Something we found to be the case for all the testers was that they could identify which rooms were supposed to be hard or easy. The more interesting results were rather in the differences between the hard maps as most of them were made with somewhat similar difficulties in mind but with some different end results. In this vein, several players voiced that having a room with a boss made the maps more exciting. The map that did not have a boss seemed to leave the players disappointed and underwhelmed.
Another theme that emerged is that players enjoyed the layout of the rooms that we designed ourselves more than the other maps. They found them to be notably more aesthetic. For instance, the players pointed out that some of the rooms that were generated by EDD looked random, that some spaces/areas did not make sense and that they were not very aesthetic. Rooms where the walls formed actual paths or room-like areas were more appreciated by the players, both in the rooms created by us and the rooms created automatically in EDD. Similarly, players seemed to enjoy the emptier rooms less than the rooms that had a larger number of walls or enemies. In fact, players stated that the map that had a lot of empty space, few enemies and no boss were, to list some quotes, “anticlimactic” and “lame”.
Lastly, players became confused over the layout of the full map if there was a large amount of connections (doors), for example if the connections could eventually lead to the same room you have been before (the difference being that you may have killed enemies or lured them away from their original positions) by simply walking in one direction.
7. Discussion
In this section we will discuss and evaluate the results based on their relevance to the stated RQs. Furthermore, we will also discuss the weaknesses and limitations of the study and the artefact. We took into consideration the fact that the different weapons might influence the opinions of the testers during the maps, but what little effect the difference in weapons had, no player was overly vocal about it other than a small complaint here and there. As such we could not find any large theme regarding the weapons, rather, the players seemed to use whichever one they personally liked the most. A contributing factor to the weapons not changing the outcome much is that they were deterministically spawned, so every player usually had the same weapon at any point and the weapons were generally quite balanced and it was therefore more personal preference which led players to use one weapon or another.
7.1 Evaluating the Metrics
7.1.1 Leniency
We have seen a common theme throughout the results that the players have understood the difficulty level of the rooms in the different maps and in general attributed the rooms to a difficulty level
close to what we imagined when creating the maps. An example of this in the first map, seen in Figure 5.1, is the three first rooms which were created with leniencies of 1.0, 0.6, and 0.2 where 1 results in the easiest room and 0 in the most difficult. When looking at Figure 6.1 we can see that the players mostly rated the first room as a 1 on a scale of 1-5 where 1 is the easiest and 5 is the hardest. They subsequently rated room 2 mostly with scores of 2 or 3, meaning it was on the easier side as well which fits the score of the metric used for that room (0.6). Finally, in room 3 there is a majority of players rating it as a 5, meaning being very difficult, with a minority rating it as a 3.
However, there is also a possibility that the reason why there are several cases where room 2 and 3 in MAP 1 that share the same scores was because of the disposition of the enemies, rather than the number of enemies and the locations of the walls. As it stands the second room has enemies quite close to its doors while room 3 does not, this was cited by some players as something undesirable and difficult as stated in 6.2.1 and 6.2.2. In addition, this becomes more apparent in MAP 3, seen visualized in Figure 5.5, where the most difficult room (room 3) and the boss-room (room 5) have differing leniencies. Room 3 has a leniency of 0.1 while room 5 has a leniency of 0.33, but the questionnaire results in Figure 6.4 shows that more people thought room 5 was harder than room 3. To further add to this, the biggest difference between those two rooms is the fact that room 5 has 3 enemies directly after entering the room (with another two very close as well) whereas in room 3 the enemies are placed a bit further into the room.
Furthermore, when we look at the differences between MAP 2 and MAP 3, which were both created with similar leniency scores in mind, there is a difference in the ratings attributed to them in Figure 6.3 and Figure 6.4. The rooms in MAP 2 received lower scores on their difficulty in general, with exception of room 4. We think this is because of two reasons. Primarily, there are more walls in MAP 2 than in MAP 3 and those walls form more corridors as well as feed into a more linear playstyle which makes it easier, especially for more experienced players. This means there might be a correlation between challenge or linearity. Secondarily, there are no enemies directly by any of the doors, this can be seen especially in the differences between room 2 in MAP 2 and MAP 3. In MAP 3 room 2 there is an enemy beside the door when you enter and a group of enemies not far away while in MAP 2 room 2 there are no enemies next to the door.
Though there is a consideration in the leniency metric in EDD to the proximity of enemies and doors [7] there was a significant number of players who disliked that it was even a possibility for so many enemies to be placed so close to the doors.
Figure 7.1. Table showing the leniencies and symmetry scores used for the rooms in the
different maps. The scores for MAP2 are directional as it was not automatically created.
7.1.2 Symmetry
When looking at Figure 6.2 we interestingly see that the room which seems to score the highest in MAP 1 is room 5 with room 3 coming in second. What makes this interesting is that room 5 was created with a symmetry score of 0.2 (low) while room 3 was created with a symmetry score of 1 (high). Furthermore rooms 1, 2 and 4 were created with symmetry scores of 1, 1, and 0.4 respectively and they all received significantly lower scores by the players who gave room 1 the worst score out of all of them when it comes to how aesthetically and logically dispositioned the map elements are.
Likewise, in MAP 4 we can clearly see in Figure 6.6 that the players rated the first room the highest, which was created with a symmetry of 0.2. The second room in MAP 4 was created with a
symmetry of 0.6 and it also rated higher than room 3, which was rated the lowest and was created with a symmetry of 1.0.
Finally, we considered the leniency together with the symmetry and it seems the rooms which were rated higher on how aesthetically and logically they are laid out are the rooms which also have somewhat higher leniency. The three rooms which received the highest ratings regarding aesthetics were room 3 and 5 in MAP 1, and room 1 in MAP 4. In their respective maps those rooms were the ones with the lowest leniency (thus the more difficult). So, the rooms which were rated higher regarding their aesthetic were the more difficult rooms, not the ones with higher symmetry. This runs somewhat contrary to what Mariño et al. found [15], and there may be several reasons as to why that is. Our first thought is that symmetry on its own is more relevant for a platforming game because when platforms are placed in symmetrical layouts in the air, they are more usable to the player. Also, because there are more different game-entities in IMB than there are in EDD and our game. This could mean that there is a larger chance of their generator placing an item where EDD might simply place floor tiles.
As such, from what several players noted in 6.2.2 it seems that the players were more interested in rooms with more game elements. The players simply did not like it when there was a lot of open space in a room and preferred when that room was populated with either walls or enemies.
7.2 The Artefact
EDD provides only the information of what will be in a map and does not have any impact on the behavior of the content in the map when it is used in an artefact like our game. With this in mind, designing a game to match the differences in difficulty in the same way that EDD does could be challenging for the designer. In our case, the game we designed was fast paced. Therefore, the rooms where enemies are located right by an entrance might seem extraordinarily difficult, or even unfair, as some players have stated, this is largely because the players will have a hard time to react as quickly as the enemies does. The positioning of the enemies might have had a different impact on the player’s experience if the game would have been turn based or if the movement in the game was more tile-based. Likewise, how the combat is handled is also an important factor. The maps we used could be perceived differently if we, for example, would not have used the function where all enemies became alerted as soon as a shot was fired in the same room. For instance, the maps that have a more open layout with few walls became tough for players if they had many enemies, as the players would easily get surrounded and oftentimes went with the strategy to back into a corner in order to try avoiding taking too much damage. At the same time, the maps that had more walls that formed paths and room-like areas proved to be easy for the players, as the enemies basically lined up as a result to them all becoming alerted at once and therefore became very easy to defeat.
If we, for instance, would have limited the enemies’ AI behavior to only move when the player was in line of sight, the previous examples could have ended up completely different. The open spaces would probably be considered easier to beat than in our version, as players would have been able to defeat them without even having to alert them. On the other hand, the rooms with many walls and narrow paths would most likely become much more difficult, as players would have to engage enemies in narrow and enclosed spaces which could make it more difficult for the player to avoid taking damage.
Several balancing changes were made during the development phase so that the maps would match the difficulties suggested by EDD as well as possible. These changes were mainly made on the health and speed of the different living entities, which includes the player, the enemies and the boss. Similarly, the fire rates of the weapons were also carefully decided upon so that no weapon would have made a far too great impact on any map’s difficult level.
8. Conclusion
The tests we performed with our artefact yielded satisfying results which, after some discussion, led us to three main conclusions regarding our research questions:
• RQ: How is the players’ experience affected when we apply different ranges of feature dimensions in EDD, and how does it differ from how EDD evaluates them?
o SubRQ1: How is symmetry connected to how aesthetical a room is perceived to be by
a player?
o SubRQ2: How is leniency connected to how difficult a player perceives a room to be?
8.1 The Difference Between Human and Automatic Evaluation
When discussing the results, we found that the main difference appeared in the evaluation of the aesthetics of the rooms, which was to no surprise as it is the more subjective of the two metrics we used.
The point we wanted to bring forth about the symmetry is that our results seems to be showing that it is not tied to how aesthetical a room is perceived to be to the extent that we first thought. When using a higher symmetry value, it did not make the players consider the maps more aesthetic, rather, this was instead achieved when the leniency metric was lower. The goal stated for symmetry in [7] is to make a room which would be considered more aesthetic. We would suggest either some changes to the symmetry metric, if that should continue to be its goal, or to implement a new metric with that goal in mind. If we wanted to change the metric we would either split it up to give open floor space a lesser value, as emptiness has been one of the things commented about by our testers as a negative in this regard. Or give some value to symmetry of spatial and/or meso patterns. If we would want to create a new metric with aesthetics as its goal, we would use the already present spatial and meso patterns together with linearity to create a map with a structure based more on patterns and choice. In other words, symmetry without other concerns might not be the best choice to evaluate the aesthetics of a dungeon crawler room.
On the other hand, when looking at the leniency metric, the human and automated evaluations were closer to each other. Furthermore, when reading how the leniency metric is defined in [7], the three things that matters the most are the number of enemies, the proximity of the enemies in relation to the doors and the amount of treasures in the room. Of those, both the number of enemies and the proximity to the doors were things also considered by the players when they evaluated how difficult they perceived the rooms to be. Our testers did not like the aspect of enemies spawning very close to the doors. That aspect of the leniency metric could be improved upon so that the enemies could be clustered close to the doors but perhaps not in the immediate neighboring spaces to the doors. Additionally, the weight for having enemies appearing close to doors could be increased, so that EDD’s leniency metric would evaluate such maps as having an even lower leniency score, as the human testers usually scored maps with enemies close to the doors significantly higher than those without.
8.2 Future work
With this study we have brought up aspects of automatic evaluation in level design heuristics that could be improved upon in order to better match what a human player expects. However, we believe that there are vast possibilities to further expand the research that has been performed in this paper, for example by making similar tests for artefacts in the forms of games of other genres or with different mechanics than the artefact that was developed for this study. To list some examples, the importance of certain metrics could vary depending on how the enemy AI perceives its surroundings or how the combat is handled. As discussed in section 7.2, making slight alterations to aspects of the game could change how the maps are perceived by the players and therefore could be of interest for future work on this topic.
Furthermore, we could also see further research with the other metrics in EDD being performed either with our artefact or with some similar artefact used in a user study. This would show if there are