Faculty of Technology and Society Computer Engineering
Bachelor Thesis
Development of a prototype program for configuring
Vapour Recovery in fuel dispensers
Utvecklingen av ett prototypkonfigurationsprogram av Vapour Recovery för bränslepumpar
Jonatan Fridsten
Robin Johnsson
Exam: Bachelor of Science in Engineering Subject Area: Computer Science
Supervisor: Magnus Krampell Examiner: Olle Lindeberg
Sammanfattning
När man tankar kommer det ånga från bränslet. Denna ånga sprids ut i atmosfären och är ett miljöproblem. För att motverka detta finns bestämmelser världen runt som kräver att bensinpumpar i teorin suger tillbaka all ånga för att hjälpa motverka dess effekt. För att pumparna skall kunna göra detta optimalt skall de konfigureras. Konfigureringen utförs traditionellt sätt manuellt. Dover Fueling Solutions vill dock utveckla ett digitalt system för att utföra en del av konfigureringen. I rapporten beskrivs utvecklingen av en prototyp för ett konfigureringsprogram. Hur dess användargränssnitt kan influeras av riktlinjer utforskas även. Den slutgiltliga prototypen är ett konfigureringsprogram som uppfyller kraven från Dover Fueling Solutions och har ett grafiskt användargränssnitt utformat med hjälp av riktlinjer.
Abstract
When using a fuel dispenser at a filling station the fuel emits vapours. This vapour can escape into the atmosphere and cause environmental problems. To counteract this there are regulations that fuel dispensers must recover the vapour. To keep the fuel dispensers working properly with their Vapour Recovery, calibrations needs to be done. These cal-ibrations are traditionally made manually. However the company Dover Fueling Solutions are looking at creating a configuration program to replace parts of the manual calibration. In this thesis the development of a prototype for such a program will be described. The prototype that is developed will also be the subject of different design choices, and how guidelines can be used when developing a graphical user interface. The developed pro-totype fulfills all requirements set by Dover Fueling Solutions and incorporates graphical user interface guidelines.
Acknowledgements
We would like to thank Mattias Mårtensson and Gustaf Gustafsson at Dover Fueling Solu-tions for the opportunity to carry out this thesis. Their help and expertise was invaluable for the project. We also want to give special thanks to Magnus Krampell for all the feedback and coaching during the work of the thesis.
Contents
1 Introduction 1 1.1 Background . . . 1 1.2 Configuration system . . . 2 1.3 Research Aim . . . 3 1.4 Research Questions . . . 3 1.5 Limitations . . . 3 2 Theoretical Background 4 2.1 Vapour Recovery . . . 4 2.2 Serial Communication . . . 4 2.3 K-factor . . . 42.4 Graphical user interface guidelines . . . 5
2.4.1 Microsoft Guidelines . . . 5
3 Related Work 6 3.1 "Model-based design and analysis of permission-based security" . . . 6
3.1.1 Comments . . . 6
3.2 "The Landscape Plant as Spatial Element Used in the Construction of Para-metric Configuration System" . . . 7
3.2.1 Comments . . . 7
3.3 "Error Calculation System for Mexican Fuel Dispensers through a Mobile Application" . . . 8
3.3.1 Comments . . . 8
4 Method 9 4.1 Nunamakers and Chenss methodology . . . 9
4.1.1 Construct a conceptual framework . . . 10
4.1.2 Develop a system architecture . . . 10
4.1.3 Analyze and design the system . . . 11
4.1.4 Build the system . . . 11
4.1.5 Observe and evaluate the system . . . 11
4.2 Workflow . . . 12
5 Results 13 5.1 Construct a conceptual framework . . . 13
5.1.1 Litterature study . . . 14
5.2 Develop a system architecture . . . 14
5.2.1 Basic GUI design . . . 16
5.3 Analyze and design the system . . . 16
5.3.1 Class diagram . . . 16
5.3.2 Sequence diagram . . . 17
5.4 Build the system . . . 21
5.4.1 The final design . . . 22
5.4.2 Creating Graphs . . . 27
5.4.3 Restricting access and locking the prototype . . . 28
5.4.4 Using guidelines to further the look and usability . . . 29
5.5 Observe and evaluate the system . . . 29
5.5.1 Evaluation of the prototype . . . 30
5.5.2 Evaluation of the GUI . . . 31
6 Analysis and Discussion 33 6.1 Analysis of Results . . . 33
6.1.1 Why we choose Microsoft Guidelines . . . 33
6.1.2 Choosing the security level . . . 33
6.1.3 Meeting the requirements . . . 34
6.1.4 Regarding Feedback . . . 34
6.2 Method discussion . . . 34
6.3 Complying with the ATEX-directive . . . 34
6.4 Comparison with related works . . . 35
7 Conclusions and Further Work 36 7.1 Answering Research Questions . . . 36
7.2 Contributions . . . 36 7.3 Future Work . . . 36 Appendices 39 Appendix A. . . 39 Appendix B. . . 41 Appendix C. . . 45 Appendix D. . . 48 Appendix E. . . 49 Appendix F. . . 51
1
Introduction
1.1 Background
Automobiles, motorcycles and other vehicles are an important aspect of human lives. Al-most every person in the developed world are in some kind of contact with them every day [1]. Majority of these vehicles use petroleum or diesel [2] as fuel to work. The amount of petrol used every day is around 1.1 billion litres [3].
To get the fuel into a vehicle a special machine is needed. This machine is called a fuel dispenser, also known as petrol pump or gas pump, and it takes the desired fuel from an underground tank and into the vehicle. To get the fuel a customer has to pay for it, and they do not want to pay for more than what they get. At the same time the vendor does not want the dispenser to deliver more than the customer payed for.
To balance this the dispensers are calibrated to deliver the correct amount of fuel. But the dispensers have more tasks than just dispensing fuel, they also have the task of retrieving back the vapours from the fuel. This process is called vapour recovery, henceforth referred to as VR, and it is a important facet of fuel dispensers. The amount of vapour that should be recovered differs country to country, but as an example; in Europe the amount of vapour that should be recovered is 1:1 to the amount of fuel dispensed [4], one litre of fuel pumped into the tank should result in one litre of gas recovered.
To make sure that the amount of fuel dispensed, and the VR is accurate the fuel dispensers needs to be configurable and testable out in the field. Configurations and tests have traditionally been done with certain tools.
Dover Fueling Solutions [5] is a company with over 120 years of experience in fueling system. They are leading the development for new fueling solutions and payment methods [6]. The company Dover Fueling Systems, henceforth mentioned as DFS, wants to look into the possibility of changing the traditional VR configuration system into a digital version where a computer program can replace some of the currently used tools. DFS knows what the basic functions of the program should be, but they do not have a set idea on how the final product might look like and what functions it might have added. This thesis aims to create a prototype for such a configuration program, and give DFS an idea of what it might look like.
1.2 Configuration system
Currently different calibration tools are used when calibrating VR for a fuel dispenser. One maker of such tools is Bürkert [7]. These tools are connected to the fuel dispenser and the calibration process can begin. Readings from the calibration are presented to the technician, and if any changes needs to be made the technician turn knobs to change the values of the fuel dispenser.
Since the Fuel dispenser is running and there is high voltage power while a calibration is done, there is risk of serious injury for the technician.
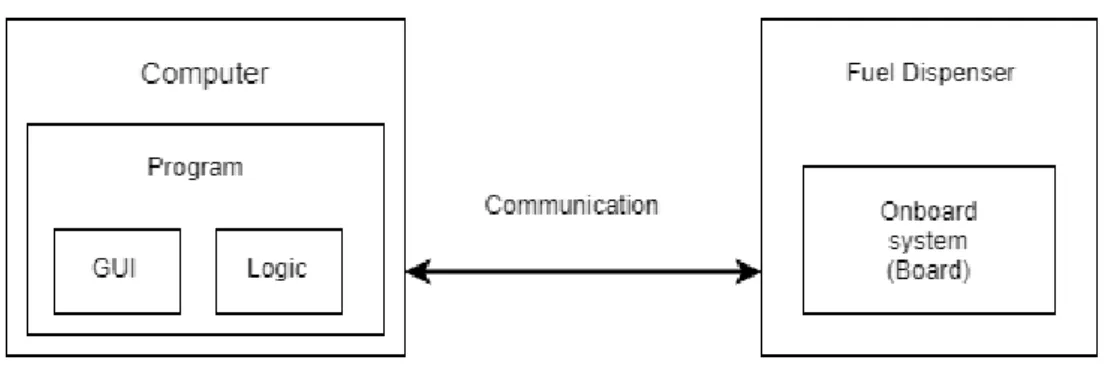
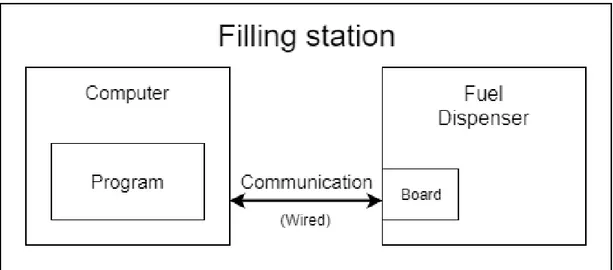
The prototype requested by DFS is a Windows application which gives the user the ability to read and write data to a board, embedded system, in fuel dispensers, see Figure 1. The information that can be read includes things like temperature and "K-factor", see section 2.3. In each fuel dispenser the board can control two pumps.
The prototype is as mentioned going to run on a computer with Window operation system. The prototype has its main use at a filling station, as seen in Figure 1. At the station, the computer can be connected to the fuel dispenser by a service technician to start the reading of parameters and values. If any changes needs to be made to the values in the dispenser, then the technician update and apply them. After updating the values the technician can start a calibration.
Since the location is a filling station, where large amounts of explosive and flammable material is located, an external computer is not allowed to be plugged into a fuel dispenser during a calibration [8]. When a service technician starts a calibration the connection between the computer and the board must be disconnected. During the calibration process, the technician moves away with the computer from the fuel dispenser and waits for the process to be finished. After the calibration is finished the technician may reconnect the computer with the fuel dispenser.
Another location for the use of the prototype requested by DFS is at an engineers workplace. Here a computer with the prototype is also connected to the board, but the board is removed from the dispenser. The prototype has a mode for engineers which has more functions available than the mode for service technicians. The engineer have extended user rights and can therefore access this mode.
1.3 Research Aim
The aim of this thesis is to develop a prototype configuration program for fuel dispensers. The prototype should help DFS to develop their own configuration program by showing how one might look like. This prototype should make use of current trends in graphical user interface design while satisfying all requirements from DFS.
1.4 Research Questions
RQ1 How can graphical user interface standards be used in a digital configuration program for fuel dispensers?
RQ2 How complete does a prototype need to be for the customer to be able to give feedback on the graphical user interface, sufficient for creating a first version of a product?
1.5 Limitations
The programming language was chosen to be Java, a limitation that was brought forward during a meeting with DFS. During the same meeting with DFS there was an agreement that the graphical user interface, GUI, of the program should be evaluated with the help from technicians at DFS.
Another limitation on the system is that according to the ATEX-directive [8] a com-puter is not allowed to be connected to a fuel dispenser during calibration due to the explosion hazard.
2
Theoretical Background
2.1 Vapour Recovery
Vapour recovery is the process of retrieving back vapours that leaks during the refueling process of a vehicle or during the unloading of petrol. Vapour recovery is handled by vapour recovery units, and are located in the fueling pumps at service stations, and also exist in the tankers that load the service stations.
Vapour recovery is used partly for the recapturing of gas vapours which can be made into a usable and profitable product [9], but the main reason for using it are the laws and regulations surrounding vapour emissions. In 1994 EU introduced a legislation referred to as "Phase 1" [10] which regulates vapour recovery during unloading from a tank truck into a service station. In 2009 "Phase 2" [4] which concerns the refueling process of vehicles at service stations was introduced. Article 4 in Phase 2 regulates that the ratio between petrol pumped out and vapour recovered should be between 0.95 and 1.05 [4].
2.2 Serial Communication
One way of communicating between a Java program and an embedded system is by using a serial port. Because Java is based on a virtual environment the connection must be made between the virtual environment and the physical serial port. To do this existing libraries can be used. RXTX is a library created by Fizzed [11], that helps with implementing communication over the serial port.
2.3 K-factor
When calibrating VR in a fuel dispenser, DFS uses a value called K-factor. This factor is used to offset the difference in flow between air and fuel, since fuel is not used during a calibration but air is.
2.4 Graphical user interface guidelines
There exist many different types of guidelines related to GUI. Some are specified for mo-bile systems e.g [12][13] and others for computer systems e.g [14][15][16]. The different guidelines are often well documented and explains on a high level of detail about every aspect of how the user interface should be implemented.
2.4.1 Microsoft Guidelines
Microsoft’s [14] vision off a powerful application is defined by the right combination of seven different keywords. One important aspect of the application is allowing the end user full control over their work.
The seven keywords [17] by Microsoft are as follows: • Enabling
The application satisfies the needs of its target users, enabling them to perform tasks that they couldn’t otherwise do and achieve their goals effectively.
• Efficient
The application enables users to perform tasks with a level of productivity and scale that wasn’t possible before.
• Versatile
The application enables users to perform a wide range of tasks effectively in a variety of circumstances.
• Direct
The application feels like it is directly helping users achieve their goals, instead of getting in the way or requiring unnecessary steps. Features like shortcuts, keyboard access, and macros improve the sense of directness. • Flexible
The application allows users complete, fine-grained control over their work. • Integrated
The application is well integrated with Microsoft Windows, allowing it to share data with other applications.
• Advanced
The application has extraordinary, innovative, state-of-the-art features that are not found in competing solutions.
Microsoft’s guidelines tells the developer to keep the design simple, yet powerful. This can be done by reducing the amount of elements on the screen due to them not fulfilling any specific purpose. Another way to keep the design simple is by reducing recurrences of elements.
3
Related Work
This chapter explains what others have done in this thesis problem area. To find these works the following phrases were used in the IEEE search engine [18]:
• "configuration system*" tools • Java program Restrictions • (fuel dispenser)
3.1 "Model-based design and analysis of permission-based security"
In [19] Jan, Markus, and Guido lays out how security can be visualized in UML, as well as how to implement these securities into a programming language such as Java. The implementation used is a permission-secured approach which forces the accessor to have all the corresponding permissions to access the object.
The paper has a clear problem domain which is security in programs, and specifically how unlawful access to objects can be prevented. This then leads into the problem the paper focuses on, how to create security in programs using permission-based security. To achieve this, the approach used embeds security permissions in UML models for model based analysis. Then it is shown how the models then can be inserted in languages such as Java.
The resulting implementation in Java uses GuardedObject to guard the objects with security permissions. GuardedObject encapsulates the object and a guard defines a set of permissions which must be met in order to access the object. But GuardedObject in its normal state is not good enough if the objective is to let several objects of the same class have different sets of permissions tied to them. To solve this certificates with permissions in them are implemented and each object needs to manage the certificate they receive for delegation. The permissions are checked by requesting the objects public key and the reference of the encapsulated object will be encrypted with the key. Then to use the reference the caller must decode it using the corresponding key. To counter GuardedObjects problem of either giving no or complete access to an object after the permission check, and the fact that the real reference cannot be returned for security reasons, wrappers are implemented which are the only things allowed to call the original object. The wrapper only contain methods to call that the caller has permission for. By extension this mean that there must a wrapper for every combination of method.
3.1.1 Comments
This paper was chosen as relevant to this thesis as it details how security aspects can be built up using UML and then implemented in languages such as Java. This is helpful for
3.2 "The Landscape Plant as Spatial Element Used in the Construction of Parametric Configuration System"
In [20] Li, Shaohui, Jialiang and Jianle has created a botanic configuration program which is to help with the choice of plants and shrubs as spatial elements for architects and interior designers.
This article focuses on how the configuration program and its database functions works. The problem is explained to be that plants, brushes, arbor and shrubs are sometimes wrongly chosen to be spatial elements. The wrong choice comes from architects and interior designers who have low knowledge of botany.
To solve the problem the group created a configuration program with a database. The configuration program lets the user search for appropriate botanics by different tags including flower colour, leaf colour, height and crown shape. These tags are then used to find all matching objects, these are then shown for the user, whom can then choose to read more about one by clicking on it. If only one result show up that one will be shown directly.
This configuration program lets the users of it choose a combination of plants, brushes, arbor and shrubs that not only fit each other aesteticly, but also so they can thrive and grow.
Figure 2: The configuration program
3.2.1 Comments
This article presents a configuration program and explains how it works. This is relevant to this thesis in the sense that it presents a way to make a configuration program as well as showing how it looks.
3.3 "Error Calculation System for Mexican Fuel Dispensers through a Mobile Application"
In [21] Oscar,Rubén and Aurora has created an application that compares the amount of fuel the car received with the amount displayed on the fuel dispenser. They mention that there are often inaccuracies in many Mexican fuel dispensers. For this reason they developed their application and system.
Their application exists of an mobile application and an embedded system. The em-bedded system will connect to the car through CAN Bus to gather information about the current fuel level in the car. Their mobile application speaks with the embedded system through Bluetooth.
They go on to test their solution on fuel dispensers with a combination of car brands and models. In the end they conclude that there can be made a comparison on the different values on the dispensers and their application.
3.3.1 Comments
This article explains the problem with fuel dispenser being configured in a bad way, and how it can affect people. The article ties in with this thesis since they both discuss configurations in fuel dispensers.
4
Method
4.1 Nunamakers and Chenss methodology
Nunamaker’s and Chen’s methodology [22] is a method for the development of software systems. This methodology was chosen due to its clear development process and its in-clusion of a prototype stage. This suits the development of the prototype. The method is based on five steps that leads into a verified system. The steps can be used iteratively which allows the development to go between different steps if needed. The five different steps can be seen in Figure 3, and how they are used is described in detail in the following sections.
4.1.1 Construct a conceptual framework
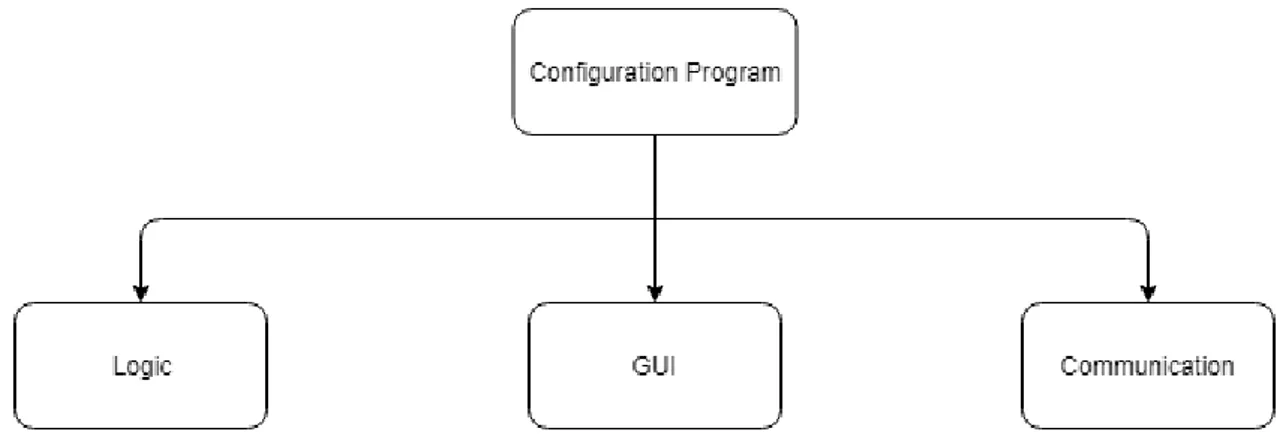
Finding out what problems needs to be solved in order to complete the task is a part of constructing a conceptual framework. To create the prototype, first an overview was made of the different problem parts, see Figure 4.
Figure 4: Simple overview of the problem
To solve these problems a literature study was conducted to gather knowledge and to find out how to solve them.
4.1.2 Develop a system architecture
The different parts of the prototype are shown in an architecual overview to detail the different steps. These parts are: the GUI, the logic, and the communication channel where the data entities are transferred between the prototype and the receiving board. How these different parts work together can be seen in Figure 6.
Rough and basic GUI designs were developed in section 5.2.1 to create an overview and knowledge of what elements needs to be present.
4.1.3 Analyze and design the system
To analyze and design the prototype, class diagrams and sequence diagrams were construc-ted. The class diagrams in section 5.3.1 were used to make it clear which class does what, and the sequence diagrams in section 5.3.2 details how certain aspects work. Test cases were developed to verify the prototype and see if it can handle its intended purpose. These test cases were made with the help of the system requirements in section 5.1.
To create the GUI that the prototype will use, feedback from DFS was needed. To achieve this, the system requirements in section 5.1 were used and a question form was constructed, see Appendix D. Along with the question form GUI designs were sent for inspection and evaluation. The form and the pictures were chosen as means to provide insight in how the GUI could look, but also to help the interviewees get a understanding of what they might want to see in the GUI.
4.1.4 Build the system
Small basic parts of the different modules were implemented together at an early stage after verifying their functionality. These could then be expanded upon and further developed simultaneously.
With the feedback from the question form, see Appendix E, the design of the GUI was updated and parts could be added or removed. The resulting prototype from the design can be seen in section 5.4.1.
4.1.5 Observe and evaluate the system
Testing was done by executing the test cases constructed in section 5.3.3. The first test used all the developed functions of the prototype, which includes: the logic, GUI, and communication. The prototype sends commands over the communication channel to the board, and it responds correctly. When the first test was completed the final test could begin, which was the prototype tested using a board with a pump connected to it at DFS. To evaluate the GUI of the prototype an interview with two engineers at DFS was held. The interview gave people with insight of the VR process the chance to give their feedback on the proposed GUI and they could give feedback on what functions they believed was missing, what could be improved and what they thought was good.
4.2 Workflow
When developing the GUI design the process ended up in three iterations: 1-Rough design, 2-Full design, and 3-Final design. The iterations are illustrated in Figure 5.
Iteration 1, Rough design, was the construction of rough GUI design sketches, as seen in Appendix A, which were used with the help of system requirements and GUI guidelines to evaluate what needed to be added to the designs.
Iteration 2, Full design, was built upon the first iteration and can be seen in Appendix B and Appendix C. From the evaluation new sketches were made and the design process started over. These design were then accompanied by a question form to help evaluate and choose what design should be expanded upon into the prototype.
Iteration 3, Final design, was the result of the first two iterations. From the question form and the feedback it garnered the process to create the Final design could be started. The Final design is the GUI that the prototype uses and can be seen in section 5.4.1. This was then evaluated along with the functionalities in the prototype.
5
Results
In chapter 5 and forward there are two concepts which will be used when discussing the prototype and its functions, these are: board, and board with pump. These two are both directed towards the embedded system used to control VR in fuel dispensers, see Figure 6. The difference between these two concepts however are in what scenario they are used. Board without pump, is used when the board itself is only connected to a computer running the prototype. Here tests are executed and much of the development process were done with just the board.
Board with pump, is used when the board is connected to a pump as well as a computer running the prototype. The pump also exist in fuel dispensers. This concept is used when the final testing is executed at DFS.
5.1 Construct a conceptual framework
The system requirements were presented by DFS during a meeting. The prototype will have two different modes, one for service technicians and one for engineers. This is because the service mode did not require the same functions as the engineer mode. A system will be used to prevent service technicians from accessing the engineer mode. The system requirements are divided into two different parts: one for service mode(Sx) and the other one for engineering mode(Ex).
S1 Show and set the K-factor
K-factor is a value between 0-50. S2 Set the calibration factor
It should be possible to select a calibration factor. The calibration factor is dependent on which calibration tool that is used.
S3 Start a calibration with a delay.
When starting a calibration the computer can not be connected to the board. There should be opportunity for the user to disconnect the computer from the board before the calibration takes place.
S4 Show the current calibrated data
The prototype should show the existing calibrated data in a table. S5 Show the new and old data after a calibration
After a calibration the user should be able to see the new data that exists on the board. It should be possible to compare the new and old data in the prototype. S6 Show commands in the graphical user interface.
When a command is sent to the board it responds, that response should be shown via the GUI.
possible to remove the connection and reconnect to the board at a given time. This is to comply with the ATEX directive [8].
S8 Show the calibration data in a graph
A user should be able to view the existing calibration data represented in a graph for both pumps.
S9 Change to engineer mode
It should be possible to change from the service mode to engineer mode. E1 Include the service mode.
All the functions that exists in the service mode should be implemented in this mode as well.
E2 The user should be able to use all existing debug functions
All debug functions on the board should be usable from the prototype E3 Show results in a graph, both live and with one set of data
There are two types of functions that need to be shown on a graph. One is the live where the data prints out on the graph until the user stops it. The other one is where the completed data set is collected from the board and then shown as a graph. E4 Restrict access to engineer mode
Because not all users should have access to the engineer mode there should be a system to prevent unauthorized users from entering it. This feature does not need to be advanced since it only needs to prevent someone from accidentally entering. E5 Change back to service mode
It should be possible to change back to service mode from engineer mode.
5.1.1 Litterature study
In the literature study the three papers in chapter 3 were found. These papers gave us insights in what needed to be added in the prototype to make it more secure. Furthermore during the literature study Microsoft Guidelines [14] were looked at. The guidelines are vast and contain a lot of information and details surrounding the different elements on a GUI. Therefore the different specifics regarding elements were further looked at in a case-by-case basis, this can be seen in section 5.4.4.
The selected framework for implementing the design in the program was JavaFX [23]. It was selected for its inclusion of graphs without the need for external libraries.
5.2 Develop a system architecture
Figure 6: System overview
The major parts in this system architecture are: logic, GUI, and communication. These were shown in Figure 4 as a basic overview. From the requirements in section 5.1 the logic and communication was expanded into separate views.
The Logic portion was broken down into: Handling GUI Input/Output, format incom-ing data, and Restrictincom-ing access.
Figure 7: Logic
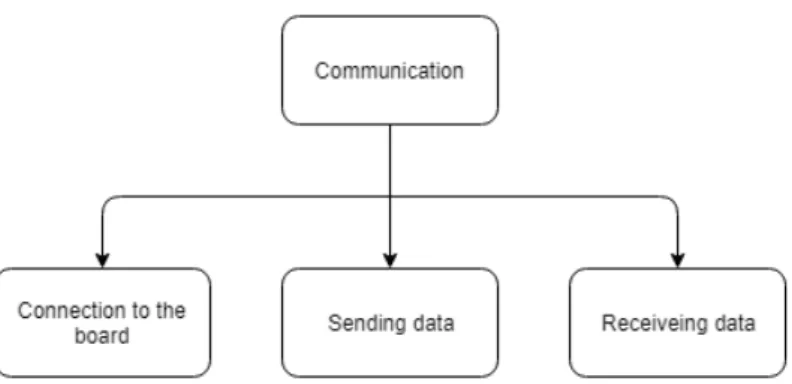
The communication was broken down into: connection to the board, sending data, and receiving data.
Figure 8: Communication
5.2.1 Basic GUI design
The two GUI sketches that were made as first rough drafts can be seen in Appendix A. The first one of them lists all the available commands in the board’s API. The second one has a basic layout design made with some of the commands bound to elements. From these sketches, with the help of the system requirements and from the board’s API documenta-tion provided by DFS, the development of the GUI could continue with insights of what needs to be changed, added and removed.
5.3 Analyze and design the system
This section describes the different UML diagrams constructed for the prototype, the basic GUI suggestions as well as the constructed test cases.
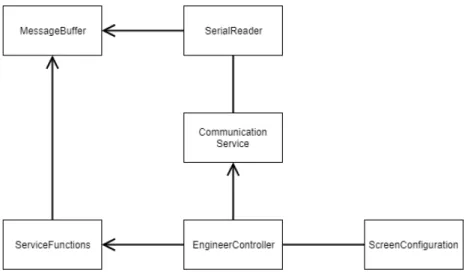
5.3.1 Class diagram
To give an overview of what different classes are present in the prototype a class diagram of each mode was constructed. The two major classes are Communication Service and Screen Configuration. Communication Service handles the communication between the prototype and the board. Screen Configuration is in charge of the different views of the GUI. Figure 9 and Figure 10 shows the two class diagrams. The two diagrams are similar due to code being reused and classes have been abstracted. The only difference between the figures are the controller classes.
Figure 9: Class diagram over the service mode
Figure 10: Class diagram over the engineering mode
5.3.2 Sequence diagram
The following two diagrams shows two important parts of the prototype and how they work. The first one describes the calibration process. The second one describes how the restriction of access to the engineer mode works.
Calibration process
To fulfil requirement S3, the computer may not be connected to the prototype during a calibration, a delay function was implemented. Figure 11 shows how the prototype will
Figure 11: Sequence diagram over a calibration
When the user presses the calibration button the prototype triggers a countdown on the board which then starts the calibration. At the same time the prototype stops the communication and shows a dialogue with a countdown instructing the user to disconnect the cable from the board and computer. When that countdown is complete the prototype starts another countdown which shows the measured time remaining for the calibration. Finally a message is shown telling the user that the calibration is soon completed, and the user can reconnect with the board.
When the prototype is reconnected with the board, the user is able to press on the calibration status button. Once pressed the prototype collects data from the board and displays it in a terminal.
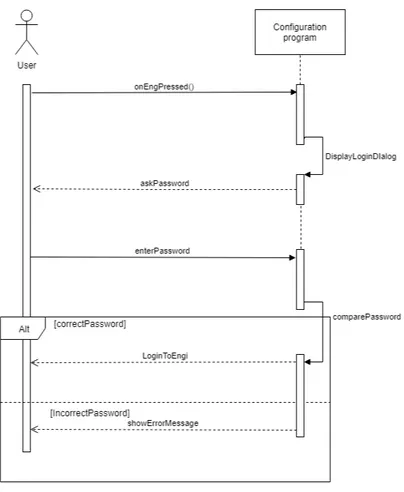
Change to engineer mode
Due to requirement E4 Figure 12 shows how it is possible to restrict access to the engineer mode. The restriction is needed to make sure that only authorized users can access the engineer mode. This is done because there are functions in the engineer mode that if not configured correctly can break the pump.
Figure 12: Sequence diagram over login
When the user tries to enter the engineer mode a dialog will appear on the screen. The dialog will tell the user to put in a password in order to access the engineer mode. The log in process is not secure since it uses a default password. The only reason the log in exists is to make sure no one accidentally enters the engineer mode.
5.3.3 Test cases
After analyzing the problem-tree and looking through the requirements of the prototype, two sets of test cases were constructed. The first set of test cases are high level test which helps verify the prototype to the requirements. The other set goes into more detail and is to verify all functions of the prototype. Table 1 shows all the functions that needs to work to fulfil the requirements in section 5.1.
Table 1: Test cases for requirements
5.3.4 GUI suggestions
The expanded GUI suggestions that shows more than just one view and that had all the different commands bound to elements can be seen in Appendix B and in Appendix C. Appendix B is a design made with the help of Microsoft guidelines, and Appendix C is made without the help of guidelines. The biggest difference in the two suggestions is that the design in Appendix B is minimalized in the amount of repetition of elements. This can be seen at the top where the user can choose a pump for all commands, as opposed to the design not following guidelines where the choice of pumps can be made on each individual command. Along with these design suggestions a question form was made, see Appendix D. Question 1 - 6 were meant to be answered before looking at the GUI suggestions. Question 7 - 10 were meant to be answered after looking at the GUI suggestions. The question form and the GUI suggestions were then sent to DFS for feedback.
5.4 Build the system
The construction of the prototype was made in different stages. At first the different parts in section 5.2 were developed to basic formats by themselves. When the basic functions were stable they were integrated to continue the building of the prototype.
From the feedback given by DFS in Appendix E the development of the final GUI could proceed. Regarding the general questions, that should be answered before looking at the GUI suggestions, it is obvious that DFS want the Service mode to be simple, understandable and easy for a first time service technician to use. All actions the user perform should give feedback so the user knows what happened. They also want present and past calibration data available in the GUI, and also a graph showing the data.
To restrict access to the engineer mode, as described in 5.1, the selected security meas-ure is a password. In the engineer mode the user should be able to take a closer look at the data that can be accessed, be that in graphs or tables.
Regarding the questions that point towards the GUI suggestions, DFS preferred the suggestion that did not follow guidelines over the one that did.
5.4.1 The final design
The prototype consist of two different main views, one for service mode and one for en-gineering mode. The service view is the more basic of the two. Figure 13 shows what the service mode looks like.
Service mode
Figure 13: The service view in service mode
There are 5 different main components in the GUI. Number 1, the input part, is where the user enters variables that are needed for parts of the commands to work. Number 2, the pump commands, are commands that can be called when the computer is connected to the board. Number 3 is the terminal and it shows the user what is happening and if there is something that needs to be done by the user. Number 4, the program commands, will let the user reconnect to the board again when in need. Finally there is number 5, tables
Engineer mode
In the engineer mode there are four main parts. Number 1 is the service view which can also be seen in Figure 13. This view lets an engineer use the same functions as in service mode. Number 2 is the tab row, here the engineer can switch between different sets of commands. Number 3 is the temperature of the board. Number 4 is the sign out button which allows the engineer to log out from the engineer mode.
In the Output tab seen in Figure 15, there are two different kinds of graph calls and a Terminal. The Terminal is there for printing raw values from the Static Graph. This is done so that the engineer can copy the values and use in different prototype. The Static Graph shows a graph in a new window with either data from one or two pumps. The Live Graph can only show one pump at a time due to limitations on the board. This graph shows continuous data that comes from the board until the user selects to stop it.
The Input Commands tab, seen in Figure 16, allows the user to send commands which changes how the pumps work. These commands are each displayed in a box and have different inputs. One example of a command is the Flow command which measures the average of four pulses from the pump and shows the data in its box. The Terminal shows the response from the board and also some data.
The final tab is the commands tab, Figure 17. The tab consists of two parts, one is a button list and the other one is the Terminal. The Terminal will display the response from the board and the buttons will send commands according to their names. Some of the commands have a warning which shows after they have been called, but before the prototype sends the command, see Figure 17. One of the commands that does this is the Halt command. The warning is there to prevent an accidental use of these commands.
5.4.2 Creating Graphs
One way to show incoming data from the board is by using graphs. These graphs are presented with number values on both axes and therefore the incoming data must be handled to be presentable.
The graphs that are shown by this prototype falls into one out of two categories, Static or Live. The Static graphs are the ones that when a command is sent to the board all the data is sent and transformed before the graph is created. This can be a sequence of 5, 10, 20 or more numbers, the amount does not change the behavior. An example of a Static graph can be seen in Figure 18 .
Figure 18: A Static graph
For the second category, the Live graphs, a different approach is taken. The prototype sends a command to the board to start the transfer of data, and at the same time an empty graph is created by the prototype. The stream of data that follows from the board is then added to the graph as nodes in their respective series. To stop the stream of data from the board, the user needs to press the Stop button.
The upside of using the Live graph is that some commands that the prototype can issue are the kinds that change the numbers in the data sent back for the Live graph. This means that to see what change in the system that certain commands do, the Live graph is there to easily illustrate it. Whether it is a change in how fast the fuel dispenser works, or how much current might be used, the Live graph can illustrate it.
5.4.3 Restricting access and locking the prototype
Figure 19: Temperature reading
Figure 20: Start of a calibration
Figure 21: Calibration wait
Figure 22: Calibration done To prevent users from clicking on elements when
they should not, or to prevent them from accessing areas they should not be able to, different actions have been taken. One of these actions is visible right at the start of the prototype. To access even the ba-sic mode, the service mode, the user must choose the COM-port which the board is connected to. This ensures that the user can not try to use commands or functions before making sure that the device is connected.
After choosing the COM-port the user is allowed to access the service mode. Here the user can for example start a calibration process, as seen in Fig-ure 11. The calibration process requires the user to disconnect the cable between the device and com-puter, this in turn locks the prototype so that no new action can be performed. To unlock the system the user must once again connect the cable and press Reconnect, as seen in Figure 13.
To access the engineer mode the user is not only required to be connected, but also they need to enter a password, as seen in Figure 12. In the engineering mode the user can use additional commands which the service mode do not have access to.
During the calibration process, the acquiring of temperature, and during the log in process, the pro-totype is disabled whereas the user can not click away from the process to start something else. This was done to prevent crashes in the communication. To achieve this JavaFX - Dialogs [24] were used. These are simple boxes that appear after a trigger event, such as a button press, that shows some text and have some input for the user to interact with.
As seen in Figures 19 - 21 the button is disabled, this is done to prevent the user from dismissing the dialog until an appropriate time. When the process is done the button is enabled again as can be seen in Figure 22.
5.4.4 Using guidelines to further the look and usability
The feedback given from DFS allowed the choice of base suggestion to be made. DFS decided that the suggestion without guidelines should be the base for further work. The guidelines were still taken into account on small simple things such as buttons, placement of elements etc.
Figure 23: Vertical button placement
Figure 24: Horizontal button placement
An example of this can be seen in the "Output" tab in engineer mode, Figure 15. Here the use of radio buttons and check boxes are decided with the help of guidelines. When only one option should be allowed, for example the Live graphs should only use one pump, the element used should be a radio button [25]. When several can be chosen, example being the Static graphs, the element selected should be a check box [26].
The layout of the elements are also influenced by guidelines. In figure 23 and 24 the same function is dis-played, but with one difference. The radio buttons are placed vertically in Figure 23, but horizontally in Figure 24. According to Microsoft guidelines Figure 23 is better to use, this is because placing options vertically makes them easier to read and localize.
5.5 Observe and evaluate the system
To verify the prototype and to evaluate the GUI, several tests and evaluations were made. To make sure the prototype fulfilled the requirements that were set, the test cases developed in section 5.3.3 were executed. To then also make sure that the prototype could work in a real scenario the tests were also done at DFS with a pump connected to the system. To evaluate the GUI an interview was held with two engineers from DFS.
5.5.1 Evaluation of the prototype
There were two different phases of testing that took place during the development of the prototype. The first phase of tests were done with the prototype and the board without pump. Having the board without pump connected to the prototype made it possible to verify that all commands worked as intended. The tests shown in Table 1 were completed and successful as seen in Table 2. The test ET2 was deemed successful after completing all tests seen in Appendix F.1 - F.4.
Table 2: Test cases with results
Finally there were the second phase of the testing. This phase used the same test cases as the first phase did, that is the tests shown in Table 1.These tests also passed and with them the system was verified to work both with a pump connected to the board, as well as without a pump connected.
5.5.2 Evaluation of the GUI
After all the tests passed in the two different test phases the GUI evaluation was done with the DFS engineers: A and B. The evaluation was split up into to major parts, the first one being the evaluation of the Service mode, and the second part being the evaluation of the Engineer Mode. This split was made since it shows the natural progression of how a user would experience the prototype, and some things stay the same between the two modes while some change. The presentation of the feedback is given piece by piece, meaning that the positive and negative of each element of the GUI is presented before going to another element.
Service Mode
The initial response regarding the prototype was from engineer A who thought it looked modern and nice looking. Going to specific elements of the Service Mode, engineer A gave the feedback that the table showing configuration data could be a point of irritation for users of the prototype. This since the table does not show all the data in it without needing to scroll. To fix this he suggested that a bigger window for the prototype might be a good idea, or just make the whole window fullscreen right away. Another way to make the tables fit could be to make the buttons on the other side of the window smaller, more compact. He did however think that the data in the table was central and easy to read.
After giving feedback about the table in the Service Mode the focus was shifted to-wards the upper-left part of the prototype where the K-factor and Calibration factor is located. Here engineer A mentioned that just having K-factor and Calibration factor was not informative and intuitive enough. He and his colleague, engineer B, understood what it was, but a Service technician might not. So he suggested that there could be added information box that hoover once the user put their mouse pointer over the text. This box could detail what the two different factors are and between what values they can be set.
Engineer B agreed with engineer A’s comments but also added that the buttons un-derneath K-factor and Calibration factor were not placed well. Since the buttons are now all lined up under each other, and not next to their respective input options, that being K-factor and Calibration factor, this can create confusion and make the user click the wrong command button. To remedy this engineer B suggested moving the corresponding buttons to their input so that they are condensed to each mini group. To make it even clearer engineer B suggested that the input for New K-factor should be located right next to the Set K-factor button, and that the Current K-factor should be right next to the Get K-factor button.
Engineer Mode
The Engineer Mode is split up into four different tabs where different things are visible on the different tabs. The tabs are: Service, Output, Input Commands, and Commands, the Service tab got the same feedback as the Service Mode did since they are the same.
Output Tab
Figure 25: Hard to read graph In the Output tab the feedback was directed at the
graphs. They thought that the graphs were hard to read since the difference in the numerical values were big. An example of this can be seen in Figure 25.
Both engineer A and engineer B liked how the Live graphs operated, but they suggested that a slider could be added so that the data points would not get to close to each other, therefore making the graph harder to read. Setting a cap of around 50-100 points to be seen at once while having the ability to scroll back and forward would allow the engineers to read the data and see changes. They suggested that a cap in total number of data points in the graph at once to be added. This could be a much higher num-ber than the cap of total points shown, somewhere upwards of 1000 points. This would be needed to
make sure that when you scroll you do not go back 2 years of data when scrolling a little bit.
The last feedback about the Output tab was regarding the placement of the Clear Terminal button. It was suggested that it could be moved underneath the terminal window, so that it would make more sense than having it off to the side.
Input Commands Tab
For the Input Commands tab ,engineer B suggested that the SetP box should be placed in the upper left corner and thus changing place with the PI box. This is because SetP is one of the more important commands in the Input Commands tab. Along with this he thought the SetP box could get a thicker border to mark that it is important. The names for some of the commands was suggested to be changed, the current ones are not descriptive enough and thus not intuitive. The names chosen for the boxes as can be seen in Figure 16 are the name of the commands in the API and therefor not always the most suitable.
6
Analysis and Discussion
6.1 Analysis of Results
Chapter 5 presents the results of our project. Some of these we would like to discuss briefly.
6.1.1 Why we choose Microsoft Guidelines
The choice of GUI guidelines were based on the principle that the prototype should run on a Windows OS, therefore we decided to use Microsoft’s own Guidelines. In section 5.4.4 we presented how the guidelines could be used on different elements and that the design chosen by DFS was the design not based on guidelines. We decided that even with DFS’s choice of design there could be parts of the guidelines implemented into the design. The decision was made to implement elements of it that would not impact in a big way, but contribute to a more intuitive and better looking GUI.
6.1.2 Choosing the security level
For the prototype developed in this thesis security was added in the form of a password and input checks. The password protection in our prototype, as mentioned in section 5.4, is there so nobody accidentally enters the engineer mode. The password itself is stored inside the prototype without encryption. To check if the entered password is correct a simple comparison is done. There is no limit on the amount of tries a user have to enter the correct password. Therefore the prototype could be cracked if enough time was put in. The input checks were implemented so that no commands are sent to the board if they contain errors. Every time a commands is requested to be sent, it is first checked that all the inputs are correct as to not cause problems in the board. This is done on the prototype side to make sure nothing goes wrong in the board due to its placement at filling stations. The security focus was formed to protect the prototype and the board by making sure the user can not do wrong inputs. By helping the user with visual elements, such as disabling buttons that can not be used, the risk of something going wrong due to the user is minimized.
Since DFS only wanted to block access to some functions we believe that our security implementation is satisfactory for the prototype.
6.1.3 Meeting the requirements
In section 5.1 we showed the requirements for the system. Based on these requirements we could make the test cases in section 5.3.3. This is done such that if the test cases pass, then the prototype satisfies the requirements.
To verify the prototype testing was done in two different phases as mentioned in section 5.5.1. There were two phases of testing conducted on the prototype. The first phase was with the board without pump. The second phase was with the board and a pump connected. The most important test was live testing with the pump, because it showed how the prototype preforms in a real scenario. As seen in Table 2 the prototype passes all the test and therefore it satisfies the requirements.
6.1.4 Regarding Feedback
From the feedback given by the two DFS engineers in section 5.5.2 we discovered what parts of the prototype could receive improvements, and also what features might be good to have in future versions. The feedback was needed for two major reasons, the first was for us to learn, and the second was to help DFS with figuring out what they want in their VR configuration program. With the feedback known to both parties, DFS can choose to further develop the prototype towards a finished program.
6.2 Method discussion
We believe that Nunamaker and Chen’s methodology [22] has helped us with the develop-ment of the prototype. The inclusion of a prototype stage has allowed us to properly test the prototype with the board without pump to make sure that everything works before going forward and testing it with a pump connected. The iterative process that is made possible has also been a huge factor in the development stage of the prototype. Going from designing and starting to build and test the first prototype and having it fail let us go back and analyze the system again. When going back we could find flaws in the prototype and fix them to get a better prototype developed in the end. This iterative process is explained in 4.2.
6.3 Complying with the ATEX-directive
With the limitation of the ATEX-directive, as mentioned in section 1.5, we had to design the prototype to be able to complete calibrations on the board while not connected. Our solution for this, as presented in section 5.3.2, starts countdowns on both the board and the prototype. This gives the user ample time to disconnect the cable, thus complying with the ATEX-directive.
6.4 Comparison with related works
The security options presented in [19] encompass large parts of programs and shows how security can be implemented through UML. With the use of different techniques they create a permission based security system which works well. In our prototype the need for security was only to hinder technicians from accidentally enter the engineer mode. Therefore we think that our security system performs adequately.
The configuration program in [20] is not applicable to our developed configuration prototype. They are both used in different areas and for different purposes. However we do feel the GUI of [20] helped when developing our GUI and the suggestions for it. Their use of large text areas was an inspiration for us when designing the GUI.
The application presented in [21] shows that configuration is important to make sure that fuel dispenser output correct amounts of fuel. The prototype presented in our thesis does not configure the flow of fuel in fuel dispenser, but it configures the Vapour Recovery of a fuel dispenser. These two configurations are different, but they are both needed to make sure that fuel dispensers work correctly and according to regulations.
7
Conclusions and Further Work
7.1 Answering Research Questions
In this thesis we introduced the following research questions.
RQ1 How can GUI standards be used in a digital configuration program for fuel dis-pensers?
RQ2 How complete does a prototype need to be for the customer to be able to give feedback on the GUI, sufficient for creating a first version of a product?
The GUI sketches in Appendix B shows guidelines in use, however these designs were not developed into the final design. The final design was based on Appendix C and guideline implementations as seen in 5.4.4. The final design can be seen in 5.4.1 and our reasoning for choosing guidelines is explained in 6.1.1. Therefore we answer RQ1.
To answer RQ2 we have to look at where this prototype was finished enough the get sufficient feedback. In our case with this prototype it was finished enough somewhere between iteration 2 and iteration 3. The feedback from the different iterations can be seen in Appendix E and section 5.5.2.
7.2 Contributions
This thesis contributes with a working prototype of a Vapour Recovery configuration pro-gram for fuel dispensers. We also showcase how parts of Microsoft guidelines can be implemented in such a prototype and in what stage of development this prototype needed to be in to garner adequate feedback that can be used to make a finished product.
7.3 Future Work
This thesis used Microsoft Guidelines for design suggestions during iteration 1 and 2, then abandoned the guidelines driven suggestions after DFS chose the suggestion without guidelines. For future work an investigation can be done as to why the guidelines were disregarded.
References
[1] United States Department of Transportation. National Household Travel Survey Daily Travel Quick Facts. url: https://www.rita.dot.gov/bts/sites/rita. dot . gov . bts / files / subject _ areas / national _ household _ travel _ survey / daily_travel.html. (accessed: 13.03.2018).
[2] U.S. Energy Information Administration. Use of Energy in the United States Ex-plained. url: https : / / www . eia . gov / energyexplained / ?page = us _ energy _ transportation. (accessed: 13.03.2018).
[3] U.S. Energy Information Administration. Frequently Asked Questions. url: https: //www.eia.gov/tools/faqs/faq.php?id=23&t=10. (accessed: 13.03.2018).
[4] European Parliment and the Council. DIRECTIVE 2009/126/EC OF THE EUROPEAN PARLIAMENT AND OF THE COUNCIL of 21 October 2009 on Stage II petrol va-pour recovery during refuelling of motor vehicles at service stations. url: http : / / eur - lex . europa . eu / legal - content / EN / TXT / ?uri = CELEX : 32009L0126. (ac-cessed: 13.03.2018).
[5] Dover Fueling Solutions. Dover Fueling Solutions Homepage. url: https://www. doverfuelingsolutions.com/. accessed on: 21.05.2018.
[6] Wayne Fueling System. Wayne Fueling System About. url: https://www.wayne. com/en/about/. accessed on: 11.05.2018.
[7] Bürket. Bürket homepage. url: https://www.burkert.se/sv. accessed on: 07.05.2018. [8] RISE Research Institutes of Sweden. Explosionskydd. url: https://www.sp.se/sv/
index/services/ex/sidor/default.aspx. accessed on: 01.05.2018.
[9] Siemens. Control of Vapor Recovery Units (VRU) MAXUM edition II Process Gas Chromatograph and Continuous Gas Analyzers (CGA) monitor VRUs. url: https: / / w3 . siemens . com / mcms / sensor - systems / CaseStudies / Control _ of _ Vapor _ Recovery_Units_en.pdf. accessed: 13.03.2018.
[10] European Parliment and the Council. European Parliament and Council Directive 94/63/EC of 20 December 1994 on the control of volatile organic compound (VOC) emissions resulting from the storage of petrol and its distribution from terminals to service stations. url: http://eur-lex.europa.eu/legal-content/EN/TXT/?uri= CELEX:31994L0063. (accessed: 13.03.2018).
[11] Fizzed. RXTX for java. url: http://fizzed.com/oss/rxtx-for-java. (accessed: 28.03.2018).
[12] Apple. Human Interface Guidelines. url: https://developer.apple.com/ios/ human - interface - guidelines / visual - design / adaptivity - and - layout/. (ac-cessed: 13.03.2018).
[13] Google. Material design. url: https://developer.android.com/design/index. html. (accessed: 13.03.2018).
[15] Oracle. Java Look and Feel Design Guidelines. url: http : / / www . oracle . com / technetwork/java/index-136139.html#close. (accessed: 13.03.2018).
[16] S B. Motif Style Guide. url: http://www.s- and- b.ru/syshlp/motif_guide/ MotifStyleGuide/TOC.html. (accessed: 13.03.2018).
[17] Microsoft. How to design a great user experience for desktop applications. url: https: //msdn.microsoft.com/library/windows/desktop/dn742462.aspx. (accessed: 02-05-2018).
[18] IEEE. IEEE Xplore Digital Library. url: https://ieeexplore.ieee.org/Xplore/ home.jsp. accessed on: 11.05.2018.
[19] J.Jurjens M.Lehrhuber G. Wimmel. “Model-based design and analysis of permission-based security”. In: 10th IEEE International Conference on Engineering of Complex Computer Systems 1 (2005), pp. 224–233. doi: 10.1109/ICECCS.2005.61.
[20] Y.Seongjun P.Minseok C.Hongjin. “User-friendly support environment for require-ment analysis in user interface design”. In: Parallel Processing, 1999. Proceedings. 1999 International Workshops on 1 (1999), pp. 414–417. doi: 10.1109/ICPPW.1999. 800094.
[21] Aurora Aparicio Castillo Oscar Carranza Castillo Rubén Galicia Mejía. “Error calcu-lation system for mexican fuel dispensers through a mobile application”. In: (2017). doi: 10.1109/CONCAPAN.2017.8278528.
[22] J.F.Nunamaker M.Chen. “Systems development in information systems research”. In: Proceedings of the Twenty-Third Annual Hawaii International Conference on System sciences 3 (1990), pp. 621–640. doi: 10.1109/HICSS.1990.205401.
[23] Oracle. JavaFX. url: https://docs.oracle.com/javafx/2/overview/jfxpub-overview.htm. accessed on: 28.05.2018.
[24] Oracle. class Dialog<R>. url: https://docs.oracle.com/javase/8/javafx/api/ javafx/scene/control/Dialog.html. accessed on: 02.05.2018.
[25] Microsoft. Radio Buttons. url: https://msdn.microsoft.com/en- us/library/ windows/desktop/dn742436(v=vs.85).aspx. accessed on: 10.04.2018.
[26] Microsoft. Check Boxes. url: https : / / msdn . microsoft . com / en - us / library / windows/desktop/dn742401(v=vs.85).aspx. accessed on: 10.04.2018.
Appendices
Appendix A
Appendix B
Appendix C
Appendix D
Questions to answer before looking at designs
1 How do you think the Service mode should look like? 2 How do you think the Engineer mode should look like?
3 Do you have any special demands on what the program should look like? 4 Are there any preferences on what colours should be used in the program? 5 Should there be any pictures or texts that indicates the company?
6 Show one or two pumps be displayed at the same time? Different layouts on the different modes?
Questions to answer after looking at designs
7 What do you think about the different suggestions, each by themself ? 8 Do you see any benefit in one of the designs over the other
9 Are there any functions missing from the designs? 10 Do you think anything is missing visually?
Appendix E
(Answers to the question form, first the original in Swedish then followed by an English translation)
Questions to answer before looking at designs
1 How do you think the Service mode should look like?
Service nivån ska vara enkel för en oerfaren att använda. Det ska gå att sätta K-faktor och starta en kallibrering och man ska förstå vad som händer. Tydliga knappar och någon form av text fönster kanske som visar output till användaren. Det är även bra om man kan se nuvarande och förra kallibrering på ett enkelt sätt och dessutom få upp en graf på kallibreringarna.
The service level should be simple for an inexperienced user. It should be possible to set a K-factor and start a calibration, and you should understand what it is. The buttons should be clear and some kind of text windows that can display the output to the user. It is also good if you can see current and previous calibrations in a simple way and also get a graph on the calibrations.
2 How do you think the Engineer mode should look like?
Enginnering nivån ska nås genoom en inloggning, behöver inte vara någon form av säkerhet I sig, bara att man inte ska kunna göra ändringar där av misstag. I den nivån ska det vara möjligt att titta närmare på de utdata som finns i form av grafer och tabeller beroende på vad som ses som lämpligt
The engineering mode should be achieved through a login, there does not need to be any security in the login, just so that the user do not accidentally enter. In the engineer mode, it should be possible to look at data in the form of graphs and tables depending on what is considered appropriate.
3 Do you have any special demands on what the program should look like?
Det är bra om programmet fungerar även på mindre skärmar, antingen skalbart eller att själva fönstret är ganska litet.
It’s good if the program works even on smaller screens, either scalable or that the window itself is quite small.
4 Are there any preferences on what colours should be used in the program? Det ska följa Dover fueling solutions färgschema.
It should follow Dover fueling solutions colour scheme.
5 Should there be any pictures or texts that indicates the company?
Gärna Dover fueling solutions logotype någonstans, kanske även i ikonen som man startar programmet.
Feel free to use the Dover fueling solutions logo somewhere, maybe in the icon used to start the program.
6 Show one or two pumps be displayed at the same time?
Vissa av kommandona till styrkortet går att använda när två pumpar kör samtidigt, i de fallen är det lämpligt att programmet kan hantera detta.
Some of the commands can be used when two pumps run simultaneously, in which case it is appropriate that the program can handle this.
Different layouts on the different modes?
Pumparna ska helst inte få lov att köra samtidigt som man är inne i service nivån och är kopplad till kortet
The pumps should preferably not be allowed to run while in service mode and are connected to the card
Questions to answer after looking at designs
7 What do you think about the different suggestions, each by themself ?
Båda förslagen verkar vettiga, de är relativt lika varandra. Service interfacet i det egna förslaget ger användaren mycket information vilket kan vara bra. Service inter-facet för ”gudielines” är enkelt i sitt utförande men kanske utelämnar lite för mycket information för användaren.
Both proposals seem sensible, they are relatively similar to each other. The service interface in your own proposal gives the user a lot of information which may be good. The service interface for "guidelines" is easy in its execution, but might leave out a little too much information for the user.
8 Do you see any benefit in one of the designs over the other
Tycker det är bra att man kan välja vilken pump man vill använda bredvid varje kommando istället för en gemensam i toppen. Service interfacet i det egna förslaget med större fönster, tabell med mera skulle jag föredra.
It’s good that you can choose which pump you want to use next to each command instead of a single at the top. I would prefer the service interface in your own proposal with larger windows, table and more.
9 Are there any functions missing from the designs? – 10 Do you think anything is missing visually?
Bra om man kan se alla komando utan att ha en ”rullist” Good if you can see all commands without having a "scrollist"

![Figure 3: The steps according to Nunamakers methodology [22]](https://thumb-eu.123doks.com/thumbv2/5dokorg/4033813.82600/17.892.305.570.440.1019/figure-steps-according-nunamakers-methodology.webp)