VTIsärtryck
175
Changes in Driver Behaviour as a Function of
Handsfree Mobile Telephones
A Simulator Study
Håkan Alm, Lena Nilsson
Reprint from Drive Project V 1017 (Bertie), October 1990
1991
?, Väg-ODI) Tra k- Statens väg- och trafi'ki'nstitut (VT/I . 581 01 Linköping
ISSN 0347-6049
VTIsärtryck
175
1991
Changes in Driver Behaviour as a Function of
Handsfree Mobile Telephones
A Simulator Study
Håkan Alm, Lena Nilsson
Reprint from Drive Project V 1017 (Bertie), October 1990
?, Väg'OCh Efik" Statens väg- och trafikinstitut ( VTI) ' 581 01 Linköping [113t,tUtet Swedish Road and Traffic Research Institute ' 8-581 0 1 Linköping Sweden
PREFACE
The study reported here was performed within the DRIVE Project
V1017 'Changes in Driver Behaviour due to the Introduction of
RTI Systems' (or BERTIE for short). The BERTIE project has
brought together five research teams with a multi-disciplinary
range of skills to address the problem of analysing the impact
of new RTI applications upon driver behaviour.
The five teams are:
HUSAT HUSAT Research Centre, Loughborough, England
VTI Swedish Road and Traffic Research Institute,
Linköping, Sweden
TUB Technische Universität, Berlin, Germany
BMW Bayerische Motoren Werke AG, Munchen, Germany
AFT Association pour le développement de la Formation
professionelle dans les Transports, Monchy Saint Eloi,
France
The BERTIE project has concentrated on behaviour at the
micro-level. The aim has been to refine methods of data collection in
a variety of test environments, and to present a picture of
behaviour change as a function of certain applications. The
findings will be of use to future RTI designers and legislators.
It is also hoped that the results obtained by this research
group will provide valuable information to other projects within
as well as outside the DRIVE programme, and also clarify
thinking towards the needs for future investigation in the
DRIVE Project V1017 (BERTIE)
Changes in Driver Behaviour Due to the Introduction ofRTI Systems
Report No. 47
Changes in Driver Behaviour as a
Function of Handsfree Mobile
Telephones: A Simulator Study
H Alm & L Nilsson
Swedish Road and Traffic Research Institute (VTI)
October 1990
än
.,
uusn
-
. _a .___- IVWm. I
lm! Bayerische MotorenQ
ABSTRACT
Changes in driver behaviour as a function of handsfree mobile
phones: a simulator study. By Håkan Alm and Lena Nilsson,
Swedish Road and Traffic Research Institute (VTI), Sweden.
The effects of a mobile telephone conversation on drivers
reaction time, lane position, speed level, and workload in two
driving conditions (easy versus hard driving task) were studied
in an advanced driving simulator. 40 subjects, experienced
drivers in the ages 23 to 61 years, were randomly assigned to
four experimental conditions. It was found that a mobile
telephone conversation had a negative effect on drivers reaction
time, when the driving task was easy. It led to a reduction of
speed, when the driving task was easy. It had a negative effect
on drivers' lane position, most pronounced when the tracking
component of the driving task was hard. Finally, it led to an
increase in workload for both the easy and hard driving task.
The effects were discussed in terms of what subtask, car driving
or telephone conversation, the drivers gave the highest
priority. Some implications for information systems in future
BACKGROUND
The number of mobile telephone users is steadily increasing in
many European countries. This increase has made researchers and
authorities worry about the effects of mobile telephone use on traffic safety. A driver using a telephone while driving may be
tempted to have the eyes directed at something else but the
traffic situation, or to have the eyes directed at the traffic
situation but be mentally absent from it. In the worst case this
may cause (directly or indirectly) an accident.
Some earlier studies have raised the question about the effects
of mobile telephones on traffic safety. In an early study Brown,
Simmonds, and Tickner (1969) investigated the effects of divided
attention resulting from the use of mobile telephones. They
found that when drivers were engaged in a conversation using a
headset, thus using something functionally similar to a
"hands-free" telephone, they were driving slower, and made more judg
mental mistakes compared to a situation where they were not engaged in a conversation. A conclusion fram the Brown et al. study was that overlearned tasks of car driving were not
affect-ed by the use of a mobile telephone, but that some perceptual
and decision-making tasks were negatively affected. Zwahlen,
Adams, and Schwartz (1988) investigated lateral path deviations
when drivers were dialing a long distance telephone number. They found that 2-12 per cent of the drivers made lateral deviations of a dangerous nature.
In a study performed by California Highway Patrol (1987) both
negative and positive results were found. As in the study per
formed by Zwahlen et al. (1988) it was found that dialing a
telephone number had a negative effect on drivers' lane
posi-tion. That effect was found to be more severe than when drivers
were tuning the car radio. They concluded that when the
tele-phone was mounted on the dashboard the probability for an
acci-dent was lower compared to when it was mounted on the console.
On the positive side it was found that mobile telephones were
probably led to the saving of human lives. Stein, Parseghian, and Allen (1987) used a driving simulator to study the effects
of mobile telephone use on drivers traffic safety related
per-formance. It was found that the drivers lane position was
severely affected when a telephone call was initiated manually.
This effect was especially pronounced when the telephone was
mounted on the console, and not so severe when it was mounted on
the dashboard. The effect was also more pronounced for old than
for young drivers. The probability of striking an obstacle was
increased if the telephone was mounted on the console, and if
the driver was middle-aged or older.
In a recent questionnaire study, Alm and Nilsson (1989), found that many mobile telephone users had the telephone mounted in an
"incorrect" way (for instance on the console) and that not all
users had the "short number facility". Of those who had the
facility, few reported that they actually used it. In line with
the California Highway Patrol study it was found that mobile
telephones were used to report accidents and to help and warn
other drivers.
The purpose of the following study was to continue the line of
research initiated in the above mentioned studies, and to
in-troduce some variables of interest. Earlier studies have not
included variations in driving task complexity. On theoretical
grounds it seems reasonable to assume that a mobile telephone
conversation will have different effects upon driver behaviour
if the driving task is easy or complex. When driving a car a
driver must perform some information processing tasks. A driver
must, for instance, be able to: a) detect objects in the traffic
scene, b) identify objects, c) make judgments of attributes of
different objects (speed, direction, intention), d) make
judg-ments of suitable actions to perform in response to other road
users and other relevant objects or events, e) make judgments of
own ability to perform suitable actions, f) implement Planned
actions into actual behaviour, g) evaluate the effects of
driver must also constantly monitor the performance of his/her vehicle, and correct deviations from intended level.
These subtasks can be more or less demanding, depending for
in-stance upon the number of objects in a driving task, their
predictability, and so on. The more demanding these subtasks
are, the less capacity will be left for a secondary task. Thus
it seems reasonable to assume that the nature of the driving
task will influence the effects a secondary task will have upon driver behaviour. It was also of interest to introduce subject-ive measures concerning the effects of a mobile telephone
con-versation, since earlier studies mainly have focused upon more
objective" measures.
Problem
The purposes of the study were to address the following
ques-tions. First, is there an effect of a mobile telephone
conver-sation on drivers' ability to quickly detect an object in a
traffic environment? Second, is there an effect of a mobile
telephone conversation on drivers ability to monitor and adjust
the performance of the vehicle? Third, is there an effect of a
mobile telephone conversation on drivers workload. Fourth, is
there an effect of the difficulty of the driving task on
drivers ability to perform telephone conversations?
Hypotheses
To make predictions about the effects of mobile telephone calls
on drivers ability to quickly detect an object, it is necessary
to analyze the components of a mobile telephone conversation. To
make the analysis simpler we will restrict it to the situation
where a driver receives a telephone call, and uses the handsfree
function of the telephone. The driver must: a) activate the
handsfree function by performing some manual action, b) divide
his or her attention between the contents of the telephone call
and the task of car driving. In both of these situations the
absent from the road scene. In both cases it seems likely that the driver s ability to quickly detect an unexpected object will be negatively affected. On the other hand both of these effects may be compensated for. It is sometimes possible for a driver to
increase the level of attention to the driving task when the mobile telephone is ringing. It is also possible for a driver to
decrease the demands of the driving task by, for instance,
reducing the speed, or stopping at the road side. We must also
take into account that learning effects will occur. Still it
seems reasonable to predict a delay in reaction time when
something unexpected occurs in connection to the activation of
the handsfree function, and in connection with the driver s
concentration on the content of the telephone call. These
effects are predicted to be stronger when the demands of the
driving task increase.
The second question had to do with the effects of mobile
tele-phone calls on drivers ability to monitor and adjust the
per-formance of the vehicle. It is predicted that there will be such
an effect, and that this will be manifested in drivers ability
to keep a consistent lateral position. The effect is predicted
to be stronger when the tracking demands of the driving task
increase.
The third question had to do with the effects of mobile
tele-phone calls on drivers workload. It is predicted that workload
will increase due to the telephone call, and that the addition
in workload will be higher in proportion to the complexity of
the driving task. The increase in workload is predicted to lead
to a reduction of speed.
Finally, the fourth question had to do with the effects of driv
ing task complexity on the subjects ability to perform a
tele-phone conversation. It is predicted that increased complexity of
the driving task will have a negative impact on the subjects
METHOD Subjects
Forty subjects, 20 men and 20 women, aged 23 to 61 years (mean
age 32.4, std. 9.5 years) participated in the study. They all
had a driving license, and were experienced drivers meaning that
they had had their driving license for at least 5 years, agg
that they were driving at least 10.000 km per year. The subjects were recruited via advertisements at various public places, like
the university and the hospital in Linköping. They were paid
(250 SEK) for their participation in the experiment. The
subjects were randomly assigned to four experimental conditions.
Apparatus
The VTI driving simulator was used for the study. It is an
advanced simulator which consists of a moving base system, a
wide angle visual system, a vibration-generating system, a sound
system, and a temperature-regulating system (Nordmark, Jansson,
Lidström, Palmkvist, 1986, 1988, Nilsson, 1989). These five
sub-systems can be controlled to operate in a way that gives the
driver an impression which is very much alike real driving.
The time delay introduced by the simulator is approximately 40
ms, divided into 20 ms computer cycling time, and 20 ms delay in each of the parallelly working moving base and visual systems.
With this fairly fast dynamic response the VTI simulator
ful-fills the crucial requirement that simulator time lags must be
short compared to lags of an ordinary vehicle (100 250 ms).
Moving base system. The moving base system has three main
degrees of freedom. Thus it can simulate accelerations in
different directions through rotations (roll, pitch) and linear
motion (lateral) of the cabin. Lateral inertia forces are
simu-lated by combinations of linear motion and roll according to a control strategy, while longitudinal accelerations are simulated
simply by tilting the cabin a certain pitch angle. Pitch and
The linear motion of a wagon, on which the cabin is mounted,
takes place along rails. The wagon is chain-driven from another
hydraulic motor.
Visual system. In the visual system an image is generated in
real time in a specially designed and fast image processor, con-trolled from a main computer. The image is transformed to stan-dard video signals, which are updated every 20 ms. The video
pictures are (via three TV-projectors) presented to the driver
as a continuously varying scenery on a screen. The screen is
mounted 2.5 m in front of the driver, a distance corresponding
to a 120° field of vision. In the visual system a realistic road
surface can be generated, simulating a variety of road
condi-tions. Also, the horizontal and vertical curvature can be varied
continuously, with a maximum. road sight distance of 3.000 m.
Different kinds of road details (lines, wheel tracks,
macro-texture) as well as road types (asphalt highway, narrow gravel
road) can be simulated. Sight conditions can also be varied
(clear day, fog, darkness).
Vibration system. For the vibration system, producing road
vibrations, the cabin itself is mounted on three hydraulic
actuators. Any vibration spectrum can be generated as long as it falls within the capabilities of the actuators.
Sound system. The sound system provides the driver with
information that is important for, for instance, speed control.
The system consists of six sound channels. For noise generation
two treble speakers are placed on the dashboard in front of the
driver, and two bassmidrange speakers are placed on the wheel
housings. Besides, two pairs of large loud-speakers are placed
behind the driver in the cabin, and allow generation of
high-level (>112 dB(G1)) low-frequency sound (infrasound). The noise
pattern generated usually consists of sound spectra recorded
during real driving, which has been sampled and stored in
digital form. It is, also, possible to create any desired sound
spectrum.
Temperature system. The temperature system consists of a
closed system, where temperature-controlled water is circulated. In a computer-controlled feedback loop the air temperature in the cabin is recorded and fed back to a control unit, which sets
the water temperature to an appropriate value. The cabin tempe
rature can be set to any value from 18°C to 32°C with an
accu-racy of iO.5°C. Driving tasks
The road type that was presented to the subjects in the
simu-lator was a two-lane, seven meter wide asphalt road. It
con-tained both horizontal and vertical curves. The road surface was
characterized by high friction corresponding to dry summer
roads, and the visibility condition was similar to a cloudy
summer day.
Three different routes, one practice route and two test routes
were used in the experiment. All three routes had the same
general characteristics as described above, but differed in length and in the number and radius of the curves. The practice
route was 20 km long, rather straight and easy to drive. It was
used to make the subjects familiar with simulator driving, in
order to avoid learning effects during the real experiment. The
two test routes were both 80 km long. The easy one was rather
straight, and was not expected to cause the subjects any
problems with the choice of speed and steering strategy. The
workload imposed upon the driver was thus supposed to be very low. The hard route was very curvy, which forced the subjects to monitor the road continuously and make decisions about a
suit-able speedlevel and steering strategy. These requirements were
supposed to impose a high level of workload upon the driver.
Vehicle. The car body used in the experiment was an ordinary
Volvo 740 with an automatic gearbox. The simulated physical
environment in the "car" corresponded to that in modern
passen-ger cars. Thus, the noise level, the infrasound level, and the
vibration level were all within the respective intervals for
modern passenger cars during driving in real traffic. The ther-mal environment was according to norther-mal indoor climate.
Visual stimulus. A red square, with the size four by four cm,
was used as a visual stimulus. It always appeared in the same
position on the left shoulder of the road at a rather long
dist-ance in front of the "car". As the position was fixed relative
to the road, the sight angle perceived from the driver's posi-tion varied a little according to the road curvature.
Mobile telephone. The mobile telephone used was an Ericsson
Hot Line device with handsfree facility (Ericsson Radio Systems
AB, Sweden). It was mounted at the height of the steering wheel, over the ventilation controls, on the instrument panel to the
right of the steering wheel. The telephone communication was
simulated with the help of a micro controller and two tape
recorders with remote controls.
Via the serial channel of the telephone system, the micro
con-troller activated the telephone, generated the ring signal, and detected when a button was pressed on the telephone. The micro
controller communicated with the main simulator computer, which
controlled where, along the routes, the telephone calls
occurred.
When a subject answered the telephone by pressing a button, one
of the tape recorders was activated and "read" the telephone
task to the subject. Tasks for eight telephone calls were
con-secutively prerecorded on one of the tape recorder channels. On the other channel a signal with constant frequency and amplitude was recorded. This signal had the same duration as the presented
telephone calls and was used by the micro controller to start
and stop the tape at correct positions.
The presented telephone tasks were, together with the subjects answers recorded on the second tape recorder.
Telephone task. The Working Memory Span Test (Baddeley,
Logie, Nimmo-Smith and Brerefon, 1985) was chosen for the
telephone (communication) task. This test contains a working
memory part and a decision part. The subjects in the
experimental groups were exposed to a number of sentences. Each
sentence had the form "X does Y", and contained three to five
words. For instance: "The boy brushed his teeth and "The train
10
to answer "yes" if the sentence was seen as sensible, and no"
if it was perceived as nonsense. The test contains 50% sensible
and 50% nonsense sentences. When five sentences had been
presented the subjects were required to recall the last word in
each sentence, in the order they were presented. This completed
the task of each telephone call. During the experiment this
procedure was repeated eight times (eight telephone calls), for
the experimental groups, with different sentences.
The Working Memory Span Test was chosen because it fulfilled the
demands we had on the telephone task. Thus it was possible to
repeat this test several times without strong learning effects.
It was also possible to keep the presentation time for each
telephone call constant, and to evaluate how well the subjects
managed to solve the task.
Presentation of the telephone task. The Working Memory Span
Test sentences were prerecorded on a tape. Each call started
with an instruction, telling the subjects that the person
reading (one of the authors) would present a number of sentences
to them. The subjects were informed that they, after each
sentence, had to answer yes" if the sentence was sensible and
no if it was nonsense. They were also told that they had to
answer within three seconds, and that a new sentence would be
read after these three seconds. Finally the subjects were
informed that they, after all sentences had been read, would
receive the command: "Repeat" and that they were then supposed
to repeat the last word in each sentence, in the order the
sentences were presented. Each presentation took roughly 60
seconds.
Position of telephone call and visual stimulus along the
£9359. Eight telephone calls were presented to the subjects in
the experimental groups during the experiment. Therefore, eight
specific positions (distances between 0 and 80 000 m) along each
of the two test routes were randomly selected (Table 1).
When the "car" passed these fixed points a telephone call was
initiated. At four of these eight positions, also randomly
chosen, the visual stimulus appeared in connection to the
telephone calls. For two of these four occasions, again randomly
11
the traffic outside the car, appeared shortly after the
tele-phone had rung, while for the remaining two occasions the visual stimulus appeared later, when the driver concentrated on solving
the telephone (communication) task. The random procedure was
used to make it impossible for the subjects to correctly
anticipate when the telephone should ring, if the visual
stimulus should appear in connection to the telephone call and
in case it did, what the temporal relation between them should
be. Table 1 summarizes the positions and timing of the telephone
calls and the visual stimulus.
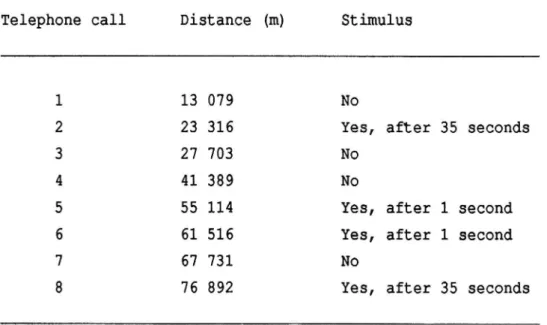
Table 1. Positions for telephone calls and occurrence of visual
stimuli along the test routes.
Telephone call Distance (m) Stimulus
1 13 079 No
2 23 316 Yes, after 35 seconds
3 27 703 No
4 41 389 No
5 55 114 Yes, after 1 second 6 61 516 Yes, after 1 second
7 67 731 No
8 76 892 Yes, after 35 seconds
Driving performance measures
Speed, lateral position and reaction time were used as perform
ance measures. Both measurements and stimulations were
con-trolled by the main computer controlling the simulator.
12
Lateral position (m) on the road was measured in relation to
a zero-position, defined as the position where the central line
of the road coincides with the central line through the driver s
body. Also the lateral position was sampled at a rate of two Hz.
Brake reaction time (s) was calculated as the time elapsing
from the onset of the red square until the brake pedal was
de-pressed ten mm or more. The resolution was 20 ms. If no driver
reaction (sufficiently hard braking) had been detected within
five s the stimulus was regarded as unanswered and put out. Subjective measures. To measure the subjects' workload the
NASA-TLX rating scale (Hart & Staveland, 1988) was used. The
subjects had to rate six different workload factors, namely
mental demand, physical demand, time pressure, performance,
effort and frustration level, on a continuous scale ranging from
very low to very high. They also had to rate the relative
weights of the different factors.
Communication measures. The number of correct sentence
judgments (sensible/nonsense) was used as a measure of the
decision part of the telephone task. For the working memory part
of the telephone task the number of correctly recalled last
words in the order they were presented was used as a measure.
Design
The study was performed as a two by two factorial design, where
one factor concerned the type of route driven (easy versus
hard), and the other factor the RTI system used (telephone
versus control). Procedure
The subjects had to fill in a questionnaire about background
variables (sex, age, driver license, distance driven each year,
experience of car driving, and of mobile telephone). After that
each subject was randomly assigned to one of the four
13
the experimental task. The subjects in the experimental groups
were told that they were supposed to drive an 80 km long route
in the simulator. They were asked to "drive" the simulator in
the way they normally drive a car, and avoid to "play" with it.
They were told to brake with their right foot. They were also
told that when they were driving, two things would happen. The
mobile telephone would ring, and a red square would appear on
the screen. When the telephone was ringing, the subject was
instructed to answer by pushing the button for the handsfree
function. After doing so they should listen to the instructions
that followed, and solve the task presented over the telephone.
When the read square appeared they were told to brake as fast as
possible. After reading and asking questions about the
instruc-tions the subjects in the experimental groups had some training on the telephone task. They practiced on three tasks of varying
difficulty (two, three, and four sentences respectively) sitting
at a table. The subjects in the control group were exposed to an
identical instruction, but without the part containing the
mobile telephone.
In the next training phase, all subjects were introduced to the
driving simulator. For the experimental groups the handling
aspects of the mobile telephone were repeated, and they could
practice to locate and push the button for the handsfree
func-tion. Thereafter all subjects drove a 20 km long practice route.
For all subjects the red square appeared three times, (at the
same location for all subjects) and the subjects could practice
to brake as fast as possible.
For the subjects in the experimental groups the mobile telephone
also rang three times, and the subjects could solve the same
problems as they did before, but now via the telephone and while
driving. When the training phase was over, all subjects had a
short brake during which they were offered coffee, tea, or
juice.
After the brake, the testphase began. During the testphase the
subjects performed the driving, reaction, and telephone (only
14
subjects' answers to the prerecorded telephone tasks were
recorded on tape. The driving performance measures were recorded
via the main computer under the test. After completing the 80 km long testroute each subject had to complete the NASA TLX. Finally the subjects were thanked for their participation in the study, and paid 250 SEK. The running of a subject took 2 2,5
hours in total.
RESULTS
The following results will be presented. The subjects reaction
time to the simulated danger situation (the red square), the subjects lateral position in connection to the telephone call, the subjects workload and speed, followed by the effects of
driving task complexity on subjects performance on the
tele-phone task.
Reaction time
It was predicted that the subjects in the experimental
(telephone) conditions would react slower compared to the
subjects in the control (no telephone) conditions. A two-way
ANOVA showed a significant interaction between route and RTI
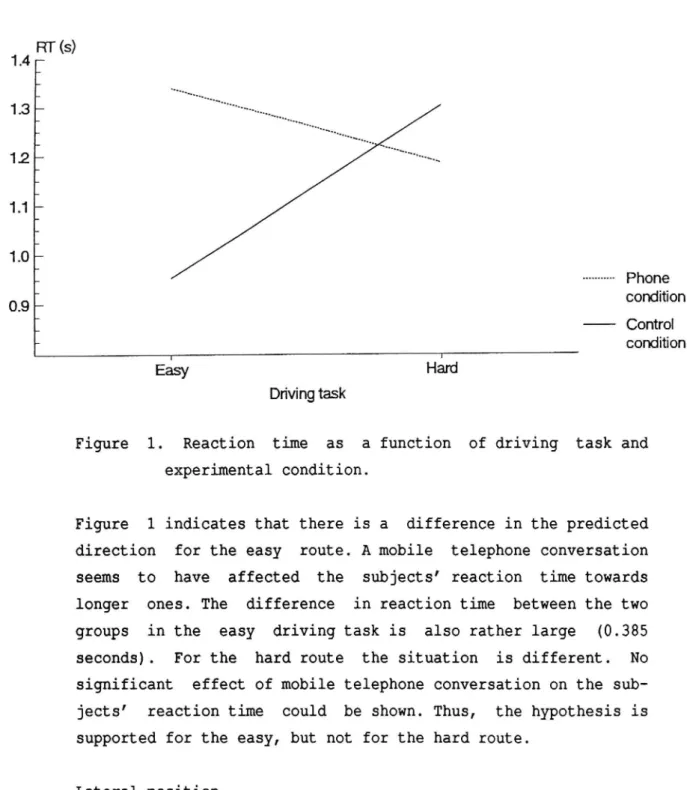
system, £(1,36)=6.40, p=.0124. Figure 1 shows the nature of this interaction.
13 12 1J 10 (19 I I T I I I T I I T Y T I T I I I I I I [ T i l a
in:
15 Control condMon [ r Easy Hani Driving taskFigure 1. Reaction time as a function of driving task and
experimental condition.
Figure 1 indicates that there is a difference in the predicted
direction for the easy route. A mobile telephone conversation
seems to have affected the subjects' reaction time towards
longer ones. The difference in reaction time between the two
groups in the easy driving task is also rather large (0.385
seconds). For the hard route the situation is different. No
significant effect of mobile telephone conversation on the
sub-jects reaction time could be shown. Thus, the hypothesis is
supported for the easy, but not for the hard route. Lateral_position
To check the hypothesis about an increased variation in lateral
position due to the mobile telephone calls we measured the
lateral position of each subject in the experimental groups for
a distance of 500 and 2.500 meters from the onset of each
telephone call. During the first distance (0-500 m) the subjects
must initiate the hands-free function of the mobile telephone,
and it is therefore of interest to inspect that distance
--- Phone
L8 L7 "LS 15 IA 13 12 13 10 16
closer. It is also of interest to analyze the entire period
during which the telephone conversation is run in parallel with
car driving. The second distance (0-2500 m) covers that period.
For the control groups corresponding measures were made. If the
hypothesis is correct we should expect a greater variation in
lateral position for the experimental groups, and the effect should be more pronounced when the tracking component of the
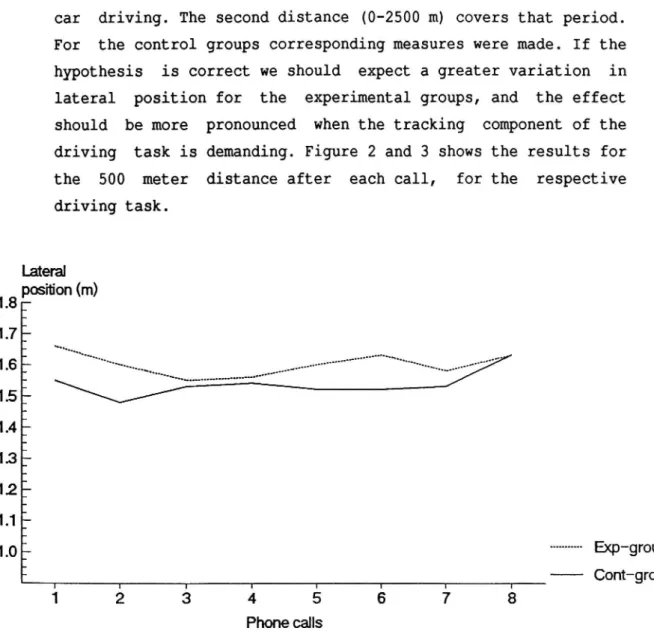
driving task is demanding. Figure 2 and 3 shows the results for
the 500 meter distance after each call, for the respective
driving task.
line
pos on(n0
é
&_
--- Exp group
: . , I . | 1 I I - Cont group
1 2 3 4 5 6 7 8
Phonecams
Figure 2. Lateral position 0-500 m after each telephone call for experimental and control groups in the easy condition.
Figure 2 shows that the difference between experimental and
control groups for the easy driving condition is very small. The difference was tested with a two-way ANOVA, and did not reach
17
... Exp grOUp
Cont group
. _q _- ... q _ _
Phone calls
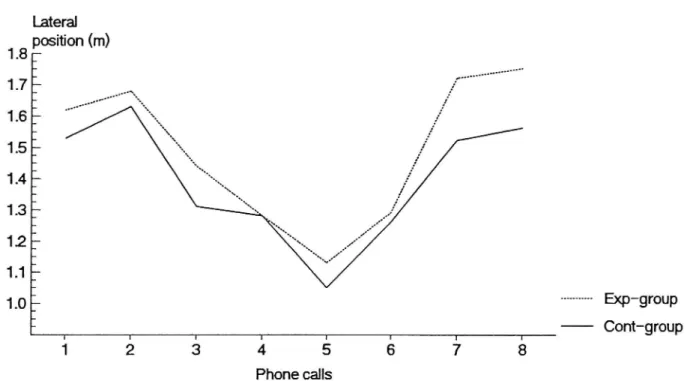
Figure 3. Lateral position 0 500 m after each telephone call for experimental and control groups in the hard condition.
Figure 3 shows that the difference between experimental and
control groups was larger for the hard driving condition.
There was a significant main effect of RTI system,
£(1,144)=10.97, p=.0012, and a significant interaction between RTI system and calls, §(7,144)=19.89, p=.0001. This interaction
had to do with the fact that the position of the telephone calls
were randomly generated, and some calls occurred on straight
sections of the road. Thus the hypothesis was confirmed for the
hard route, but not for the easy.
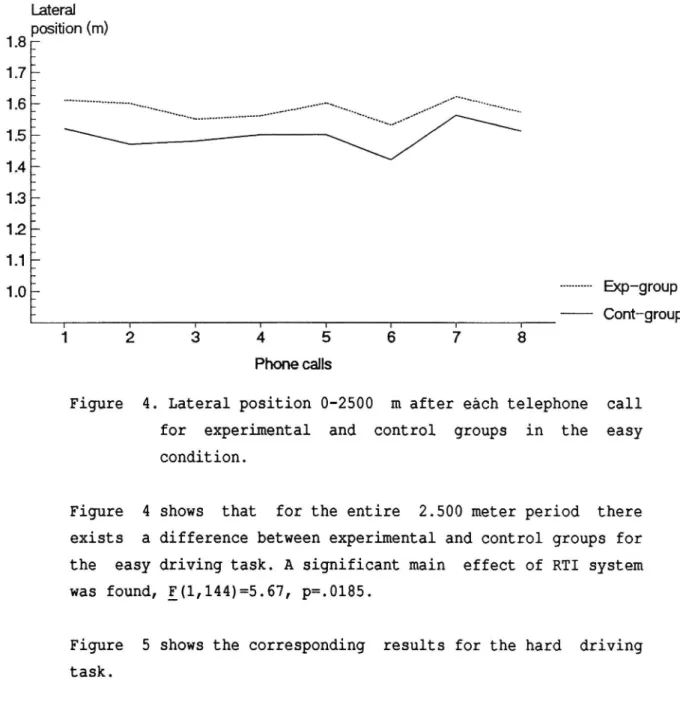
Figure 4 and 5 shows the corresponding results for the 2.500
L8 L7 LS 15 L4 L3 12 11 LO 18 basun position (m) E. --- Exp group E | | | 1 1 . I | Cont group 1 2 3 4 5 6 7 8 PhonecaMs
Figure 4. Lateral position 0-2500 m after each telephone call
for experimental and control groups in the easy
condition.
Figure 4 shows that for the entire 2.500 meter period there
exists a difference between experimental and control groups for
the easy driving task. A significant main effect of RTI system
was found, F(1,144)=5.67, p=.0185.
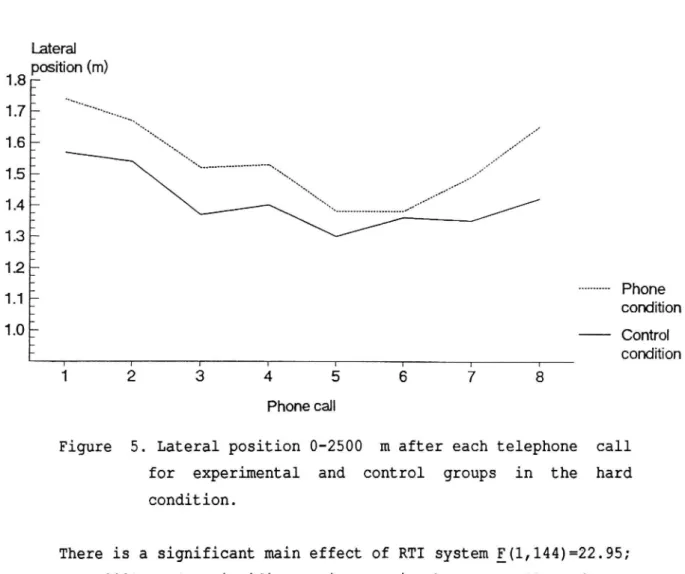
Figure 5 shows the corresponding results for the hard driving
19 li e pos on(n
8 E
1751.6 5
1.5 : 1.4 51.3 :
L25 i --- Phone : condmon ; Control _ , | . . . condMon 1 2 3 4 5 6 7 8 Phone callFigure 5. Lateral position 0-2500 m after each telephone call
for experimental and control groups in the hard
condition.
There is a significant main effect of RTI system §(1,144)=22.95;
p= .0001, and a significant interaction between calls and RTI
systems §(7,144)=6.78; p=.0001. So, the hypothesis is fully
supported when we look at the entire distance where the
tele-phone conversation was performed.
Workload. The use of NASA-TLX rating scales give scale values,
weights, and the combination "scale values*weights" for six
different factors. These factors are: Mental demand, physical
demand, time pressure, operator performance, operator effort,
and frustration level. The rating value of each factor
multi-plied by the weight for the respective factor was used for
further analysis. A two way ANOVA was performed on each factor. Table 2 shows the results from ANOVAs performed on each factor.
20
Table 2. Results of ANOVAs performed on the subscales in the
NASA-TLX rating scales.
Factor Source df F p
Mental demand RTI 1,36 30.40 .0001
Physical demand RTI 1,36 5.18 .0289
Time pressure RTI 1,36 6.72 .0137
Operator performance RTI 1,36 7.01 .0119
Operator effort RTI 1,36 5.05 .0308
Frustration level RTI 1,36 6.62 .0143
Frustration level RTI*ROU 1,36 5.95 .0198
Table 2 shows that there is a significant main effect of RTI
system on the factor mental demand" (§(1,36)=30.40; p=.0001).
Thus the telephone conversation had a significant effect upon
the subjects estimation of the mental demands in their task. The
same main effect was found for every factor. It should also be
emphasized that the factor "physical demands" also showed a
significant main effect of RTI system.(§(1,36)=5.18; p=.0289).
So the introduction of the physical demands associated with the
activation of the handsfree function seems to have produced a
higher subjective rating of physical demand. Finally for the
factor frustration level" there was a significant main effect
of RTI system.(§(1,36)=6.62; p=.0143), and a significant inter-action between RTI system and route (§(1,36)=5.95; p=.0198). The
subjects were more frustrated during mobile telephone use, and
this effect was influenced by route difficulty. In summary, the
hypothesis about higher workload due to the use of mobile
tele-phone was supported, but the hypothesis that workload should
increase with the complexity of the driving task was refuted.
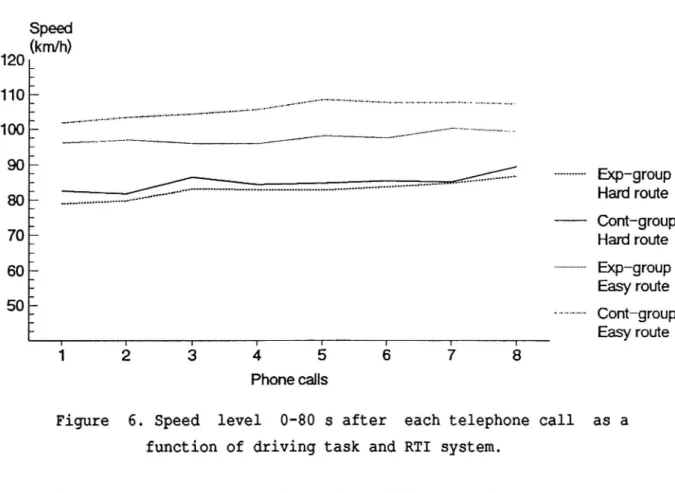
Speed level. For the experimental groups the subjects speed was
measured from the onset of each mobile telephone call and 80
seconds forward. This covered the entire telephone conversation
120 110 100 70 60 50 21
were taken. According to our hypothesis the subjects in the
experimental groups should have a lower speed due to the extra
workload introduced by the telephone task. Figure 6 shows the
speed levels relevant for this hypothesis.
Speed (anh) C _ww... E ____/\ --- Exp group
l _...
Haninnne
: - - Cont group T Hard route ?. ..._ Exp-group ; Easy route E- ' Cont group " Easy route 1 2 3 4 5 6 7 8 PhonecamsFigure 6. Speed level 0 80 s after each telephone call as a
function of driving task and RTI system.
As can be seen from Figure 6 a difference in speed exists
between experimental and control groups for both routes. As
pre-dicted the speed is lower for the experimental groups. The
difference is rather large and also statistically significant
(E (1,144)=14.65, p=.0002) for the subjects driving the easy
route, thus supporting the hypothesis.
The difference for the subjects in the hard route is very small,
and did not reach statistical significance (§(1,144)=1.36,
p=.2453). In this case the hypothesis is rejected.
Effects of driving task complexity on achievement in telephone
task. To investigate if the complexity of the driving task had
any effect upon the subjects performance in the telephone task,
22
words in correct order for the respective driving conditions
were counted.
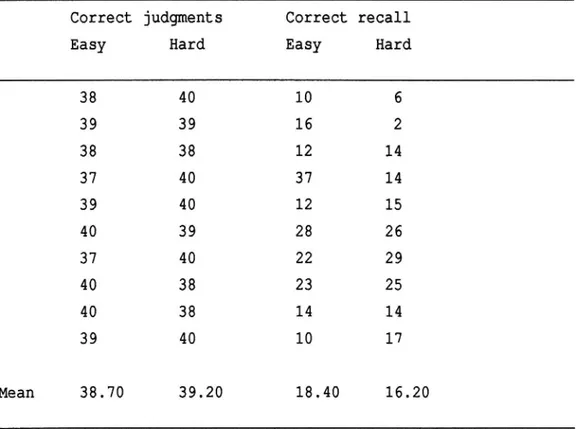
Table 3. Performance in the telephone task as a function of
driving task complexity.
Correct judgments Correct recall
Easy Hard Easy Hard
38 40 10 6 39 39 16 2 38 38 12 14 37 40 37 14 39 40 12 15 40 39 28 26 37 40 22 29 40 38 23 25 40 38 14 14 39 40 10 17 Mean 38.70 39.20 18.40 16.20
Table 3 shows that there is practically no difference between
the tasks when considering the number of correct judgments of
the sentence sensibility. There is a small difference in the
number of correct recall of the last words (in the correct
order) in each sentence. That difference is however very small,
and does not reach statistical significance. Consequently, the
23 DISCUSSION
Reaction time
It was predicted that the physical and mental distraction due to
a mobile telephone conversation should have a negative impact
upon drivers ability to react quickly to an unexpected event in
the driving environment. This effect was predicted to be
stronger when the complexity of the driving task increased. It
was, however, found that when the driving task was easy a mobile
telephone conversation had a negative impact on drivers ability
to react quickly, but when the driving task was complex no
negative impact was found. These results are somewhat sur
prising. A rather common assumption is that non driving related
information can be given to a driver when his or her workload is low. The results from this study do not support that assumption.
One possible way to explain these results is to consider how the subjects may have made their priorities between the task of driving, and the task of coping with the telephone conversation.
The task demands of the hard driving task may have forced the
subjects to concentrate on the tracking task. This involves
attention to, and judgments of the road geometry, and judgments of how to adapt the speed and steering strategy to the road geo-metry. In other words, the task demands may have forced the
sub-jects to regard the tracking task as their primary task.
Conse-quently, the telephone task may have been given the status of a
secondary task, and was therefore not allowed to influence the
drivers maneuvering behaviour to any greater extent. This could
explain the lack of difference between experimental and control groups in the hard driving task condition.
In the easy driving task the subjects did not have to allocate
much attention to the tracking component, and this may have led
the subjects to give the telephone task the highest priority.
Consequently, the task demands of the telephone task may have
24
extent. This could explain the large difference in reaction time between experimental and control groups in the easy task condi tion. If this explanation is correct, then the introduction of a non driving task can have different effects depending upon what
priority the drivers give the non driving task. This in turn depends upon the drivers' judgment of the complexity of the
driving task, and their own ability to cope with that
complex-ity. If the driving task is perceived as very easy the non driv-ing task may be treated as the primary task, and this may have
negative effects upon the drivers' ability to react quickly to
some emergency event. On the other hand, if the driving task is
perceived as hard it will presumably still remain the primary
task even if a secondary, non driving task, is introduced. If
this line of reasoning is correct it means that RTI systems for
non driving information should not give their information when
the driver's driving task is extremely simple. Instead it seems better to provide the driver with information when the driving
task has a medium complexity.
Other explanations of the reaction time results fail in one way
or another. For instance, another possible way to understand
these results is to take a closer look at the task demands of
the respective driving tasks. Common for both tasks is that the
subjects must detect the "brake stimuli", and perform a braking
maneuver. To detect the "brake stimuli" they must direct their
attention to the field where it occurs, and to brake quickly
they must shift their foot from the accelerator to the brake
pedal.
In the easy driving task the tracking component was fairly easy,
which probably led the subjects to have their visual attention
focused straight ahead most of the time, that is in the area
where the "brake stimuli" occurred. In the hard driving task the
subjects drove a rather curvy road which most likely led them to
sometimes focus their visual attention on areas where the "brake
stimuli" did not occur. Thus it seems reasonable to assume that
the subjects' detection of the brake stimuli was somewhat faster
25
task. Another aspect also speaks for this conclusion. It seems
reasonable to assume that the subjects' stress level was
some-what higher in the hard driving task, due to the more complex
tracking component. The results from the NASA-TLX also speak for this conclusion since the subjects in the hard driving task were
more frustrated than the subjects in the easy driving task. When
the stress level goes up this normally leads to a narrowing of
attention, in extreme cases to "tunnel vision". This presumed
narrowing of attention could have made it somewhat harder for
the subjects in the hard driving task to detect the "brake
stimuli".
The next phase in the reaction time measurement involves the
action of moving the foot from the accelerator to the brake
pedal. Since the mean speed for the easy versus hard route was
different, we should also expect a time difference between the
groups due to the differences in relative position between
accelerator and brake pedals. Earlier studies, for instance
Davies and Watts (1969), have indicated such a difference. Since
the subjects in the easy condition were driving faster, and thus had a somewhat longer relative distance between accelerator and brake pedal, it seems reasonable to assume that they needed a somewhat longer time to initiate the brake maneuver.
Consequently, the subjects in the easy condition may detect the "brake stimuli" quicker, but should need a somewhat longer time
to initiate the brake maneuver. The subjects in the hard condi-tion may detect the "brake stimuli" somewhat slower, but may be slightly quicker to initiate the brake maneuver. If the detec-tion time is the largest component then these two components can
be used to explain the results for the control groups in both
driving tasks. But, to apply the same logic to explain the
opposite results for the experimental groups is not possible. Another possible way to explain the results would be in terms of
arousal level. It would be possible to assume that the subjects
in the easy driving condition had a very low level of arousal caused by the rather boring task of driving straight ahead. This
26
could have explained their relatively slow reaction to the
brake stimuli" in the experimental group. In the hard driving
condition the subjects level of arousal may have been higher
due to the rather complex tracking component. This could explain
their somewhat quicker reaction to the brake stimuli" in the
experimental group. The problem is, however, that this cannot
explain the opposite results for the control groups. Lateral position
It was predicted that a mobile telephone call would negatively
affect drivers ability to monitor and adjust the vehicle s
position on the road. The effect was predicted to be stronger
when the demands of the driving task increased. The results from
this study mainly confirm the hypothesis. It seems that the
physical and mental distraction imposed by the telephone task
actually had an effect upon drivers' ability to maintain a
steady course on the road, and that this effect was more
pron-ounced when the tracking task was complex. This is probably
caused by the pressure on the driver to time share between the monitoring of the vehicle, and the telephone conversation.
Workload
The prediction was that workload would be increased due to the
mobile telephone call. Also this prediction was confirmed. A
somewhat surprising finding was that even physical workload was
increased, despite the fact that the only physical maneuver the
subjects had to do was to activate the handsfree button. This
may mean that the activation of the handsfree button should be
improved. A first improvement could be to make it larger, more
distinct, or both. Another possible improvement would be to
change its position to, for instance the steering wheel. A third
possible improvement would be to make the function voice
acti-vated. It was also predicted that workload would be more
in-creased when the driving task was complex. This hypothesis was
not supported, with the exception of a higher frustration level.
27
driving task gave the task of "driving" the car the highest
priority, and that the demands from the secondary task (the
telephone calls) were not allowed to interfere with the driving
task. When workload is increasing and threatens to be higher
than drivers capacity, one strategy is to concentrate the
efforts on the most important task. This will result in an
increased frustration level, since the driver must pay secondary attention to some tasks, and partly ignore other tasks.
Speedlevel
It was predicted that increased workload should lead to
decreased speed, and that the decrease in speed should be
proportional to the increase in workload. It was found that
there was a significant difference in the predicted direction
for the subjects in the easy, but not for those in the hard
driving task. Again, these results are somewhat surprising, but can be explained in the same way as the results concerning the
subjects reaction time. That is, the subjects in the easy driv
ing task may have turned the telephone task into their primary task. Because of the high workload devoted to the telephone task
this may have led to a decrease in speed. The subjects in the
hard driving task may, according to this hypothetical
explana-tion, have devoted most of their workload to the task of
driv-ing, and less to the task of solving the telephone task. Conse
quently, the decrease in speed was not made to the same extent.
However, it is also possible to explain these results in a com
pletely different way. The decrease in speed may simply have
been an attempt to reduce the noise level in the car, in order
to hear the message better. Since the drivers in the easy con
dition were driving faster, they also had to reduce the speed
more than the subjects in the hard condition. From this study it
is not possible to determine if any or both of these explana
tions are valid. However, the low noise level in modern cars
28
Effects of driving task complexity on achievement in the tele
phone task
The prediction was that the complexity of the driving task
should have an effect upon drivers ability to successfully perform the mobile telephone task. Analysis of the decision and
memory component in the telephone task did not reveal any
significant differences due to the complexity of the driving
task. It was also noted that the subjects performance on the
decision aspect of the task was close to perfect. In other words
we had a ceiling effect, meaning that this part of the test may
have been to simple. On the short term memory aspect there was a
tendency for the subjects in the easy task to perform better,
but this tendency was not significant. Consequently, the
predic-tion was not supported. This can be interpreted in many ways.
One possible interpretation is that the test used is not
sensi-tive enough to detect any difference in performance. Another
possible interpretation is that the difference in driving task
complexity was to small. Manipulation of the tracking component
can be the wrong way to increase task complexity since the
tracking task of driving should be one of the most overlearned
tasks. It would be of interest for future studies to vary driv
ing task complexity in other ways, and to investigate the
effect(s) on a secondary task. CONCLUSIONS
In contrast to the conclusions drawn by Brown et al., 1969, we
found that even very simple tasks of car driving can be affected by a secondary task like a mobile telephone conversation. New is
also the finding that the most severe effect on reaction time
was found when the driving task was very simple. If this finding can be replicated it has implications for when RTI systems for non driving information should offer information to a driver.
It must be emphasized that the effect on simple reaction time,
29
drivers. This probably means that the effects can be much more
pronounced for other categories of drivers.
Implications for traffic safety. Under some circwmstances the
increase of brake reaction time may cause problems. A driver on a straight and lonely road who is engaged in a tricky telephone
conversation may react too slowly when some animal suddenly
crosses the road. These kind of accidents are common in some
European countries.
A sudden decrease in speed for some drivers may or may not
increase the risk of accidents. It can be argued that anything
that increases the variation in speed in a traffic stream has
the potential to increase the risk of an accident. Increased
variation in speed will make the predictability of the traffic
stream lower, which in turn will make it harder for drivers to
make judgments of a correct distance to other drivers. It is
also easy to imagine situations where the risk would be
increased, and also not increased. For instance, a driver
driv-ing in fog on a motorway, and bedriv-ing the first car in a platoon
of cars may be one cause of a series of collisions, if the
driver suddenly slows down. If the driver is the last one in a
platoon of cars, nothing dangerous will happen.
Variations in lateral position can contribute to an accident if
the variations are so large that the driver is leaving the
correct lane. In this context it must be noted that the
increased variation in lateral position found in this study was rather small, and hardly can be regarded as dangerous.
Implications for future research. The subjects used in this
study were all skilled drivers. It is therefore of interest to
investigate other groups of drivers, for instance less skilled
and old drivers. Especially the category old drivers is of
special interest, since the proportion of old drivers is
30
It is also of interest to proceed systematically in the study of
the effects of mobile telephones on driver behaviour. A next
step would be to make the drivers reaction time task somewhat
harder. In this study the subjects task was simply to detect
when a visual stimuli appeared on the screen, and thereafter
perform a pretrained and overlearned action. In real driving the situation is seldom that simple. A driver must certainly detect
an object or event, but also sometimes identify it, and decide
what to do when confronted with it. A next step towards a more
complex situation would therefore be to introduce visual stimuli
that must be identified, for instance different stimuli with
different implications for the drivers actions.
Another interesting questions for future research is what
effect(s) different types of telephone conversations have on
driver behaviour. The task used in this study is rather
abstract, and loads the drivers decision-making and memory
capacity. Of interest would be to investigate the effects of
telephone conversations loading drivers spatial abilities.
Consider for instance the situation where a driver receives
navigation information via the mobile telephone. The spatial
character of this information may or may not interfere with the spatial character of car driving.
When discussing the traffic safety effects of mobile telephones
it is also necessary to take a view from an aggregated level,
and look at the system effects on traffic safety. With the help
of simulation models it should be possible to investigate what
will happen in terms of traffic flow, traffic conflicts, poten
tial accidents, when different proportions of drivers are
31
ACKNOWLEDGMENTS
The authors are indebted to a number of persons who have helped
us to plan, perform, analyze, and interpret this study. Maria
Berlin has assisted in the running of many subjects, and also participated in the data analysis. Håkan Jansson created the routes and routines for collection of driving performance data needed in this study. Besides he was most helpful during the
running of the experiment, at any hour of the day. Roland
Östergren was responsible for the function and control of the
mobile telephone equipment, and the collection of data from the
telephone task. A number of colleagues have made critical and
helpful remarks on earlier versions of this manuscript. Special
thanks to Kåre Rumar, Roger Johansson, Irma Alm, and Sven
Dahlstedt for valuable comments. Christina Ruthger has corrected
the language. Thanks to Sixten Nolén for the creation of all
figures in the report.
We are most grateful to Ericsson Radio Systems, represented by
Erik André. They provided us (without any cost for the project) with the mobile telephone equipment necessary to perform this study.
This study was financially supported by the Swedish Transport
Research Board (TFB), and the Swedish National Road
32
REFERENCES
Alm, H., Nilsson. L. (1989). Mobiltelefon-tillgång eller fara?
Unpublished manuscript.
Baddeley, A.D, Logie, R., Nimmo-Smith, I., & Brerefon, N.
(1985). Components of fluent reading. Journal of Memory and
Language, 24, 119-131.
Brown, I.D., Tickner, A.H., Simmonds, D.C.V. (1969).
Interfer-ence between concurrent tasks of driving and telephoning.
Journal of Applied Psychology, §§(5), pp 419-424.
CHP: Mobile telephone safety study (1987). Department of
California Highway Patrol, USA.
Davies, B.T. and Watts, J.R. (1969). Preliminary Investigation
of Movement Time Between Brake and Accelerator Pedals in
Auto-mobiles. Human Factors, 11(4), 407-410.
Hart, S. G., Staveland, L.E. (1988). Development of NASA;TLX
(Task Load Index): Results of Empirical and Theoretical
Research, ref in P.A. Hancock and N. Meshkati (Editors), HUMAN
MENTAL WORKLOAD, Elsevier Science Publishers B.V.
(North-Holland).
Nilsson, L. (1989). The VTI Driving Simulator. DRIVE Project
V101? (BERTIE), Report No. 24.
Nordmark, S., Jansson, H., Lidström, M., Palmkvist, G. (1986). A moving base driving simulator with wide angle visual system. VTI särtryck 106A, Swedish Road and Traffic Research Institute.
Nordmark, S., Jansson, H., Lidström, M., Palmkvist, G. (1988).
The VTI driving simulator-Recent developments. Swedish Road and Traffic Research Institute (in press).
Stein, A.C., Parseghian, Z., Allen, R.W. (1987). A simulator
study of the safety implications of cellular mobile telephone
use. In: American Association for Automotive Medicine, Proceed
ings of the 3lst Annual Conference. Desplaines:AAAM.
Zwahlen, H.T., Adams, Jr. C.C., Schwartz, P.J. (1988). Safety
aspects of cellular telephones in automobiles. ISATA, Florence,