Department of Thematic Studies
Environmental Change
2021-01-19
MSc Thesis (30 ECTS credits)
Science for Sustainable development
Prince Kwarteng Adiyia
Supervisors: Sepehr Shakeri Yekta and Rubens Perez Calegari
Examiner: Francesco Ometto
Anaerobic Co- digestion of Digestate
with Glycerol to enhance Biogas Production
ii Copyright
The publishers will keep this document online on the Internet – or its possible replacement – for a period of 25 years starting from the date of publication barring exceptional
circumstances.
The online availability of the document implies permanent permission for anyone to read, to download, or to print out single copies for his/her own use and to use it unchanged for non-commercial research and educational purpose. Subsequent transfers of copyright cannot revoke this permission. All other uses of the document are conditional upon the consent of the copyright owner. The publisher has taken technical and administrative measures to assure authenticity, security, and accessibility.
According to intellectual property law the author has the right to be mentioned when his/her work is accessed as described above and to be protected against infringement.
For additional information about the Linköping University Electronic Press and its procedures for publication and for assurance of document integrity, please refer to its www home page: http://www.ep.liu.se
iv Table of Contents
1.0 Introduction ... 3
1.1 Problem Statement, aim and research questions ... 5
2.0 Background ... 7
2.1 Anaerobic Digestion ... 7
2.2 Factors influencing Anaerobic Digestion Process ... 9
2.2.1 Temperature ... 9 2.2.2 pH ... 10 2.2.3 VFAs ... 10 2.2.4 TS and VS ... 10 2.2.5 Loading... 11 2.3 Biomethane Potential (BMP) ... 12
2.4 Anaerobic Digestion in the Brazilian sugar and ethanol industry ... 12
2.5. Digestate ... 13
2.6 Anaerobic Co-Digestion (AcoD) ... 14
2.6.1 Anaerobic Co-Digestion of Glycerol ... 15
3.0. Material and Methods ... 18
3.1. Experimental Setup... 18
3.1.1 Feedstock ... 18
3.1.2 Inoculum ... 18
3.1.3. CH4 Potential of Digestate and Glycerol ... 18
3.3 Analytical measurements ... 20
3.3.2 COD ... 20
3.3.3 pH analysis ... 20
3.4 Biogas and Methane Measurement... 21
3.4.1 Methane Yield ... 21
3.6 Reactors Operation ... 22
3.6.1 Reactor Monitoring... 23
4.0 RESULTS AND DISCUSSION ... 23
4.1 Batch Experiment... 23
4.1.1 Composition of Digestate and Glycerol ... 23
4.2 Biogas and Methane yield ... 24
4.3 Reactors performance ... 27
iv
5.0 Conclusion and Recommendations ... 33 6.0 References ... 35 7.0 Appendix ... 40
1 Abstract
The Brazilian sugarcane and ethanol industries produce lot of waste which has potential for energy production. Anaerobic digestion (AD) can be effectively utilized for producing biogas from these wastes. During the AD process, huge volumes of digestate are produced with some being employed in fertilizer application whilst large volumes are mostly stored in uncovered tanks. This result in emission of residual methane and loss of energy which can be recovered through post- digestion approaches. To analyse optimal utilization of this digestate and enhanced biogas production, co- digestion of post- digestate from a continuously stirred reactor (CSTR) performing co-digestion of sugarcane waste from Brazil (Vinasse, filter cake and straw) with addition of different glycerol concentrations were studied. The addition of glycerol characterised by its biodegradability and high organic content makes it a suitable substrate to enhance biogas production. A biomethane potential was assessed when the digestate was co-digested with 15% and 25% CODg/L of glycerol. The batch test lasted for 39 days. The results demonstrated that, co-digestion of digestate with glycerol has the potential of increasing cumulative methane and biogas yield with 25% addition producing the highest methane and biogas yield (318 Nml/gCOD and 196 Nml/gCOD) which was approximately 6 times higher compared to mono-digestion of the digestate.
Anaerobic co-digestion of digestate and glycerol was examined in two lab scale reactors (CSTR) at mesophilic conditions (35oC) and were run for 90 days. The reactor (R1) performing
co-digestion increased methane and biogas production by 300% and 170% when glycerol concentrations of 15% and 25% of influent COD were added, respectively. Moreover, there was a decrease in CH4 yield when the reactors were continuously fed with 15% and 25%
CODg/L of glycerol. This was an indication that, microorganisms easily digested glycerol addition at the early stages. Glycerol addition (50% CODg/L) resulted in a decrease in CH4
and biogas production. This result shows, CH4 yields in the post-digester can be enhanced with
glycerol addition if it does not exceed a limiting percentage of 50 of the organic loading rates of the feed.
2 List of Abbreviations
AD- Anaerobic digestion ACoD- Anaerobic co-digestion BMP- Biomethane potential COD- Chemical oxygen demand CSTR- Continuous stirred tank reactor GHG- Greenhouse Gas
HRT- Hydraulic retention time OLR- Organic loading rate TS- Total solids
VFA- Volatile fatty acids VS- Volatile solids
3 1.0 Introduction
Energy plays an indispensable role in human life and is an essential element to human and economic development (Surendra et al., 2014). It is needed to meet basic human needs and its pivotal role in industrialization has led to an industrial revolution (Stern & Kander, 2012). The world’s reliance on fossil fuels has impacted climate change due to the increase emission of Green House Gases (GHG) (Owusu & Asumadu-Sarkodie, 2016). Pazheri et al., (2014) suggested that there is a big challenge to the energy sector in achieving sustainability as well as securing sustainable and clean energy to meet the increasing global demand. To tackle this challenge, the energy sector witnesses a tremendous transformation through global exploitation of renewable energy sources. The use of biofuels such as bioethanol, biogas and biodiesel to potentially harness energy from agricultural waste, crop residues, municipal solid waste, pulp and paper, sugar industries among others have been recently employed by many countries (Rao, et al., 2010). According to Paoli et al., (2011), reliance on agriculture crops for energy is a platform that can exacerbate food insecurity and hence a better utilization of agriculture by-products is an avenue that can curb a trade off in the food- energy nexus. The trend towards a high intensification of agriculture productions have accentuated adversities in waste management and improper management of these wastes on soil surface have caused contamination in the environment including pest generation and emission of GHG (Sousa, et
al., 2017). Harnessing agriculture waste and crop residues for energy production provides a
salient way of reducing the migration of food products into biofuels production and GHG emissions (De Rossi et al., 2017).
Sugarcane is commonly cultivated across the globe, and produced in more than 109 countries across the world with 1.91 billion tons harvested worldwide in 2013 (Dotaniya et al. 2016). The sugarcane industry is an important sector to the global economy especially providing income and employment to the locals in a country (Sawaengsak & Gheewala, 2017). The industry also generates large amounts of by- products that contains high amounts of carbohydrates making it an avenue of generating energy to supplement the global demand for energy. The energy potential of sugarcane makes it the most economical important energy crop and the utilization of its by-products into energy has been considered as a vital channel in the transition to sustainable use of agro- products into energy (Sugarcane Wastes | BioEnergy
4
Brazil contributes enormously to sugarcane production in the world. According to Janke et al., (2014), the industry contributed for USD 36 billion to the country’s revenue during 2012 to 2013. Like most agriculture producing countries, increase and changes in production in the sugar cane industry is responsible and have caused a complex problem in waste generation and management. From the report of De Rossi et al., (2017), the processes that are involved in the production of sugar and ethanol generate high volume of waste, such as Vinasse, straw, filtercake and baggase with high organic matter content. These by- products possess great potentials in the production of biogas due to their hemicellulose, cellulose and lignin composition (Janke et al. in 2014).
Another sector that has prominently contributed to world’s energy matrix is biodiesel production as it offers advantages over the conventional diesel such as its renewability, biodegradability and lower emissions in GHG (Kolesárová, et al., 2011). This has resulted in several countries using biodiesel. For instance in Brazil, a 4% addition of biodiesel was mandated to the country’s energy mix resulting in an increase of 5% whilst in the European Union and the United States, it supplements to 5.75% and 20% of energy, respectively (Viana,
et al., 2012). However, Anitha et al, (2016), stated that, one impediment that the biodiesel
industries face is the large amounts of glycerol generated as a by- product which is produced during transesterification process. According to Viana et al., (2012), glycerol production across the world was around 3 000 000 tons in 2011 and is estimated to increase to 4 600 000 tons in 2020.
One solution to utilizing these by- products is anaerobic digestion (AD). The AD process involves the breakdown of complex organic matter into simpler compounds in the absence of oxygen to produce a gas mixture of methane, carbon dioxide and other minor gases, so called biogas (Mata-Alvarez et al., 2014). AD has presented as a promising way of producing biogas and digestate (i.e. residues of AD processes) from the organic waste from sugarcane processing (Janke et al. in 2014). The biogas can be used as fuels for heating, electricity generation and upgraded to natural gas quality (biomethane) and used as fuel for vehicles, whilst, digestate can be applied as fertilizers in agriculture (Holm-Nielsen et al., 2009). In this context, AD contributes to a pathway of sustainability and plays an important role in a circular economy through its optimal utilization of waste, production of renewable energy and nutrient recycling (Ekstrand,2019)
5
According to Sambusiti et al., (2015), the use of digestate for agriculture land as an organic fertilizer might not be feasible in the long term considering the increasing number of biogas plants in certain areas which might lead to oversupply. For instance, Menardo et al., (2011) stated that due to different seasonal times in crop production and soil type, digestate are stored in tanks. The storage of these digestate especially those in uncovered tanks could result in emission of GHG such as CO2, CH2, N2O into the atmosphere which affects the climate and
causes atmospheric pollution. To address this situation, studies have shown that the resulting digestate from AD has the potential for further biogas production and Balsari et al., (2009) proposed that, recirculation of digestate is an effective way to reduce oversupply and reduction of GHG from the storage and transportation of digestate. Since then further studies have focused on maximizing biogas potential and yield of digestate to enhance the biogas production and waste reduction efficiency of AD processes (Lindner et al., 2015). Digestate treatment by different methods (pre- and post-treatment) classified as chemical, physical, biological and mechanical have been proposed by researchers as a way of improving biodegradability, breakdown of residual lignin and nutrient quality. However, according to Carlsson et al., (2012), though pre and post-treatments methods have advantages of increasing methane yield and biodegradability, the process is cost intensive through the use of chemicals and other equipment and there is high chance of losing organic matter through intensive pretreatment (Lindner et al., 2015: Sambusiti et al., 2015).
1.1 Problem Statement, aim and research questions
As stated earlier, the use of AD to produce biogas from sugarcane by-products is an effective way to reduce waste from the sugar industries. The application of digestate as fertilizers is an avenue that AD contributes to agriculture production. AD is a complex process which involves various microorganisms that are subjected to the control of environmental conditions and the amount of biogas produced also depends on the substrates used (Hagos, et al., 2017). It is reported that, the digestion of mono-substrates has been successful over the years. However, Hagos et al., (2017) stated that, due to nutritional imbalances for microorganisms, the effective way to optimally generate and improve biogas and methane yield is through anaerobic co-digestion (AcoD) from different substrates. AcoD, which is a simultaneous co-digestion of two or more substrates either from municipal solid waste, agriculture by-products or animal manure has been identified as a pathway of minimizing the limitations and barriers associated with nutrient limitation in AD processes (Mata-Alvarez et al., 2014).
6
Recently, AcoD of substrates from sugarcane by-products with other organic wastes such as vinasse with coffee residues , vinasse with filter cake, vinasse with chicken manure and few others have gained popularity (Pinto et al., 2018; López González, et al., 2017 ). However, solutions for a more effective handling and utilization of digestate in sugarcane processing industry have not yet been established. Hence, utilizing the digestate through co-digestion methods with highly degradable substrates such as glycerol can be a way to enhance its degradation. In addition, poor quality of glycerol from biodiesel due to high impurities and high cost of glycerol purification have led to a lower market demand and its large amounts produced have created a market surplus (Beschkov, et al, 2017). The need to utilize and transform glycerol to a valuable product is important as it will enhance the economic and environmental suitability to biodiesel production (Siles et al., 2010). This research aims to assess the biogas potential of glycerol and digestate (from anaerobic digestion of vinasse, straw and filtercake) in an AcoD as a solution for enhancing energy recovery from wastes produced in sugarcane processing and biodiesel industries. The main reason behind this research is to find an alternative approach to reduce cost intensity such as high energy consumption, chemical cost and the possibilities of inhibition from by- products related digestate handling and also create a market for the oversupply and storage of digestate and glycerol through biogas production,
The study addresses the following research questions:
1. What are the biomethane potential of digestate, glycerol and a combination of the two? 2. What is the biogas and methane yield of digestate and its co-digestion with glycerol in
a continuous experiment?
3. Is glycerol a suitable substrate for increasing biogas production of digestate from anaerobic digestion of vinasse, straw and filtercake?
7 2.0 Background
This section provides an overview of background information related to anaerobic digestion. It emphasizes on ACoD of digestate, glycerol and other substrates that are related to the subject. Biomethane potential is also discussed in this section.
2.1 Anaerobic Digestion
AD has been identified as an avenue for sustainable waste treatment due to its potential energy recovery (Mata-Alvarez et al., 2014). In recent years countries like Sweden, Germany, Austria and others have deployed its use as an alternative energy due to its renewability, economic development and environmental benefits by means of offsetting CO2 emission (Rao et al.,
2010). It is the degradation of organic matter to biogas in the absence of oxygen. There are four biochemical processes involved in anaerobic digestion: hydrolysis, acidogenesis, acetogenesis and methanogenesis. The process also depends on the interaction of numerous microorganisms that occurs in the four different stages (Surendra, et al., 2014). Two major gases produced from AD process are CH4 and CO2 with CH4 (50–75%) and CO2 (25–50%),
8
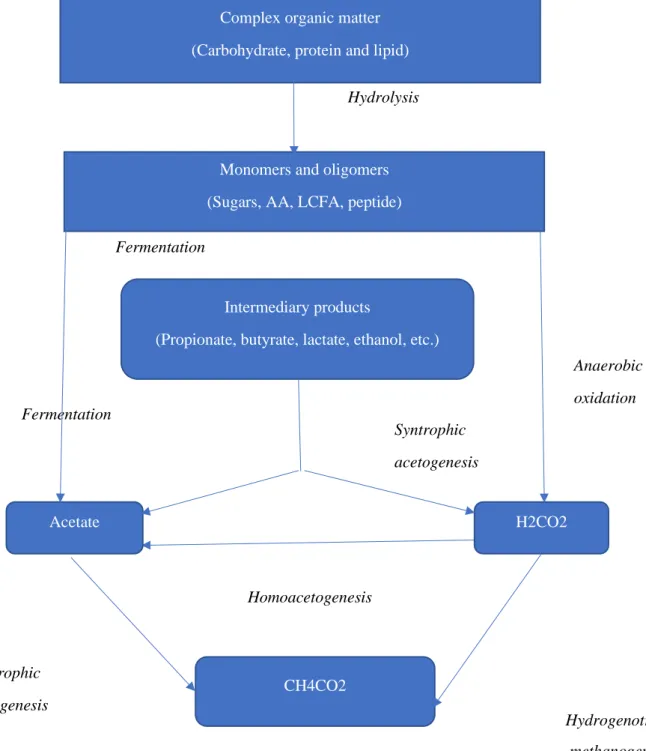
Fig. 1. Process involved in AD. Modified from (Surendra et al, 2014)
The hydrolysis stage involves the decomposition of complex organic compounds such as protein, fat, and carbohydrate. These compounds are fermented and converted into H2, CO2,
VFAs such as acetic acids by the acidogenic bacteria. VFAs are metabolized by bacteria and converted into acetate in the acetogenesis stages. Finally, methanogenic bacteria convert the acetate, CO2 or H2 into CH4 (Surendra, et al, 2014).
Fermentation
Hydrogenotrohic methanogenesis
Complex organic matter (Carbohydrate, protein and lipid)
Monomers and oligomers (Sugars, AA, LCFA, peptide)
Intermediary products
(Propionate, butyrate, lactate, ethanol, etc.)
Acetate H2CO2 CH4CO2 Hydrolysis Fermentation Syntrophic acetogenesis Anaerobic oxidation Homoacetogenesis Acetotrophic methanogenesis
9
2.2 Factors influencing Anaerobic Digestion Process
AD is a complex process due to the interaction of various microorganisms and environmental factors. The characteristics of these organisms vary within the digester. Maintaining a balance in microbial population and monitoring various operating conditions is important to achieve a successful process and optimal methane yield. Factors such as temperature, pH, alkalinity, total solids (TS) and volatile solids (VS), the type of substrates, organic loading rate (OLR) and hydraulic retention time (HRT) should be meticulously monitored since it can affect the efficiency of biogas yield and microbial process which can cause AD instability (Fahriansyah and Andrianto, 2017).
2.2.1 Temperature
Temperature is a crucial factor to consider in AD process. It can affect the physiochemical properties of substrates and methanogens are also sensitive to changes in temperature, hence sudden changes can affect the process (Kim et al., 2017). AD process operates at two temperatures, mesophilic 30–40°C and thermophilic 50–60°C. Methane yield is the main disparity between mesophilic and thermophilic. A small change in temperature from 30- 32°C can affect the bacteria which in turn affects biogas yield. Yang et al., (2018), suggested that different types of microorganisms favor mesophilic and hence makes it more stable compared to thermophilic. Stable production of methane is known to produce at 32-35 °C (Sorathia et al., 2012). Kim et al., (2017), study on the effect of temperature on AD process showed that at an organic loading rate of 6.7 g COD·L−1·d−1(HRT 30 d) and 5.0 g COD·L−1·d−1(HRT 40 d) for mesophilic and thermophilic conditions respectively the highest methane yield was evident under mesophilic conditions whilst it also showed low concentration of propionate and acetate. Other studies suggest thermophilic digestion yields higher CH4 compared to mesophilic
because methanogens are known to prefer higher temperatures, however Yang et al., (2018), stated increase in VFAs and ammonia are the impediments related to high temperatures. Wilson
et al., (2008), studies also revealed that reactors operated at highest temperature of 53°C were
10 2.2.2 pH
pH concentration is an important factor that influence AD process. It affects methane yield and solubilization of organic matter (Feng et al., 2015). pH is mostly low in the early stages of AD process due to the formation of organic acids. The hydrolysis and acidogenic stages operates at pH values between 5.5-6.5 whilst microorganisms in the methanogenic stage prefer pH value of 6.5-7.8, (Siddique & Wahid, 2018). It is considered important as it determines a favorable environment for microbes in a digester (Nguyen, 2014). Various microorganisms are favorable to different pH values and Feng et al (2015) stated that to attain an optimum methane yield, the most favorable pH values should be in the range of 6.8 and 7.2. Keeping pH neutral in AD is very paramount as low pH can cause the accumulation of VFAs and inhibition methanogenic growth (Nguyen, 2014). The addition of alkali such as lime is a way to help overcome low pH. 2.2.3 VFAs
Volatile fatty acid (VFAs) are important intermediary compounds which can cause an imbalance in AD process. High concentrations of VFAs causes a decrease in pH and primarily causing system failures. Constant monitoring and examining of VFAs is imperative to enable good performance in a digester (Wang, et al, 1999). Easily degradable substrates have the tendency of accumulating VFAs which affect the development of methanogens or microbial stress (Nordlander, et al, 2017). Though monitoring of all VFAs are important, key attention to butyric acids have shown to be a proper way of ensuring system stabilization since butyric acid are inhibitory to methanogenic bacteria (Nguyen, 2014).
2.2.4 TS and VS
The water or moisture content of a substrate is a common and important parameter that impact AD process. The water content enhances growth of bacteria and movement of nutrients. It also minimizes the mass transfer of substrate. In view of this, Tsunatu, et al., (2014) suggested TS of a substrate requires monitoring in AD process as continuous increase in TS causes a drop-in water content which affect microbial activity. TS is the dissolved organic matter of a substrate expressed as the percentage of the total weights in grams per kg (Orhorhoro et
al..2017). TS is determined by weighing the substrate and drying it in an oven at a temperature
of 105 until its water content evaporates to zero. Studies by Orhorhoro et al., (2017): Tsunatu,
11
Volatile Solids is the organic fraction of TS, its determination is important as it aid in investigating the amount of organic matter of a substrate. VS content of a substrate is a way to determine the biogas potential of a substrate, Tsunatu, et al., (2014) and shows how much organic matter is degraded. To determine the VS, the residue from TS is burned in a muffle furnace at 550 °C for at least two hours. The crucibles are then cooled in a desiccator till it reaches room temperature and weighed. Orhorhoro et al., (2017) studies on effect of TS and VS on biogas yield concluded that, increasing percentage of VS correlates to an increase biogas yield and vice versa. In their research it was observed that, 91.1% (2.88kg) volatile solids generated the highest amount of biogas.
2.2.5 Loading
The loading rate mostly referred as Organic loading rate (OLR) is defined as the amount of dry
solids that is fed to a reactor per unit volume of a digestion process. The OLR should be
carefully fixed and adapted to active microorganisms as low OLR results in inefficiency whilst higher OLR thus beyond certain range can cause VFA accumulation (Siddique & Wahid, 2018). Again, the fact that there can be inconsistencies in the supply of feedstock or substrates requires that there should be proper management to prevent any unplanned circumstances. A study by Bi et al., (2019) on the effects of OLR of chicken manure showed at 1.6 and 2.5 kg loading rate high OLR of 2.5kg lead to an increase in VFA accumulation suppressing methanogenic activities especially in thermophilic reactors. The study further suggested both thermophilic and mesophilic reactors were efficient at low(1.6kg) OLR. (Ferguson, et al., 2016) posits high concentration of glycerol causes inhibition and system instability. The accumulation of VFAs was result of high (more than 1% addition) organic rate of glycerol as demonstrated by Fountoulakis et al., (2010) whose experiment was on co- digestion of sewage sludge and glycerol.
12 2.3 Biomethane Potential (BMP)
The microorganism inherent in a feedstock are sensitive to environmental conditions. This requires that certain characteristics of these feedstock such as biodegradability needs to be known as it affects efficient operation of AD (Filer, et al., 2019). An experimental test that has proven to be successful in determining the biodegradability of a substrate is the biomethane potential test (Viana et al.,2011). It aids in determining the methane potential of a substrate and has proven to be a useful tool in providing significant predictions for a large-scale anaerobic digester compared to theoretical calculations of methane potential (Esposito et al., 2012). Theoretical calculations mostly provide higher results. Various literatures have different approaches to BMP as there is no defined standard protocols for BMP. However, BMP tests require a blank, substrate and control Filer, et al., (2019) and according to Holliger et al., (2016) one compulsory element for the validation of BMP tests is conducting it in at least triplicates. They are mostly performed in bottles and filled with inoculum and substrate in a ratio of 2:1 (inoculum: substrate). They are then subjected to a temperature of 35 C or 55 C (Filer, et al., 2019). The methane potential of a substrate is determined by subtracting the methane of the inoculum mostly known as blank from the methane production of the substrate and are expressed in terms of COD or VS of the substrate (Holliger et al., 2016).
2.4 Anaerobic Digestion in the Brazilian sugar and ethanol industry
Brazil is currently the world’s leading producer in sugarcane as favorable climatic conditions and soil types has resulted in an increase production of the crop (FAO, 2012). In 2014, the estimated sugar production was 40.97 million tons (Botellho et al., 2014). The sugar industries producing sugar and ethanol are mainly responsible for generating by-products such as vinasse, filtercake, straw, and bagasse (De Rossi, 2017). These wastes are known to have high commercial importance. However, filtercake and vinasse have been applied as fertilizer for sugarcane production, whilst straw are indiscriminately managed and left to decay (Janke et
al., 2015). The application of vinasse as fertilizer poses numerous environmental impacts on
surface and ground water (Moraes et al., 2017). Filtercake which is obtained during the crushing stages of sugarcane juice is rich in organic matter and a source of carbon and nitrogen making it a good potential for biogas production. Sugarcane straw is a fibrous residue consisting of 40% cellulose, 35% hemicellulose and 15% lignin and is generated from the crushing of sugarcane. Vinasse is a by-product of ethanol distillation and it is estimated that a
13
liter of ethanol production produces 8-18 liters of vinasse. It has a high amount of organic matter making it beneficial for fertilizer application and biogas production (Botellho et al., 2014). Various studies have recently been done on utilizing sugarcane by-products for biogas production. In recent years the sugarcane industry has developed new methods and processes to create an energy balance in utilizing these waste, Janke et al., (2014) studied the biomethane potential of the Brazilian sugarcane industry in Sao Paulo and concluded that the biogas yield for filter cake, vinasse, bagasse and straw were 486, 647,528, and 395 NmL/gVS respectively. The study further suggested that full utilization of filter cake and vinasse to biomethane could supplement 10% and 17% of the total natural gas consumption in Sao Paulo. Again, a quarter and half of bagasse and straw conversion into biomethane could add 54% of energy. Furthermore, digestate from the anaerobic reaction of these waste can also be applied as fertilizer in sugarcane production. This is considered to be sustainable compared to that of direct application of filtercake and vinasse as fertilizer (Moraes et al., 2017).
2.5. Digestate
The potential of the Brazilian sugar industry’s waste does not contribute only to energy but also to agriculture production through the application of digestate as fertilizers (Janke et al., 2014). Digestate which is a by- product of AD is mainly composed of 90% water, organic matter and undegraded digestate (Sambusiti et al., 2015). It is mostly applied as fertilizers due to the availability of nutrients like nitrogen, phosphate and potassium (Sogn et al., 2018). Before applied as fertilizers, digestate is mostly stored in uncovered tanks for 180 days. This result in the emission of GHG gases such as CO2, N2O and CH4 which affect the environment.
Sambusiti et al., (2015) suggested that, due to different seasons in farming and the increasing number of biogas plants in certain areas, digestate in the long term will be stored for a longer period which will exacerabate its effect on the environment. Such acts have prompted some European countries to store digestate in covered tanks resulting in an advantage of capturing methane (Menardo et al., 2011). Some authors stated that resulting digestate have the potential of methane yield (Balsari et al., 2009: Kaparaju and Rintala, 2003). The former is known to first identify the methane yield in digestate through recirculation whilst the latter through digestate methanation suggested a 15% increase in methane yield. Though methane yield has been investigated by the researchers, the amount of methane that could be recouped from digestate also depends on the organic matter content (Sambusiti et al., 2015). Digestate is known to have higer ammonia but decreased carbon and organic matter content and low
14
biodegradability, the carbon to nitrogen ratio (C/N) is smaller with high pH (Möller & Müller, 2012). To improve this barrier and enhance biogas production most research have focused on pre and post treatment (Sambusiti et al., 2015 ; Lindner et al., 2015; Menardo, et al, 2011). A study by Solé-Bundó et al., (2017) compared digestates of different origin and stated that, the organic matter of digestate is lower (<40%), these values differ due to the type of substrate and operating conditions of reactors. The study also found low C/N ratio (around 3) and hence co -digestion with carbon rich substrates will increase the carbon content and methane yield. It will be irrelevant to investigate methane yield from digestate which has less methane potential or exhausted (Menardo, et al,). These authors in a batch study on the methane yield of different digestate from anaerobic digestion plants suggested a heterogeneous methane yield between 2.88 and 37.63 NL/kgVS. The study concluded that methane yield was highly influenced by OLR, hydraulic retention time and stock quality. A 70 NmL CH4/g VS and 90 NmL CH4/g VS,
methane yield was discovered on post- treatments of agriculture digestate (Sambusiti et al., 2015). However, the use of chemical like alkaline treatment causes inhibition in AD process and its cost is an impediment to full- scale biogas plants (Lindner et al., 2015). The physical and chemical compositions (TS, VS, pH and ammonia ) of digestate from different plants investigated by (Menardo, et al.,2011) is shown in table 1.
Table 1. Chemical and physical parameters of digestate samples from four CSTR biogas plants Sample (Digestate) Initial pH Final pH Initial TS(%) Final TS Initial VS Final VS Initial Ammonia Final Ammonia A 7.9 8.0 9.6 8.2 77.0 67.5 2.0 2.6 B 7.8 7.9 5.4 4.9 74.1 69.2 3.0 3.5 C 8.0 8.2 3.7 3.5 67.4 64.0 8.1 9.1 D 8.1 8.2 1.7 1.6 62.1 62.1 8.7 8.9
Sample A and C, slaughter waste, tomato skins and glycerol as substrates. Sample B, straw and cut maize. Sample D, swine effluents (Menardo, et al, 2011).
2.6 Anaerobic Co-Digestion (AcoD)
Producing energy from AD is predicted to be a sustainable and renewable energy for the future, however, there has been some hindrances in the use of mono substrates for digestion. Low organic loads, high concentrations of heavy metals, high and lack of nitrogen characterized in certain substrates can result in methanogenic inhibition and also system failures, (Mata-Alvarez
et al., 2014). Anaerobic Co-digestion, which is a mixture of two or more substrates have proven
to resolve the difficulties associated with AD of mono substrates. Studies on AcoD have shown significant improvement in biodegradability, synergetic effects, nutrient balance, system
15
stabilization and above all enhance biogas production both in large scale plants and laboratory works (Hagos et al., 2017). An imperative factor to consider in AD is the (C/N) ratio, as an imbalance in the ratio can cause system failure, through AcoD an optimal C:N ratio can be achieved (Nordlander et al., 2017). Co-digestion has improved the biogas production of lignocellulosic waste (Mata-Alvarez et al., 2014). Though AcoD is a promising technology and brings several advantages, special considerations should be focused on the type of substrate and the proximity in obtaining the different substrates to reduce shipping costs (Mata-Alvarez
et al.,2014).
2.6.1 Anaerobic Co-Digestion of Glycerol
The growing concerns of GHG emissions have brought about alternative energy sources such as biogas and biodiesel. Biodiesel which is produced through transesterification of vegetable oil produces a by-product in the form of glycerol (Viana et al.,2011). Approximately, 10kg of glycerol is generated from every 100kg of biodiesel produced (Santibáñez, et al., 2011). This implies a huge chunk of glycerol is generated as waste from the biodiesel industry especially relating to the increase amount of the industry. Countries like Brazil have increased its volume of biodiesel, whilst the European Union has about 5.75% increase in biodiesel production, (Viana et al., 2012). The growing market has brought about an environmental concern in managing large amounts of impure glycerol produced as it is considered to generate surplus in future (Santibáñez, et al., 2011). Glycerol is highly biodegradable and contains considerable amount of carbon, making it a good co-substrate for anaerobic digestion, (Silva, et al., 2018). Though there are new technologies in utilizing glycerol, anaerobic digestion is economically feasible and offers significant advantages (Viana et al.,2011). The refining processes involved in purifying crude glycerol for use in food, cosmetic and pharmaceutical industries is considered to be expensive, Kolesárová et al., (2011), the resulting digestate from AD of glycerol is very stable making it a good source of fertilizer. Due to its high carbon content, studies have shown that, co-digestion of glycerol with recalcitrants substrates have enhanced biodegradbility resulting in improvement in biogas production (Santibáñez, et al., 2011). The use of both pure and crude glycerol in anaerobic digestion have been studied as both primary and co- substrate ((Siles et al., 2010: Nghiem et al., 2014). Study on the use of different types of glycerol in AD suggested that, the use of any type of glycerol is a good co- substrate since the CH4 yield were comparable among the substrates. Nghiem et al., (2014) conducted a study
16
the level of impurities, crude and pure glycerol have a similar COD content of approximately 1 kg/L. In using glycerol addition of (0.25% and 0.5%, v/v) their study concluded that, the addition of 0.5%(v/v) of glycerol resulted in a higher production than the addition of 0.25%. Again, a higher methane yield was produced from pure glycerol during the first ten days of the test but the specific methane production at the end of the experiment (30 days) were identical approximately 0.67 m3/L glycerol between both pure and crude glycerol. Siles et al., (2010) using organic loading rate of 0.27–0.36 g COD/g VSS d in anaerobic co-digestion, concluded that both crude and pure glycerol is 100% biodegradable. Various works on AD of glycerol have emerged that small amount of glycerol enhances biogas production, implying that glycerol can be applied advantageously (Viana et al.,2011). However, there are no clear specifications of the amount to be applied (Beschkov, et al., 2017). Different proportions have been studied by various authors and have efficiently increased the amount of methane yield, however, it was suggested by (Santibáñez, et al., 2011) that large loading of glycerol can hinder AD process such as high acetic concentrations. They further suggested loading rate of glycerol should be increased gradually. Co-digestion of glycerol with municipal solid waste, sewage sludge, slaughterhouse wastewater and maize silage have been evaluated by several authors, Fountoulakis et al., (2010) in using a temperature of 35oC reported, a 1% (v/v) addition of
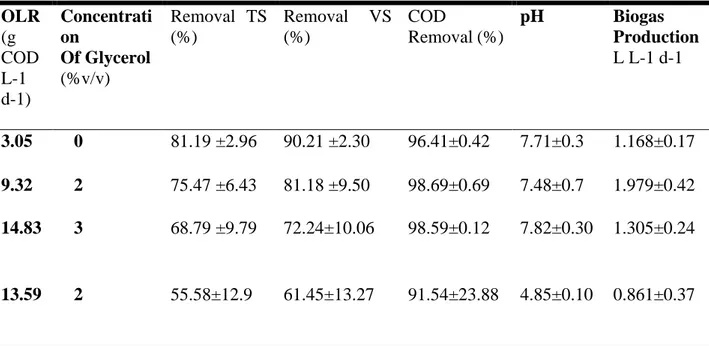
glycerol with sewage sludge boosted biogas yield. The control reactor with only sewage sludge produced 1106 ± 36 ml CH4/d, whilst the addition of glycerol enhanced methane yield to 2353 ± 94 ml CH4/d. They concluded further increase of glycerol above 1% results in imbalance of the AD process. Sulaiman et al., (2009) studied co-digestion of palm oil mill effluent with refined glycerin. 1% (v/v) addition of glycerol showed both COD removal efficiency and methane yield at 90% and 505 m3 day−1, respectively. An increase percentage of 5.25% showed high COD removal efficiency but less methane yield of 307 m3 day−1. In the experiment most of methane production from glycerol appeared within the first 7-8 days due to the readily biodegradability of glycerol. Work on co-digestion of crude glycerin with cassava waste water was done by Larsen, et al., (2013), their results indicated, the addition of 2% and 3 % of glycerol showed high COD removal between the range of 91.54 to 98.69% for OLR of 3.05; 9.32 and 14.83 g L-1 d-1. There were also average removal efficiencies of TS and VS averaging 81.19 to 55.58% for TS and 90.21 to 61.45% for VS. The addition of 2% glycerol showed high product of biogas compared to 3% addition. Though the use of glycerol has been a good substrate for AD, its high biodegradability can cause accumulation of VFAs and drop in pH due to inhibition (Viana et al.,2011). Inhibition can affect AD process by causing decrease in
17
methane yield or failure in the process. Alternatives to overcome these barriers include addition of alkaline or the removal of acid intermediates. However the most efficient way is to use small amount of glycerol and gradually increase the OLR (Beschkov, et al., 2017). An essential nutrient in AD process is Nitrogen, however, glycerol lacks this nutrient and hence co-digestion with nitrogen rich substrates is important. The addition of Nitrogen also helps to stabilize pH especially from highly degradable substrates (Bouallagui et al., 2005). Different concentrations of glycerol used in Larsen et al., (2013) study with OLR, TS, VS, COD and pH are presented in table 2.
Table 2. Concentrations of Glycerol added to cassava wastewater with OLR, TS and VS removal, pH and biogas production.
OLR (g COD L-1 d-1) Concentrati on Of Glycerol (%v/v) Removal TS (%) Removal VS (%) COD Removal (%) pH Biogas Production L L-1 d-1 3.05 0 81.19 ±2.96 90.21 ±2.30 96.41±0.42 7.71±0.3 1.168±0.17 9.32 2 75.47 ±6.43 81.18 ±9.50 98.69±0.69 7.48±0.7 1.979±0.42 14.83 3 68.79 ±9.79 72.24±10.06 98.59±0.12 7.82±0.30 1.305±0.24 13.59 2 55.58±12.9 61.45±13.27 91.54±23.88 4.85±0.10 0.861±0.37
(C. Larsen et al., 2013) : anaerobic co-digestion of crude glycerin and starch industry effluent The initial COD and pH of the crude glycerol used in their study was 1,900g O2 L-1 and 8.77 respectively.
18 3.0. Material and Methods
3.1. Experimental Setup
3.1.1 Feedstock
Effluents from an anaerobic stirred tank reactor (CSTR) digesting (vinasse, straw and filtercake) was used as substrate. Vinasse, Straw and Filter cake were obtained from sugarcane industry and ethanol distillery from Brazil and were then transported to Sweden. A synthetic glycerol was used (98% pure, C3H8O3). During the experiment, crude glycerol could not be
obtained from an industry and avoiding the effects of impurities from an industrial glycerol led to the choice of using a synthetic one. It was observed from literature that, despite crude glycerol having higher levels of impurity ( such as salts, fatty acids and soap) both pure and crude glycerol showed similar range of biogas potentials (Nghiem et al., 2014), implying marginal effects of impurities of AD of glycerol.
3.1.2 Inoculum
An inoculum was taken from an anaerobic digester treating effluents from primary and secondary treatment stages at Nykvarn wastewater treatment plant in Linkoping, Sweden. The digester from which the inoculum was collected operated at 38oC with an OLR of ca 2kg
VS/m3d, HRT of 20 days and reactor volume of 6000m3. 3.1.3. CH4 Potential of Digestate and Glycerol
The BMP test was conducted to measure the methane yield of digestate, glycerol and inoculum (Fig.1). The test was analyzed according to methods reported by (Ekstrand et al., 2013). The BMP test was done under controlled conditions in a 330 ml bottle sealed with rubber stopper. The experiment was constructed in triplicate for each treatment. Each bottle was filled with 20 ml of inoculum which contained 3,7gTS/L, 69gVS/L and 66.3g/LCOD and substrate in a ratio of 2:1(inoculum: substrate) on the basis of COD concentration. Water was added up to a 100ml total volume. The batch assays were marked based on the proportion of glycerol and digestate in the substrate as G (100 % of gCOD glycerol), D (100% of gCOD digestate), 15G-D (15% of gCOD glycerol and 85% of gCOD digestate), and 25G-D (25% of gCOD glycerol and 75% of gCOD digestate). Three control bottles were set up only with inoculum (marked as I). The head space in each bottle was 230mL. Before filling with inoculum and substrates, each bottle was flushed with Nitrogen (N2) to minimize oxygen exposure. The bottles were then placed in
19
a water bath with temperature maintained at 37oC. To ensure homogenous solution, the bottles
were stirred manually once a every day.
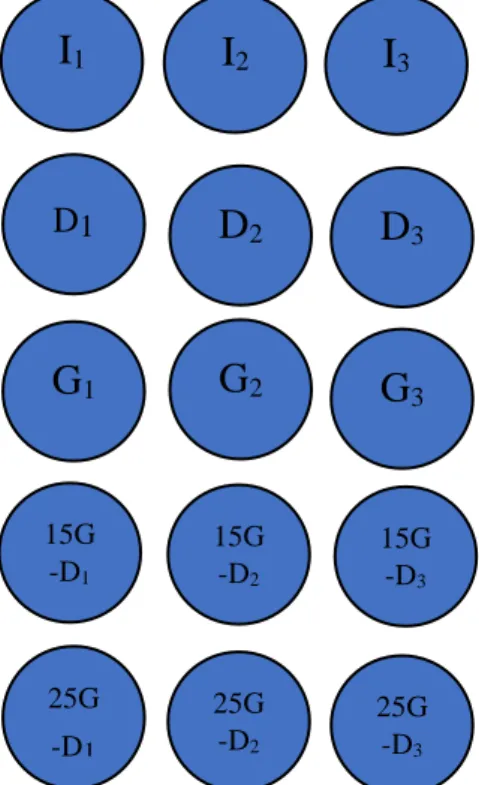
Figure 2 shows the batch test set up. Whilst table 3 shows the OLR.
Figure 2. BMP setup, I1, I2, I3 inoculum: D1, D2, D3 digestate: G1, G2, G3, 100% glycerol:
15G-D1, 15G-D2, 15G-D3: 15%glycerol+digestate, 25G-D1, 25G-D2, 25G-D3
25%glycerol+digestate
Table 3. The volume of organic load used in the batch test, including percentages of glycerol added.
Treatment Inoculum (CODg/L) Glycerol (CODg/L) Digestate (CODg/L)
Glycerol 20 0.62 - 15%G-D 20 0.09 12.6 25%G-D 20 0.15 11.1 Digestate 20 - 14.8 Inoculum 20 - -
I
2I
1I
3 D1G
1 15G -D1 25G -D1D
2G
2G
3 15G -D3 25G -D3D
3 15G -D2 25G -D220 3.3 Analytical measurements
3.3.1 TS and VS
The TS and VS for the inoculum and all treatments were measured according to the standard methods (APHA, 2012). Each test was done in duplicate. This was done by marking six crucibles with pencils and weighed. The crucibles were then filled with the samples and weighed again. To obtain the TS each sample was placed in a 105oC oven for 20hrs. The crucibles were then taken out of the oven and put in a desiccator to cool down after which they were weighed and taken to the muffled oven and heated at a temperature of 550oC for two hours. They were then brought back to the desiccator to cool down and weighed after. The TS and VS were then calculated by the equations below
𝑇𝑆 (%) =𝑑𝑟y weight 𝑎𝑡 105℃ ×100 Equation 1 Wet 𝑤𝑒𝑖𝑔ℎ𝑡
𝑉𝑆 (% 𝑜𝑓 𝑇𝑆) = (Dry 𝑊𝑒𝑖𝑔ℎ𝑡 𝑎𝑡 105 ℃ −(𝑤𝑒𝑖𝑔ℎ𝑡 after 𝑐𝑜𝑚𝑏𝑢𝑠𝑡ion 𝑎𝑡 550℃) ×100 Equation2 Dry 𝑤𝑒𝑖𝑔ℎt 𝑎𝑡 105 ℃
3.3.2 COD
Chemical Oxygen Demand (COD) analyses were performed before and after the batch test. All analyses were done in duplicate to each treatment. This was done by using 1000-10000 mg/L O2 COD kit- LCK014 from (Hach- Lange, Germany). The analyses were done according to the
manufacturer’s instructions by first inverting the kit a few times to allow for sediment suspension. Samples were pipetted into the cuvette. It was then closed and inverted again. The cuvette was then heated in a thermostat for 2 hours after which it was taken out and inverted twice and allowed to cool at room temperature. The COD was then evaluated in a spectrophotometer. The values of the COD recorded were then multiplied by their dilution factor.
3.3.3 pH analysis
The pH of the samples in the bottles, thus the substrates and the inoculum solution were determined according (NS-EN 12176, 1998) by using pH meter (WTW inoLab pH 7310, Germany). For a verified result, each measurement was done three times. This was done before and after the BMP test.
21 3.4 Biogas and Methane Measurement
The pressure for each bottle was measured once a day within the first three days and was subsequently measured once a week. The pressure was measured by a pressure meter (Testo Inc., USA). To measure the overpressure, a needle attached to the pressure meter was inverted into the lid of each batch bottle and the pressure displayed on the meter was recorded in mbar. The pressure gauge was then calibrated after each measurement against the atmospheric pressure after each measurement. Determination of total biogas was done by converting the pressure to atmospheric pressure. The correction of this volume was done by multiplying the headspace volume with the atmospheric pressure to achieve the total gas volume in the headspace. The gas volumes were normalized to 1 atm pressure and 273 K and presented as (NmL) using the ideal gas law.
𝑉𝑆𝑇𝑃 =𝑃𝑔𝑎𝑠 𝑃𝑠𝑡𝑝×
Tstp
𝑇𝑔𝑎𝑠 𝑬𝒒𝒖𝒂𝒕𝒊𝒐𝒏 𝟑
To determine the methane content, gas samples were collected from each batch bottle in syringes and transferred to a bottle with volume of 31ml. The methane analysis of the headspace was done by transferring gas from the 31ml bottle to Hewlett Packard HP HP5880A GC Gas chromatograph (GC-FID). Three standards with methane contents of 0.07 %, 0.63 % and 1.71% were injected into the GC-FID and calibration was done by linear regression.
3.4.1 Methane Yield
The net volume of CH4 yield was achieved by subtracting the methane volume of the
inoculum from the CH4 volume of each treatment. This was done to know the volume of CH4
produced from substrate added to each bottle.
Net CH4 (mL) = CH4 of treatment – CH4 of Inoculum. Equation 4
The total methane yield of each treatment was determined by dividing the net accumulated CH4 yield of each treatment by COD of substrate added to each bottle.
Accumulated CH4 yield = Net Accumulated CH4 (mL) Equation 5 (gCOD of substrate/L) x Active Volume in the bottle
The modified Gompertz model was used to determine the methane potential, maximum methane production rate and lag phase.
22 𝑀 = 𝑃 × exp (−exp (𝑅𝑚 × 𝑒 × (𝐿 − 𝑡)
p + 1)) 𝑬𝒒𝒖𝒂𝒕𝒊𝒐𝒏 𝟔
Where M is the total CH4 yield (NmLCH4/gCOD), P is the methane potential
(NmLCH4/gCOD), Rm is the maximum methane production rate (NmL/d), L is the lag phase
(d) and t is the time at which the corresponding CH4 yield is recorded. Parameters, M, Rm,
and L were determined by fitting the Gompertz equation to the accumulated CH4 yield curves by non-linear using SPSS softwate (IBM, USA).
The theoretical methane yield for glycerol converted to methane was calculated from the Buswell equation and the ideal gas law according to (Viana et al.,2011) and is given in appendix 2
C3H5(OH)3 1.75CH4 + 1.25CO2+ 0.5H2O Equation 7
Gas Law: PV = nRT Equation 8
Where P is the normal atmospheric pressure (101300 pa), V is the volume of gas (L), n is the number of moles, R is the gas constant 8.314J(mol K) , and T is the temperature in K (310 K corresponds to 370C).
3.6 Reactors Operation
Two lab scale continuous stirred- tank (CSTR) reactors (R1 and R2) with 5 L volume were used in this experiment. At the start up, the reactors were inoculated with sludge from Nykvarn wastewater treatment plant in Sweden. The study employed mesophilic digestion at 37°C and continuously stirred at 100 rpm. The experiment was carried out for 94 consecutive days. The digestate used as feed stock was collected every day from two anaerobic reactors performing co-digestion of vinasse, straw and filtercake. The reactors were continuously fed manually with 250ml of digestate and after 30 days of HRT, R1 was fed with different mixtures of digestate and glycerol and the control reactor R2 was fed with only digestate. The organic loading rate (table 4) of the feed stock changed over time due to changes in OLR of the digestate source. The reactor (R1) that served as co digestion was supplemented with increasing concentrations of glycerol at 15%, 25%, 50% of the OLR of the reactor. 15% addition was added on the 30th
day, whilst 25% and 50% on day 60 and 85, respectively. For comparable results to know the extra methane and biogas produced from glycerol, the total volume of gas from the control reactor R2 was subtracted from R1 as shown in section 4.4
23 Table 4 OLR of digestate and glycerol in reactors
Glycerol Concentration (%) Day Digestate (gCOD/Ld) Glycerol (gCOD/Ld) 15 30- 45 0.32 0.20 15 46-59 0.35 0.30 25 60-70 0.87 0.44 25 71-84 0.92 0.55 50 85-95 1.84 0.95 3.6.1 Reactor Monitoring
The reactors and digestion performance were continuously monitored through measurements in TS, VS, pH, COD and VFAs according to the methods described in previous sections. During the first half of the experiment pH was measured daily and was done once a week when constant values were reached. TS, VS and VFAs were performed once a week, whilst COD analysis were done once in every two weeks. Gas production and biogas compositions (CH4,
CO2, O2, H2) from R1 were recorded daily from a gas meter attached to the reactor whilst for
R2 biogas compositions (CH4, CO2, O2, H2) were measured with BIOGAS 5000 (Scantec
Nordic) once a week. All gas measurements were corrected to standard temperature and pressure (273.15 K and 101.325 kPa). Whilst methane yield was calculated by multiplying the biogas production by the methane concentrations and dividing by the COD of the substrate presented in (Nml/gCOD).
The collected data were analyzed in Excel and graphs presented with Origin 2017 program. 4.0 RESULTS AND DISCUSSION
4.1 Batch Experiment
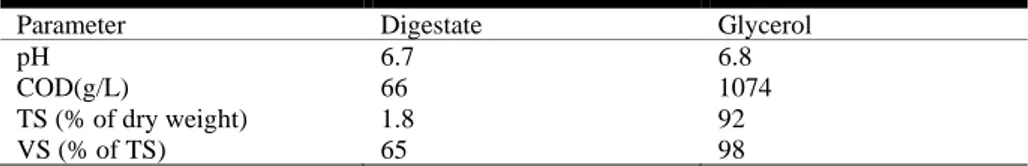
4.1.1 Composition of Digestate and Glycerol
Tables 5 shows the physical and chemical compositions of digestate and glycerol used in the batch test. The digestate used in this experiment had TS contents of 65% with low organic matter (COD of 66.29g/L) compared to the COD of the glycerol (1074 g COD/L) used and as stated in literature, digestate have low carbon and organic matter with considerable amounts of nitrogen (Möller & Müller, 2012), hence the exceeding amounts of glycerol at percentages of (5% and 25% gCOD/L) of the effluents were used to improve organic content to enhance biogas production. The COD values of the glycerol was in line with the results from previous works (Nghiem et al., 2014: Larsen et al., 2013) reported high values in COD for glycerol with the former obtaining 1900g COD/L whilst the latter reported 1050 g COD/L. The pH of
24
6.7 of the digestate was within the optimum pH range in an anaerobic digester, 6.5-8.0 (Cioabla,
et al., 2012) whilst the pH of the glycerol was 6.8. Table 5. Composition of Digestate and glycerol
Parameter Digestate Glycerol
pH 6.7 6.8
COD(g/L) 66 1074
TS (% of dry weight) 1.8 92
VS (% of TS) 65 98
4.2 Biogas and Methane yield
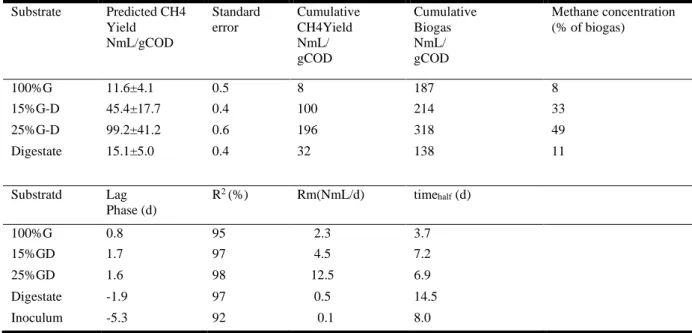
The cumulative methane yield per unit mass of COD (NmL/gCOD) and biogas production from co- digestion of different concentrations of glycerol and digestate, are presented in (Figure 3 and Table 6). The goodness- of- the fit for the modified Gompertz models R2 ranged from
0.92-0.98 showing a reasonable accuracy of fitted models. The estimated lag phase (L) values were between 0.8 and 1.7 for the highly degradable treatments (100%G, 15%G-D and 25%(G-D). The longer lag phases were evident in the inoculum and digestate 5.3 and 1.9d. compared to treatments with glycerol 0.8 – 1.7d. Both digestate and inoculum had low maximum CH4
production rates of 0.5 and 0.1 NmL/d, respectively, due to their less biodegradability, while the highest maximum CH4 production rate of 12.5ml/gCOD was observed for 25G-D. In assays
with 100% Glycerol as the substrate, methane production initiated at the early stages with lag phase of 0.8d, but stopped after the 8th day of the experiment. Santibáñez, et al., (2011) suggested high concentrations and quick digestion of glycerol will cause VFA accumulation due to organic overloading, leading to acidification and decrease in methane yield. In all treatments, most of the methane production were observed within the first 8 days of the batch test. Treatments with glycerol had the shortest time in reaching half of its methane potential of 3.7, 6.9 and 7.2d for 100%G-D, 15%G-D and 25%G-D respectively, compared to treatment with only digestate (14.5d). This shows the quick adaptation of microorganisms to glycerol addition which improved methanogenesis rate (Sulaiman et al., 2009).
25
Table 6. Overview of biogas production, methane concentrations, methane yield, lag phase and R2 values Substrate Predicted CH4 Yield NmL/gCOD Standard error Cumulative CH4Yield NmL/ gCOD Cumulative Biogas NmL/ gCOD Methane concentration (% of biogas) 100%G 11.6±4.1 0.5 8 187 8 15%G-D 45.4±17.7 0.4 100 214 33 25%G-D 99.2±41.2 0.6 196 318 49 Digestate 15.1±5.0 0.4 32 138 11 Substratd Lag Phase (d) R2 (%) Rm(NmL/d) time half (d) 100%G 0.8 95 2.3 3.7 15%GD 1.7 97 4.5 7.2 25%GD 1.6 98 12.5 6.9 Digestate -1.9 97 0.5 14.5 Inoculum -5.3 92 0.1 8.0
Figure 3. shows Cumulative CH4 and biogas yield (NmL/gCOD) of 100% G, 15%G-D, 25%, digestate and inoculum at standard conditions (273. K, 1 atm) mean of triplicates with SD over time (days)
In general, the highest methane and biogas yield (196 Nml/gCOD and 318 Nml/gCOD), respectively was obtained from the addition of a mixture of 25% glycerol and 75% digestate on gCOD basis corresponding to methane concentration of (59%). Whilst 15% G-D gave rise to yields of (100 Nml/gCOD, and 214 Nml/gCOD) with CH4 concentration of 52%. It can be
26
elucidated from the batch test results that, the addition of both 15% and 25% of glycerol enhanced methane and biogas yield of digestate. This result agrees with literature by several authors, (Nghiem et al., 2014: Fountoulakis et al., 2010: Amon et al., 2006: Astals et al., 2010). Astals et al., (2011) reported an increase in methane production in a batch test when pig manure was co- digested with glycerol. Treatments with pig manure and glycerol with boosted methane yield by (215 mL CH4/g COD) which was about 125% more than when pig manure was mono-digested (96 mL CH4/g COD). Amon et al., 2006 also reported methane increase from 569 to 679 CH4 g/VS) and biogas. The batch test from this study also saw a considerable amount of
CH4 and biogas production from the digestate (32Nml/gCOD and 138 mL/gCOD). The
methane production from glycerol was obtained by subtracting the volume from produced by digestate from treatments with glycerol addition (15 and 25%). Hence the resulting methane and biogas from glycerol with 15% addition was (68 Nml/gCOD and 76 Nml/gCOD) whilst 25% had volumes of (164 Nml/gCOD and 180 Nml/gCOD).
4.2.1 COD and VS Removal
The initial pH, COD, TS/VS and VS reduction are presented in table a 7. Treatments with 15% and 25% showed a stable pH from the initial and final stages of the test, implying the supplementation of glycerol is good for co- digestion as it did not cause any inhibition that could have resulted in VFA accumulation leading to a drop in pH. However, in this study, treatment with only glycerol (100%) with an OLR of 0.6 gCOD/L resulted in formation of acids after the experiment (pH=5.32) which indicate the amount of glycerol used resulted in an organic overload and inhibition of methanogenesis, which has also been observed in other AD systems with high loads of glycerol (Nghiem et al., 2014 : Nuchdang & Phalakornkule, 2012). In an anaerobic co-digestion of glycerol and pig manure, by Nuchdang & Phalakornkule, (2012) at higher OLR of 5.4 g COD/L of glycerol the propionic acid to acetic acid ratio was found to be higher than the threshold for metabolic imbalance. Viana et
al.,(2011), suggested the COD range of glycerol (925 and 1600g/L) is a hindrance to using
only glycerol as substrate in AD. They further suggest, dilution of glycerol with water will be a solution to this problem. The highest pH was observed in the digestate in both initial and final stages of the test (8.11 and 8.14). These results are comparable with studies on digestate by Menardo, et al.,(2011) and Möller and Müller, (2012). The authors presented initial and final pH of digestate (8.1 and 8.2) and stated that, digestate have high pH levels. From table 7 it was observed that, all treatments showed satisfactory amounts of COD removal ranging between
27
81.7% and 88.7%. However, treatment supplemented with 15% and 25% addition of glycerol showed the highest efficiencies in COD removal (85.2% -88.7%) and VS reduction of (81.7%-88.7%). This result was not surprising as these treatments had the highest efficiency in consuming organic matter and producing the highest amount of methane. This observation was in line with Sulaiman et al., (2009) and Larsen et al., (2013) whose studies presented a COD removal of 90% with glycerol addition. They related the high COD removal to the high biodegradability of glycerol which is easily utilized by microorganisms.
Table 7. Initial and final pH values, TS, Vs, COD removal (%) and Vs reduction (%)
Initial Values Substrate pH TS VS COD
Glycerol 8.1±0.2 3.7±0.2 72±2.9 96.5±0.4
15%G-D 7.9±0.1 1.9±0.4 69±2.3 60.9±4.2
25%G-D 8.0±0.1 2.7±2.1 69±2.6 63.6±2.8
Digestate 8.0±0.2 1.8±0.6 66±2.6 57.1±2.1
Inoculum 8.1±0.02 3.7±4.7 69±2.4 66.3±2.5
Final Values pH TS VS COD
Glycerol 5.3±0.3 nd nd 17.7±4.0 15%G-D 7.7±0.04 0.7±0.1 60±0.5 9.0±0.2 25%G-D 7.7±0.1 0.5±0.2 59±3.3 7.2±4.5 Digestate 7.9±0.1 0.7±0.02 61±0.9 9.2±0.5 Inoculum 8.1±0.01 1.6±0.1 61±0.2 nd COD removal (%) VS reduction (%) Glycerol 81.7 nd 15%G-D 85.2 68.0±2.5 25%G-D 88.7 84.1±2.1 Digestate 83.4 64.1±2.8 Inoculum nd 61.8±3.1 nd= not determined 4.3 Reactors performance
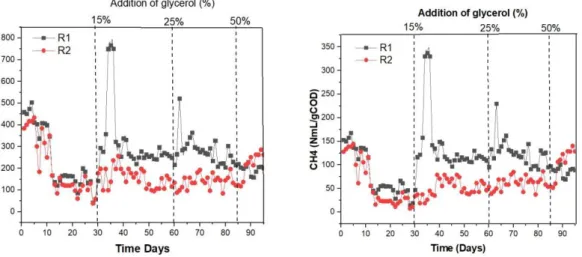
The reactor performance in terms of biogas and methane production at normalized conditions are shown in fig 4. There were considerable amounts of CH4 production yield of
150NmL/gCOD at the initial stages. The reason was due to the high organic matter of the inoculum source and was evident in the initial COD of both R1 and R2 (13.3and 18.4g/L, respectively). After the acclimation period of 30 days, the co- digestion with glycerol was divided into three stages. In the first stage, addition of glycerol as 15% of influent COD (0.2 – 0.3 gCOD/L.d; Table 4) to R1 resulted in the highest increase in methane and biogas production (340 and 760 Nml/gCOD Table 4) almost 300% higher than the control between operational days of 30 and 40. In the second stage, increase in glycerol to 25% of influent COD corresponding to an OLR of (0.44 – 0.55 gCOD/L; Table 4) with methane and biogas production of 220 and 500 Nml/gCOD approximately 170% higher than the control reactor between operational days of 60- 70. The percentage increase in biogas production was higher
28
than a previous work by Nghiem et al., (2014) on co- digestion of sewage sludge with 0.63% and 3% (v/v) addition of glycerol. In their study, the highest methane yield (80%) higher than the control reactor was observed in the high concentration of glycerol (3%) whilst the lowest (50%) was observed in low concentration (0.63%).
Fig. 4. Methane and biogas yield for R1and R2 (NmL/gCOD) with glycerol addition
In the last stage, a further increase in glycerol concentration of 50% (0.95 gCOD/L; Table 4) exhibited a decline in methane production 75 NmL/gCOD of approximately 50% decrease. This was a consequence of the further increase in glycerol resulting to high OLR and the availability of increase amount in biodegradable organic matter. Studies on co -digestion of glycerol with other substrates posits that, further increase in glycerol concentration results in decrease in biogas production (Astals et al., 2010: Fountoulakis et al., 2010: Nghiem et al., 2014 : Sulaiman et al., 2009). A decrease in biogas production in an anaerobic co- digestion of palm oil mill effluent with glycerol was due to an organic overload as posited by Sulaiman et
al., (2009). In their study an increase in glycerol addition from 5.0 to 5.25% (v/v) caused a
further reduction of biogas by 47%. They explained this to the limited amount and less survival of protozoa and methanogenic archea after been exposed to high OLR. In this study, an increase in OLR from 0.2 to 0.95 gCOD/Ld for digestate and glycerol ,respectively, during co-digestion led to a decrease in biogas production. The decrease in biogas production in proportion to the increase in OLR was also suggested by Astals et al., (2011) as glycerol being high biodegradable, high amount of organic matter at high OLR results in accumulation of VFAs and reactor acidification resulting to low methane production. However, both reactors in this study showed no VFA accumulation. This reason could be explained in two folds, firstly the 15% and 25% of influent COD addition did not cause an organic overload hence resulting
29
in no VFAs accumulation thereby leading to a stable process. Another reason could be that further addition of glycerol 50% at OLR of 0.95 gCOD/L which caused a decrease in biogas production did not stimulate additional fermentation of solids. The optimization of sludge
fermentation for VFAs production was studied by Sultan and Andrew, (2019). In their study,
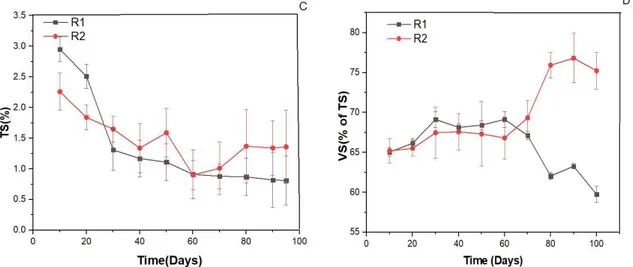
glycerol co-fermentation with primary solids showed that, glycerol increased VFAs production because glycerol addition stimulated further fermentation of primary solids. The pH was stable except for the latter parts of the experiment which saw a drop in pH from 7.04 to 6.4 (Fig.5A) during the addition of 50% concentration of glycerol. Measurements of VFAs could not be performed in the later stage of operation due to practical limitations at the laboratory. Therefore, it can be assumed, the sustained high loading of glycerol led to VFA accumulation and a substantial drop in pH (6.4) which resulted in a decrease in methane production. Again,fermentative utilization of glycerol results to products such as 1,3- Propanediol and 1,2 Propanediol (Clomburg & Gonzalez, 2013). These products were not monitored during the experiment, hence accumulation of these products might have led to an unstable process.
30
Fig. 5. Parameters monitored during the continuous experiment for R1 and R2. (B) pH value; (C) COD; (D) total solids and (E) volatile solids with SD
There appears to be a decrease methane production when the reactors were continuously fed at both 15% and 25% glycerol , indicating the microbial consortium easily adjusted and digested glycerol addition at the early stages and converted them into biogas. (Astals, et al.,2011). Again, the reason could also relate to the changes increase in OLR during feeding. Clomburg & Gonzalez, (2013) suggest glycerol requires numerous microorganisms to utilize the available reduced carbons required to enhance yield in anaerobic fermentation, however, the number of microorganisms required during fermentation of glycerol is limited in the absence of external electron acceptors. Therefore, it could be explained that, further feeding (increase OLR) with glycerol did not have enough microorganisms for its utilization. This could result in undigested glycerol causing reduction in methane production. Though these factors could be the primary reasons to the deccrease in mehane production. It should also be noted that, in the course of the experiment there was a problem with R1 which led to fluctuations in gas production and low concentrations of CH4. For instance, some operational days recorded methane concentration as
low as 9 and 13 percent. The addition of glycerol concentrations augmented VS and COD of R1 compared to R2. This may be explained due to the high organic matter and COD content of glycerol which resulted in high efficiency of biogas production. This increase was evident between operational days of 30 and 65 (fig 5 B and D) with corresponding methane increase occuring in day 30 to 60 (fig 4 A).
31
Table 8. Comparison of experimental and theoretical methane in R1
Parameters 15% glycerol 25% glycerol % Theoretical Experimental Methane production (Nml/gCOD) 340 220 67 Theoretical methane production (ml/gCOD) 508 663 33 Operational days 30-45 60-70
In using the OLR of glycerol fed to the reactor, the theoretical methane production in R1 based on the Buswell formula and the ideal gas law was estimated at an average of 508 and 663 (ml/gCOD) of CH4 between operational days of 30-45 and 60-70 respectively. According to
literature, the amount of methane yielded theoretically should be higher than the actual methane yield, because not all substrate in the digester will be degraded and also used for cell growth, (Esposito et al., 2012). The fluctuations in methane and gas productions during operational days could have accounted to the low (33%) of the theoretical methane production.
Fig.5. Biogas production and theoretical biogas potential from glycerol. 0 500 1000 1500 2000 2500 3000 3500 4000 4500 0 10 20 30 40 50 60 70 80 90 100 B iog as pr oduct ion fr om G ly ce rol ( m l) Time (Days)
32
The daily biogas production from glycerol was obtained by subtracting R2 (control reactor) from from R1. The reuslts were then plotted with the theoretical biogas potential of glycerol. The highest amount of biogas production from glycerol at 15% influent COD (0.2 COD/L.d) was obtained between operational days of 30-45. However a continous increase in OLR (0.3-0.95 COD/L.d) during the experiment resulted in a decrease in biogas production. This is an indication that, R2 showed the highest efficiency in biogas production at low OLR (0.2 COD/Ld. The theoretical values were higher than the experimental values and according to Schnürer and Jarvis (2018) the theoretical and experimental values are not consistent because not all materials fed to the reactors are digested.
4.4 Implementation of Co- digestion of glycerol
The idea of using glycerol in this study was because it is an easily biodegradable carbon source. As pointed out earlier, 100 kg of biodiesel production generates approximately 10 kg of glycerol, this has necessitated advancement to utilize this waste. A preliminary analysis by Viana et al.,(2011) on the use of glycerol in AD for a biogas plant showed that, 1.2GW of electricity and 4.4GW of heat could be produced from a reactor treating 25m3 of glycerol. From this study, a stable anaerobic digestion of glycerol can be achieved by increasing the OLR approximately 3 times of influent COD of glycerol by co- digestion with digestate. The glycerol added generated biogas amounts of 9519 Nml/gCOD) This is an indication that, by having a minimum input costs (without further refinery by the biodiesel industry) waste product from biodiesel (glycerol) could be reduced through AD and hence contribute to a sustainable environment. The amount of biogas generated from co-digestion of digestate with glycerol can also contribute to the energy sector, through fuel production and electrical energy.