DOCTORA L T H E S I S
Department of Environmental and Natural Resources Engineering Division of Chemical Engineering
Crystallization of
NBA-ZSM-5 from Kaolin
Wilson Aguilar-Mamani
ISSN 1402-1544ISBN 978-91-7583-902-8 (print) ISBN 978-91-7583-903-5 (pdf) Luleå University of Technology 2017
W
ilson
Aguilar-Mamani Cr
ystallization of NB
A-ZSM-5 fr
om Kaolin
Chemical Technology
Crystallization of NBA-ZSM-5 from kaolin
Wilson Aguilar-Mamani
Luleå University of Technology
Department of Civil, Environmental and Natural Resources Engineering
Division of Chemical Engineering
Printed by Luleå University of Technology, Graphic Production 2017 ISSN 1402-1544
ISBN 978-91-7583-902-8 (print) ISBN 978-91-7583-903-5 (pdf) Luleå 2017
Abstract
ZSM-5 is a zeolite with high Si/Al ratio and suitable properties for catalysis, ion exchange, adsorption and membrane applications. The main goal of this thesis work was to study the growth of ZSM-5 zeolite crystals from inexpensive natural sources of silica and alumina, as well as n-butylamine (NBA) as a low-cost structure directing agent.
First, a proper methodology to gain reliable and local compositional data on zeolite by energy dispersive spectroscopy (EDS) was developed using zeolite A samples (Paper I). The EDS method developed in the present work was found more reliable than inductively coupled plasma-sector field mass spectrometry (ICP-SFMS) data and was therefore used for the analysis of ZSM-5 samples.
Then, methods to synthesize ZSM-5 crystals from kaolin clay or diatomaceous earth, two inexpensive natural sources of silica and alumina, were developed (Paper II). In the case of kaolin, a heat treatment was used in order to form reactive amorphous metakaolinite. Subsequently, dealumination of the raw materials by acid leaching made it possible to reach appropriate Si/Al ratios and to reduce the amount of impurities. Finally, leached metakaolinite or diatomaceous earth was reacted with sodium hydroxide and NBA. The sources of aluminosilicates were found to behave differently and to lead to slightly different products with Si/Al ratios in the range 10-20. The use of leached diatomaceous earth allowed to reach higher yield of ZSM-5 crystals. However, low amounts of mordenite were inevitably formed as a by-product, which was related to the high calcium content of diatomaceous earth. Therefore, subsequent thesis work focused on studies of the nucleation and growth processes of ZSM-5 crystals using kaolin as raw material.
In this system, a gel forms upon heating of the synthesis mixture. Hence, the internal structure of the gel was first investigated carefully (Paper III). Secondly, a kinetic study was performed and compared with microstructural observations (Paper IV). Finally, the mechanisms leading to Al-zoning and dendritical growth of the zeolite crystals were investigated (Paper V). The intermediate phases during the different stages of the hydrothermal synthesis were analyzed by ICP-SFMS, dynamic light scattering (DLS),
extreme high resolution-scanning electron microscopy (XHR-SEM), EDS, high resolution-transmission electron microscopy (HR-TEM), X-ray diffraction (XRD) and nitrogen gas adsorption.
These investigations led to several important conclusions: 1) The walls of the gel were shown for the first time to be inhomogeneous and to possess a biphasic internal structure consisting of a mesoporous skeleton of aluminosilicate nanoparticles embedded in a silicate-rich soluble matrix of soft matter. 2) The kinetic study and microstructural evidences showed that the early crystals were fully embedded in the gel phase and that crystal growth was retarded by the gel. Hence, nucleation and growth appeared to be solution mediated. 3) The aluminium zoning of the crystals was related to the biphasic internal structure of the gel, since the silicate-rich matrix was preferentially consumed first. 4) The dendrites present at the surface of the crystals during most of the growth process were shown to be caused by the presence of a web of nanoparticles, most likely originating from the mesoporous skeleton inside the gel. In the future, these findings are expected to lead to optimized synthesis pathways of catalysts with homogeneous properties, which may contribute to the development of poor regions in Bolivia.
Acknowledgements
First and foremost, I praise to Lord Jesus Christ! Thanks Father God, for providing me the ability to develop successfully this work. (Colossians 3:17, KJV)
I am and will be forever grateful to my supervisor, Associate Professor Johanne Mouzon for all the help and support during my PhD studies. It was very fruitful to work closely with you. Your patience, guidance and advices were important for my development as a researcher. I would also like to thank my assistant supervisor Prof. Jonas Hedlund for always being very supportive. It is always pleasant to have discussions with you and your experience was so valuable.
I am thankful for the friendship of all of the members of Department of Civil, Environmental and Natural Resources Engineering and the Division of Chemical Engineering.
I am also very grateful to all the people I have met along the way and who have contributed to the development of my research. In particular, I would like to show my gratitude to all my friends from UMSS, UMSA and LTU. I am indebted to you for your contributions in the research and studies and for always being there when I needed you! Thank you guys!
The financial support of this work by the Swedish International Development Cooperation Agency (SIDA) is also acknowledged.
Finally, I would like to express my deepest gratitude and love to my beloved wife Mildred. Your prayers, support, understanding, encouragement and patience transformed the dark and cloudy days in beautiful shiny sunny days. ¡Te amo mi preciosa esposa y compañera de vida! Mamita Alicia gracias por tu paciencia, tu apoyo, por haberme dado la oportunidad de tener una excelente educación y sobre todo por ser mi amiga. ¡Te amo mucho! Dios bendiga siempre tu hogar junto a tu esposo Francis. También, quisiera expresarles mi agradecimiento y cariño a mi amada familia Torres-Forqueda por todo su apoyo y ayuda. ¡Los quiero y que Nuestro Señor les bendiga!
De igual forma, a mis queridas familias Valdivia y Tornberg quisiera manifestarles todo mi afecto y gratitud, han sido una bendición en mi estadía en Luleå. Mis hermanos de la Iglesia de Cristo en Luleå siempre los llevaré en el corazón, son mi deseos y oraciones que nuestro Señor Jesucristo los bendiga abundantemente.
List of Papers
The thesis is based on the following papers:
Paper I. Preparation of zeolite A with excellent optical properties from clay
Gustavo Garcia, Wilson Aguilar-Mamani, Ivan Carabante, Saúl Cabrera, Jonas Hedlund and Johanne Mouzon
Journal of Alloys and Compounds, 2015. 619: p. 771-777.
Paper II. Comparison between leached metakaolin and leached diatomaceous earth as raw materials for the synthesis of ZSM-5
Wilson Aguilar-Mamani, Gustavo García, Jonas Hedlund and Johanne Mouzon
SpringerPlus, 2014. 3(1): p. 1-10.
Paper III. Internal structure of a gel leading to NBA-ZSM-5 single crystals
Johanne Mouzon, Wilson Aguilar-Mamani and Jonas Hedlund Manuscript submitted to Journal of Porous Materials
Paper IV. Solution-mediated growth of NBA-ZSM-5 crystals retarded by gel entrapment
Wilson Aguilar-Mamani, Johanne Mouzon, Farid Akhtar and Jonas Hedlund Manuscript submitted to Journal of Crystal Growth
Paper V. Influence of the gel internal structure on Al zoning and dendritic growth of NBA-ZSM-5 crystals
Wilson Aguilar-Mamani, Johanne Mouzon, Edgar Cardenas, Ming Zhou and Jonas Hedlund
Manuscript submitted to Journal of Physical Chemistry C My contribution to the appended papers:
Paper I: Experimental work and writing regarding the EDS measurements. Paper II: Nearly all experimental work, evaluation and writing.
Paper III: Participation in planning, evaluation and writing. Nearly all experimental work.
Paper IV: Participation in planning, evaluation and writing. Nearly all experimental work.
Paper V: Participation in planning, evaluation and writing. Nearly all experimental work.
List of abbreviations
NBA n-butylamine
ZSM-5 Zeolite Socony Mobil - 5
LTA Linde Type A
TPA Tetrapropyl ammonium
TPA-Br Tetrapropyl ammonium bromide
TPA-OH Tetrapropyl ammonium hydroxide
SDA Structure directing agent
WLP Worm like-particles Al Aluminium Na Sodium Si Silicon Ca Calcium C Carbon N Nitrogen Na-P1 Zeolite P
NaOH Sodium hydroxide
EDS Energy dispersive spectroscopy
ICP-SFMS Inductively coupled plasma – sector field mass spectrometry
XRD X-ray diffraction
XHR-SEM Extreme high resolution – scanning electron microscopy
HR-TEM High resolution-transmission electron microscopy
DLS Dynamic light scattering
TG Thermogravimetry
MS Mass spectrometry
BET Brunauer–Emmett–Teller (BET) theory
CC Charge compensation
Na2SiO3 Sodium silicate
NaCl Sodium chloride
Contents
Abstract i
Acknowledgements iii
List of Papers v
List of abreviations vii
1. Introduction 1
1.1. General description of zeolites 1
1.2. Applications of zeolites 2
1.3. Zeolite synthesis 2
1.3.1. Crystallization stages 3
1.3.2. Crystallization kinetics 4
1.3.3. Crystallization systems 5
1.4. Crystallization of ZSM-5 zeolite in heterogeneous systems 6
1.4.1. Reported mechanisms 6
1.4.2. The gel phase 7
1.4.3. Morphology of the crystals and aluminium zoning 7
1.5. Zeolite synthesis from natural raw materials 8
1.5.1. Kaolin as raw material for zeolites 9
1.5.2. Diatomaceous earth-derived zeolites 10
1.6. Scope of the present work 10
2. Experimental 11
2.1. Preparation of the gel 11
2.2. Hydrothermal synthesis 11
2.3. Separation of the phases 12
2.4. Preparation of thin films by seeded growth 13
2.5. Characterization of the raw materials, intermediates and final products 14
2.5.1. ICP-SFMS 14
2.5.2. XRD 14
2.5.3. XHR-SEM 14
2.5.4. Imaging on polished cross-sections 15
2.5.5. Size distribution of the ZSM-5 crystals 15
2.5.6. EDS 16
2.5.8. Si/Al ratio on cross-sections of the final crystals 17
2.5.9. HR-TEM 17
2.5.10. DLS 17
2.5.11. TG and MS 17
2.5.12. Nitrogen adsorption 18
2.6. Determination of the nucleation rate 18
3. Results and Discussion 21
3.1. Validation of EDS as a tool for studying aluminosilicates 21
3.2. Characterization of the starting materials 24
3.3. Preparation of ZSM-5 from kaolin and diatomite 26
3.4. Aging of leached metakaolin 31
3.5. Structure of the gel 32
3.5.1. Crystallization stages with respect to gel evolution 33
3.5.2. Formation of the gel 33
3.5.3. Structure of the gel after drying 34
3.5.4. Effect of washing 36
3.6. Zeolite crystallization 39
3.6.1. Kinetic study 40
3.6.2. Microstructural study 43
3.6.3. Thermogravimetric study 46
3.6.4. Nucleation and growth mechanisms 47
3.7 Aluminium zoning 48
3.8. Dendritic growth 51
3.8.1. Asperities and interdentritic phase 51
3.8.2. Seeded growth of thin films 53
4. Conclusions 57
5. Future Works 59
References 61
1 Introduction
1.1. General description of zeolitesZeolites are hydrated crystalline aluminosilicates built of [SiO4]4- and [AlO4] 5-tetrahedra connected by oxygen atoms forming a three dimensional network. The [AlO4]5- tetrahedra result in negative charge inside the framework, which must be balanced by the presence of cations [1]. The cations are mobile, exchangeable and occupy the channels and cages of zeolites. The general structural formula of a zeolite can be expressed by equation (1):
where n is the valence of the cation M, w is the number of water molecules per unit cell,
y/x is the silica/alumina (SiO2/Al2O3) ratio of the zeolite.
Zeolites might be found in natural deposits or can be synthesized in the laboratory. Nowadays, most of the zeolites used in different fields are synthetic as they can be prepared with higher uniformity and purity compared with natural zeolites.
The International Zeolite Association (IZA) has recognized more than 200 framework topologies of zeolites, which are classified according to the framework symmetry by assigning a code of three letters. For instance, LTA is employed for Linde zeolite A, while MFI corresponds to ZSM-5 and silicalite-1 zeolites.
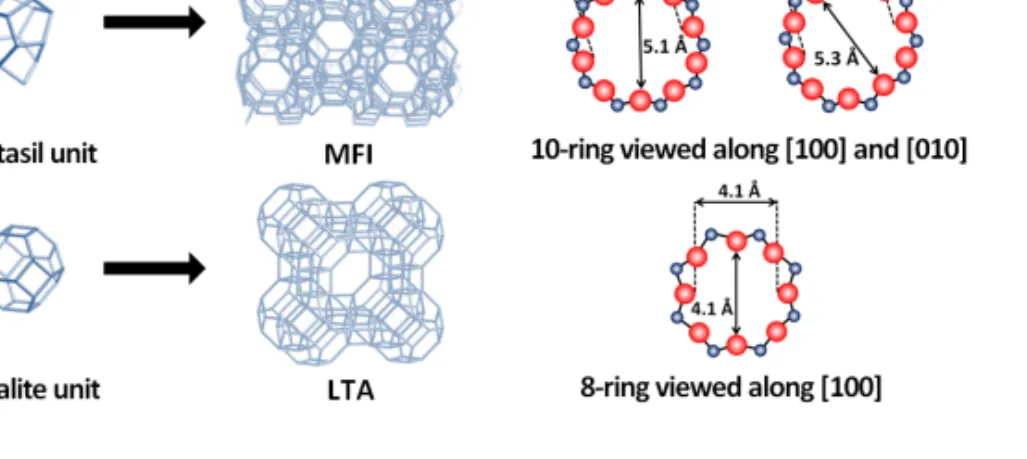
The main zeolite investigated in this work is ZSM-5 which has usually a Si/Al ratio ranging from 10 to 200. The structure of ZSM-5 is built by pentasil units and the combination of these units allow for the formation of two types of channel systems with similar size, i.e. sinusoidal channels (5.1 × 5.5 Å) and straight channels (5.3 × 5.6 Å). Zeolite A is also studied in this work. This zeolite has the Linde Type A structure (LTA) and a Si/Al ratio of 1. It consists of a three-dimensional network system which contains perpendicularly intersecting channels. This arrangement is composed of a cubic array of -cages (sodalite cages) linked by double 4-rings (D4R) units forming an
cage. The free aperture diameter of the cage is 4.1 Å. Figure 1.1 illustrates the structure of ZSM-5 and zeolite A.
Figure 1.1. Structure and micropore system with dimensions for ZSM-5 and zeolite A.
1.2. Applications of zeolites
Zeolites might act as molecular sieves due to the well-defined framework and the porous structure of these aluminosilicates. Therefore, there are three main uses for zeolites in the industry: catalysis, adsorbents and ion exchangers. In the field of catalysis for example, ZSM-5 is used as catalyst for hydrocarbon isomerization [2] and partial oxidation of alcohols [3]. A widely use of zeolites as adsorbents is in gas separation processes [4]. On the other hand, the application of zeolites as ion exchangers is mainly employed for the removal of calcium and magnesium cations from domestic and industrial water. For instance, sodium zeolite A is commonly used in detergents, by replacing the polyphosphates as water softener [5-7].
1.3. Zeolite synthesis
Zeolites are usually synthesized under hydrothermal conditions between room temperature and 300 ºC. The starting synthesis mixture is composed of sources of silicon and aluminum, in combination with a mineralizing agent (often a source of hydroxide or fluoride ions) and water. The synthesis mixture is sealed in autoclaves and treated at defined temperatures where pressure is approximately equivalent to the saturated vapor pressure of water at the temperature of the synthesis. After a certain
time (from hours to days) the sources of silicon and aluminum are converted to zeolite crystals. A large number of variables such as the nature of the reactants, temperature, alkalinity, chemical composition, among others might influence the hydrothermal crystallization and determines the kinetics and the nature of the final product [8]. Sources of silicon and aluminum are countless. For instance, precipitated silica powders and colloidal silica sols are suitable silicon sources. Aluminum oxides, metal aluminates, aluminum hydroxides are the mostly used aluminum sources. Most of these sources are reagent grade and are expensive. In order to reduce the cost of the synthesis of zeolites, low-cost alternatives have been investigated, such as clay minerals [9, 10], coal fly ash [11, 12], different industrial wastes [13], etc. Besides the silicon and aluminum sources, a mineralizing agent is required to convert the starting material into mobile units which can react to form new chemical bonds and generate the zeolite framework. Alkali hydroxide, alkali earth hydroxide and/or fluoride ions are the most wide used. In addition, the presence of organic cations such as amines is required in numerous syntheses. These molecules provide alkalinity and act as a template or structure directing agent (SDA). ZSM-5 is synthesized conventionally using quaternary ammonium compounds such as TPA-Br and TPA-OH as templates. In general, the quaternary ammonium compounds are expensive; however NBA is a low-cost alternative to replace TPA compounds [14, 15].
From the first patented synthesis obtained by the researchers of Mobil Oil Corporation [16] to nowadays, important advances in the field of synthesis and applications of ZSM-5 zeolite have occured. During the last decades, several studies have focused on the design of ZSM-5 crystals with defined properties for specific applications. Achieving this goal requires understanding of the stages and pathways of synthesis, kinetics of crystallization and formation mechanisms of the crystals.
1.3.1. Crystallization stages
The most common indicator of the progress of zeolite crystallization is the evolution of crystallinity as a function of time. Figure 1.2 shows a typical S-shaped curve and the related stages of crystallization. In general, this curve is divided by the sequence: induction period, nucleation and crystal growth [17].
The induction period is defined as the time between the beginning of the reaction and the observation of the first nuclei. The nucleation period is characterized by rearrangement of the atoms or molecules of the starting material into nuclei of the product phase which are sufficiently large to grow towards crystals. Figure 1.2 shows a typical nucleation profile which starts with an increase of the nucleation rate with time until it reaches a maximum value and finally decreases to zero at the end of nucleation. The period of crystal growth is characterized by an increase in size of the crystals. In most of the cases, the species are incorporated onto the surface of a crystal by transportation through solution prior to attaching and moving on the surface and edges of crystals according to traditional crystallization theories [8].
Figure 1.2. Evolution of crystallization as a function of time.
1.3.2. Crystallization kinetics
The crystallization kinetics of zeolites is usually studied by observing the changes in crystallinity with time (t). Therefore, the S-shaped crystallization curve (Fig.1.2) can be usually correlated by an exponential equation (2) [18, 19]:
(2)
where f(C) is the fraction of zeolite formed at crystallization time t; k is a constant which
reflects the crystalline nucleation and growth rates; and n is a constant which provides information about the zeolite nucleation and growth mechanism. For instance, n = 3 in a
crystal-crystal transforming system where nucleation is heterogeneous, and n = 4 if the nucleation is homogeneous with a linear size independent growth. For gel-crystal transformations, the exponent is usually greater than 4 and associated with an increase of the nucleation rate during the initial autocatalytic period of crystallization [20].
1.3.3. Crystallization systems
In general, the synthesis pathways can be grouped into two main systems of crystallization: homogeneous and heterogeneous systems. The central difference between these two categories is the appearance of a macroscopic gel. For instance, homogeneous systems, which are also referred to as “clear solution systems", are characterized by the absence of a gel to the naked eye. In contrast, heterogeneous systems are also denominated "hydrogel systems" and result in a visible gel directly upon mixing the reactants or in the initial stage of crystallization. This gel is an amorphous phase with a certain degree of stiffness. Sometimes, the formed stiff gel mass can easily be extracted from the system and is referred to as the solid part [8, 21]. In the case of the system of clear solutions, advanced analyical techniques have allowed the identification and study of intermediate species during nucleation and the early stages of crystallization of MFI-type zeolites. For example, during the synthesis of silicalite-1 from clear solutions (which is the Al-free version of ZSM-5), the presence of colloidal nanoparticles with a size in the range of 2-4 nm is required [22-25]. These primary silica particles act as precursor species for crystallization [26].Nucleation and growth take place through the formation of aggregates of the primary particles [27, 28]. However, ZSM-5 is also produced from concentrated systems in which there is formation of a visible amorphous gel phase resulting in a heterogeneous system. A careful study of such a system should consider the experimental difficulties related to
in-situ characterization, such as the complex interrelationship between solid, colloidal
and liquid phase and the risk of creating artifacts during drying prior to ex-situ characterization. Therefore, in order to handle this issue, an approach is to study the intermediates products in a more diluted but still heterogeneous system [29].
1.4. Crystallization of ZSM-5 zeolite in heterogeneous systems
1.4.1. Reported mechanisms
Different mechanisms of crystallization in heterogeneous systems have been suggested for ZSM-5 through the years. For instance, Derouane and Gabelica [30, 31] proposed two main types of mechanisms according to the transportation pathways of the nutrients to the crystals during the growth process: the “liquid transportation mechanism” (type A) or “direct solid-state transformation” (type B).
(i) In the type A mechanism, the aluminosilicate species are transported through the liquid phase from the gel to the growing zeolite crystals after nucleation on the gel-liquid interface [32] or in solution [33].
(ii) The type B mechanism implies the formation of a hydrous aluminosilicate gel that acts as a matrix in which zeolite nuclei are formed through internal rearrangements and grow further through direct transformation of the hydrogel into zeolite material [34]. Alternatively, a combination of the type A and B mechanisms called “autocatalytic nucleation” was suggested. In this model, the nuclei form inside the gel matrix but only starts to grow once released in the liquid phase during the dissolution of the gel [35-38]. On the other hand, another approach to classify the mechanisms of crystallization is based on the identification of where nucleation occurs with respect to the solid and liquid. Several possibilities have been proposed in the literature:
1. Nucleation inside the gel phase followed by either hydrogel transformation into polycrystalline aggregates [30] or growth of the nuclei into individual crystals once released in the solution during gel dissolution [35].
2. Nucleation within a rim from the gel outer surface [39] or at the gel-liquid interface [32] and subsequent growth in solution.
3. Nucleation and formation of polycrystalline aggregates inside a tertiary amorphous phase formed by aggregation of the gel (the secondary amorphous phase, as amorphous raw materials are often used in zeolite synthesis) [29].
Despite of tremendous efforts undertaken to localize nucleation events, the presence of the macroscopic gel at the beginning of crystallization renders the task of monitoring the crystallization process in heterogeneous systems very complex. Therefore, the main challenge is to understand the development of the first nuclei and the role of the intermediate phases.
1.4.2. The gel phase
Usually, the synthesis of ZSM-5 zeolite is based on heterogeneous systems with an amorphous aluminosilicate gel formed by the condensation reactions between silicates and aluminates catalyzed by the presence of OH- ions. In the systems where the TPA ion is the structure directing agent, the morphology of the gel has been reported to ressemble an open dendritic gel structure [38] or worm-like particles (WLP) [29]. On the one hand, the reported open dendritic gel structure appears glassy without internal voids in the gel aggregrates and the transformation of the gel into zeolite was characterized by the absence of visible changes in the gel structure [38]. On the other hand, the WLP are formed by aggregation of intermediates containing aluminum species, which play an important role during the aggregation process [29]. In the above studies, it was observed that a decrease of the silica/alumina ratio leads to the formation of thicker gel structures [40]. Additionally, no internal structure could be directly evidenced within the WLP or gel aggregates in both studies.
In general, most of the studies on the crystallization of ZSM-5 in heterogeneous systems are in agreement that the gel is the source of nutrients for growth of the zeolite crystals [30-32] or an intermediate phase in a sequence of transformations that leads to the final product [29].
1.4.3. Morphology of the crystals and aluminum zoning
It is important to control morphology, structure and composition of the crystals, as these parameters influence the adsorption, diffusion and catalytic properties of zeolites. Despite the countless conditions and parameters employed for the synthesis of ZSM-5 zeolite, the morphology of the final zeolite crystals can be divided in two main categories: single crystals and polycrystalline aggregates. The synthesis of ZSM-5 single crystals has aroused great interest because it can be used to gain knowledge on
adsorption and diffusion processes [41, 42] by understanding the internal structure of ZSM-5 crystallites [42] and the spatial distribution of elements in the crystals [43]. Specifically, for the use of the ZSM-5 crystals as a catalyst with uniform acidic properties, a constant Si/Al ratio is required within the crystals. In many cases, single crystals prepared from TPA systems display aluminum profiles [44]. These profiles appear in ZSM-5 crystals larger than 0.5 µm and aluminum is often enriched in the outer shell of the crystals [43, 45, 46], which is referred to as “aluminum zoning”. The presence of a non-uniform distribution of aluminum has been explained by different theories:
1) According to the liquid-mediated mechanism proposed by Derouane and Gabelica [30], nucleation and early growth take place by the consumption of silica-richer species in solution. Therefore, the crystals grow first at the expense of silicate species in the solution until depletion. Then, dissolution of the aluminosilicate gel supplies the nutrients to the growing particles producing an increased aluminum concentration in the outer layer.
2) ZSM-5 nucleates from silica-rich solution with a homogeneous profile, followed by a progressive addition of silicon and aluminum released from an Al-rich gel and/or analcime zeolite formed at the bottom of the reactor after long reaction times [45]. 3) Deposition of aluminum on the surface of the crystals during cooling of the synthesis mixture [43].
4) Aluminum zoning was shown to be related to interactions of the aluminosilicate species with organic structure-directing agents and alkali ions [46]. However, this study assumed the direct reaction of the gel nutrients without considering possible inhomogeneities in the gel phase.
1.5. Zeolite synthesis from natural raw materials
Most of the zeolites are synthetized from chemical grade silica and alumina sources, as mentioned earlier. However, the use of high purity chemicals increases the costs of production; therefore, the search of economical alternatives such as natural sources of aluminosilicate has aroused great interest. Diatomaceous earth and clays minerals such as kaolin have been used as starting sources of silica and alumina for the synthesis of
zeolite. Synthesis pathways from raw materials of interest for this thesis work are reviewed in the following.
1.5.1. Kaolin as raw material for zeolites
Kaolin is a soft white clay which mainly consists of the mineral "kaolinite". Kaolinite is a hydrous aluminosilicate with the chemical formula: Al2O3•2SiO2•2H2O. Kaolin is found in nature, often together with other minerals (illite, bentonite, halloysite, muscovite, etc). Sometimes, these impurities are finer than the kaolinite and hence it is difficult to obtain kaolinite in pure form. Although zeolites prepared from natural kaolin might be contaminated, the costs of production and the high availability of this non-expensive material makes kaolin an attractive starting material for synthesis of zeolite [47, 48]. Kaolinite requires a thermal treatment between 550-950 °C in order to obtain a more reactive material after removal of structural water. The amorphous product after heat treatment is called metakaolinite. The reaction of this transformation can be expressed by equation (3) [49]:
Al2Si2O5(OH)4 → Al2Si2O7 + 2 H2O (3)
The low Si/Al molar ratio of 1 of kaolinite makes it a suitable starting aluminosilicate source for the preparation of low silica zeolites such as zeolite A [50-52]. However, medium and high silica zeolites have also been synthetized from kaolinite, e.g. zeolite X [47, 53], zeolite Y [54] and mordenite [55]. In these cases, either removal of aluminum or an addition of silica with high solubility was required in order to increase the Si/Al molar ratio of the synthesis mixture. In the case of zeolite X, decreasing the aluminum concentration in kaolin has been achieved either by leaching kaolin in a solution of an inorganic acid such as sulfuric acid [56] or alternatively calcining the kaolin with an inorganic acid [57].
ZSM-5 zeolite was also prepared from kaolinite by using additional sources of silica [58, 59] or by removal of aluminum [60, 61]. In these studies, the TPA ion was used as the SDA. However, TPA compounds are expensive compared with more simple amines which can also act as SDA. An inexpensive alternative is NBA,which has been reported to allow the synthesis of ZSM-5 zeolite from kaolin in combination with silica sol as additional silica source [62].
1.5.2. Diatomaceous earth-derived zeolites
Diatomaceous earth (also known as diatomite) is a sedimentary deposit and is composed of fossilized one-celled algae known as diatoms. These sediments consist almost entirely of amorphous silica and might contain secondary minerals including clays, quartz, calcite, mica, feldspars, etc. Diatomite is used primarily as a filter agent, cement additive, filler, and an adsorbent [63]. Diatomite has been investigated as raw material for the preparation of several zeolites, such as zeolite A [64], Na-P1 and hydroxysodalite [65], NaY [66] and mordenite [67]. An acid treatment is usually required to remove the impurities.
On the other hand, ZSM-5 has been synthetized from a mixture of diatomite and volcanic ashes [68]. Nevertheless, there are a few reports on the preparation of ZSM-5 using only diatomite as silica source [69, 70]. In these studies, TPA-Br and diethanolamine were used as SDA. However, there were no published studies on the synthesis of ZSM-5 using diatomite as a single aluminosilica source and NBA as template at the start of this thesis work.
1.6. Scope of the present work
The aim of the present work was to investigate the synthesis of ZSM-5 crystals from natural raw materials in combination with sodium hydroxide and inexpensive NBA as template.
The first part of the work was directed towards the development of methods for the synthesis of ZSM-5 crystals from two natural raw materials, namely kaolin clay and diatomaceous earth.
The second part focused on studies of the kaolin system in order to understand the nucleation and growth processes of the ZSM-5 crystals from a gel. The internal structure of the gel was first investigated and then, a kinetic study was performed and coupled with microstructural observations. Finally, the mechanisms leading to aluminium zoning and dendritical growth of the zeolite crystals were studied.
As a prerequisite to those studies, a methodology to obtain local compositional data by EDS on zeolites were developed using zeolite A as a model system.
2 Experimental
2.1. Preparation of the gelKaolin (Riedel de Haen, pro analysis) was first calcined in a porcelain crucible that was placed in a furnace and heated at a rate of 8 °C/min in air. When the temperature reached 750 °C, it was maintained for 2 h to obtain metakaolin and the temperature in the furnace was then reduced to room temperature. It was not necessary to carry out the heat treatment for diatomite in order to obtain ZSM-5, and consequently, the diatomite material was not heat treated. It is noteworthy that if the heat treatment of kaolin was omitted, no zeolite was obtained.
Metakaolin or diatomite was acid leached in a round-bottom flask under reflux conditions in a thermostated oil bath maintained at 115 °C under strirring in hydrochloric acid (Merk, pro analysis 37%) with a concentration of 3 M for 2.5 h. The solid to acid weight ratio was 1:17. Subsequently, the suspension was quenched and the acid leached product was washed with distilled water. Finally, the product was separated by filtration and the filter cake was washed with distilled water until the pH reached a value close to 7. Finally, the resulting solid powder was dried at 110 °C overnight.
2.2. Hydrothermal synthesis
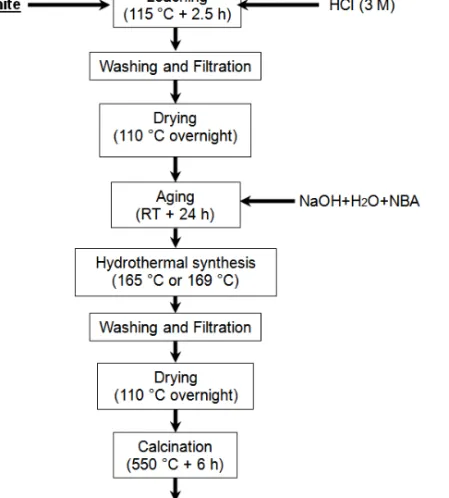
The synthesis mixtures were prepared by mixing the aluminosilicate sources with distilled water, NBA (Sigma Aldrich, 99.5%) and NaOH (Sigma Aldrich, reagent grade, ≥98%, anhydrous pellets). The molar ratios in the synthesis mixtures were: Na2O/SiO2 = 0.18; SiO2/Al2O3 = X; SiO2/NBA = 7; H2O/SiO2 = 30, where X = 33 and 44 for leached metakaolin and leached diatomite, respectively. The mixtures were aged under stirring for 24 h at room temperature (RT) and were thereafter hydrothermally heated in Teflon lined stainless steel autoclaves kept for different times in an oil bath at 165 or 169 °C. After hydrothermal treatment, the solids were recovered by filtration and washed with distilled water until the pH reached a value close to 7. The resulting powders were dried at 110 °C overnight and finally calcined at 550 °C for 6 h to remove the template from the final crystals. Figure 2.1 displays a flowchart for the synthesis and preparation of ZSM-5 crystals from kaolin and Bolivian diatomite.
Figure 2.1. Flowchart showing the different steps of the synthesis of ZSM-5 from
kaolin or diatomite.
2.3. Separation of the phases
In order to study the intermediate products as a function of synthesis time in the kaolin system, the reaction was quenched by flushing the autoclave with tap water with a temperature of about 8 °C after varying synthesis time.
The supernatant liquid after synthesis was separated from the solid by careful decantation. The liquid was further passed through a syringe filter with a pore size of 0.2 µm. The solid formed at the bottom of the autoclave was collected and either dried at room temperature for 48 h (i.e. unwashed) or washed several times with water directly after synthesis followed by air drying at 60 °C overnight. In addition, in order to
analyze the remnant solid part after the aging step, the solid was recovered by filtration on filter paper (Munktell, grade 00H, typical retention 1 - 2 µm). The filter cake was washed 3 times with distilled water and dried at 60 °C.
2.4. Preparation of thin films by seeded growth
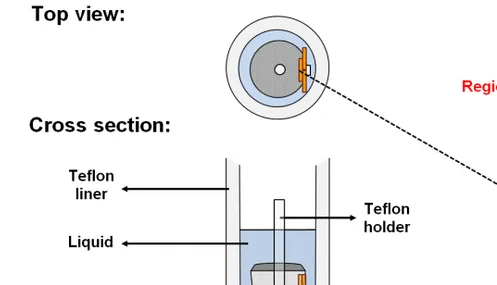
Amorphous carbon wafers (HTW Hochtemperatur-Werkstoffe GmbH, Tierhaupten, Germany) of 20 × 10 × 1 mm3 were used for seeded growth of zeolite films. The method for the preparation of silicalite-1 nanocrystals and seeding developed by Heldund et al. [71] was followed. To summarize, an aqueous solution of a cationic polymer was used in order to attach the seeds to the carbon wafers. The wafers were rinsed with a 0.1 M ammonia solution to remove the excess of polymer and seeds, respectively. In the next step, film growth was performed by placing the seeded wafers held by a Teflon stand in the synthesis mixture in the autoclave. Three seeded wafers were assembled as described in Figure 2.2. This special arrangement of the seeded wafers was used in order to evaluate the effect of physical screening on the outcome of the growth of the film.
Figure 2.2. Sketch showing the assembly of the cross-sections of the 3 amorphous
2.5. Characterization of the raw materials, intermediates and final products
2.5.1. ICP-SFMS
The overall composition of the solid samples was measured by ICP-SFMS. Prior to the measurements, the samples of 0.1 g were fused with 0.4 g of LiBO2 and dissolved in HNO3. On the other hand, the composition of the liquid was analyzed by ICP-SFMS after dilution of the samples with water by a factor of 100.
2.5.2. XRD
The crystallinity of the washed samples was analyzed by XRD using a PANalytical Empyrean X-ray Diffractometer equipped with a Cu LFF HR X-ray tube, a graphite monochromator, and a PIXcel3D detector. The X-ray tube was operated at 40 mA and 45 kV. A 2θ range from 5 to 50º was investigated with a step size of 0.026º. The degree of crystallinity was calculated by using the area of characteristic peaks of ZSM-5 between 22 and 25° after background removal, as follows by equation (4):
∑
∑ The standard sample used was ZSM-5 crystals with an average length of 10 μm synthesized from silicic acid and TPA-OH by following the method reported by Lechert and Kleinwort [72].
2.5.3. XHR-SEM
The morphology of the solid samples was investigated with extreme high resolution – scanning electron microscopy (XHR-SEM) using a beam of electrons with a landing voltage of 1 kV or 3 kV with a bias voltage of -2 or -4 kV using a Magellan 400 (FEI Company, Eindhoven, the Netherlands) instrument. The samples were not coated with any conductive coating prior to inspection and recording of images was performed with a probe current of 6.3 pA. However, depending on the features of interest in the samples or the required data, the imaging settings were varied. The main settings and special preparation of the samples are described in the next paragraphs.
2.5.4. Imaging on polished cross-sections
High resolution imaging using a Through-the-Lens Detector (TLD) was performed by immersion of the sample in a strong magnetic field and using a probe of electrons at a landing energy of 3 keV and a current of 6.3 pA. A dedicated backscattered electron detector in combination with an accelerating voltage of 3 kV and a probe current of 800 pA was employed in order to facilitate the identification of the zeolite crystals by creating contrast between the gel phase and the crystals on polished cross-sections. In order to maximize the amount of sample in each field of view, the polished cross-sections of the solid product were prepared by embedding pressed pellets of the pulverized solid in epoxy resin. Polished cross-sections were obtained by mechanical lapping. All imaging was performed without coating the samples.
2.5.5. Size distribution of the ZSM-5 crystals
The crystal size distribution of the flat tablet-shaped crystals synthesized from metakaolin was estimated for each synthesis time by manual analysis of SEM pictures. A population of 580 crystals was measured in order to obtain the final size distribution after 7 h of synthesis at 169 °C. The size of the three main crystallographic directions of the MFI structure was measured as shown in Figure 2.3, where a, b and c indicate the crystallographic directions.
Figure 2.3. Sketch of the flat tablet-shaped crystals with elliptical basis indicating the
2.5.6. EDS
Local compositions were determined by EDS on a Merlin SEM (Carl Zeiss, Oberkochen, Germany) instrument using a 50 mm2 X-Max X-ray detector (Oxford Instruments, Abingdon, UK). EDS analysis was performed at different acceleration voltages depending on the investigated material or size of the area of interest. Specifically, a microinjector was used to introduce nitrogen gas close to the surface of samples in order to mitigate charging (referred to as charge compensation (CC) below). Previous to analysis, the EDS system was calibrated on silicon for samples analyzed at 10 kV and below. For higher accelerating voltage, copper was used for calibration. To validate the method, EDS analysis was carried out at different accelerating voltage and a current of 1600 pA on zeolite A in the Na and Ca forms. The concentration of Na, Al and Si was measured with the beam scanning at low magnification (100 times) to avoid diffusion of Na, while the concentration of Ca was measured locally in 10 individual crystals.
2.5.7. Si/Al ratio in the walls
In order to determine the Si/Al ratio in the walls of the gel structure without the contribution of impurities, such as quartz, orthoclase and muscovite, local measurements at high magnification were required. The measurements were performed in locations where the sponge-like structure of the gels was the thickest. An acceleration voltage of 10 kV was found to cause beam penetration beyond the wall thickness of the gel. Therefore, 7.5 kV was used in order to gain compositional data representative of the bulk of the gel walls and 3.5 kV for measurement of even shallower regions beneath the surface. Only data showing no potassium peak in the EDS spectrum were considered, as it was a sign of the presence of clay platelets or orthoclase. The data were acquired by collecting 200 000 counts of the X-rays produced during scanning field-of-views of
1142×857 nm2 and 228×171 nm2 (corresponding to 100 000× or 500 000×
magnification, respectively) at the fastest scanning rate available (0.7 ns dwell time) and at the pixel resolution causing less charging (i.e. 512×384) in order to limit beam damage.
2.5.8. Si/Al ratio on cross-sections of the final crystals
The Si/Al ratio on cross-sections of the final crystals was measured using an acceleration voltage of 3.5 kV. The measurements were performed at the locations illustrated in Figure 2.4. Distribution of the Si/Al ratio along the average radius from the center of the flat tablet-shaped crystals with elliptical basis was converted into synthesis time by using the constant linear growth rates determined in the kinetic study.
29 28 27 21 20 19 13 12 11 5 4 3 30 22 14 6 1 2 10 18 26 7 8 9 15 16 17 23 24 25 31 32 33
Figure 2.4. Schematic distribution of the Si/Al measurements on a cross-section of an
individual flat tablet-shaped crystal sectioned parallel to the [010] zone axis.
2.5.9. HR-TEM
High resolution-transmission electron microscopy investigation was carried out by using a JEOL JEM-2100F TEM (Jeol Ltd. Tokyo, Japan) at an operating voltage of 200 kV. The samples were prepared by crushing the solid in a mortar and by dispersion in propanol for 2 min by ultrasonication. Finally, one drop of the suspension was placed and dried on a holey carbon film supported by a TEM copper grid.
2.5.10. DLS
Dynamic light scattering was performed on the liquid after centrifugation or filtration through a syringe filter with a porosity of 0.2 µm using a Zetasizer Nano-ZS instrument (Malvern Instruments Ltd., Worcestershire, U.K.). Both methods produced similar results.
2.5.11. TG and MS
Thermogravimetry was performed on a STA 449C Jupiter instrument (Netzsch-Gerätebau, GmbH, Selb, Germany) coupled with a Netzsch Aeolos QMS 403C mass
spectrometer. Samples were placed in an alumina crucible and heated from room temperature to 700 °C at heating rate of 10 °C/min in helium atmosphere.
2.5.12. Nitrogen adsorption
Nitrogen adsorption-desorption data were recorded with an ASAP 2010 equipment from Micromeritics to estimate the surface area using the BET equation, total pore volume and micropore volume of the raw materials and products. In the case of the washed gel walls, the equivalent spherical particle diameter d in nanometer was calculated from the surface area using the equation d = 6000/(BET surface area in m2/g) × (density in g/cm3). The density of Na
2SiO3 (i.e. 2.4 g/cm3) was assumed.
2.6. Determination of the nucleation rate
Zeolites usually grow at a constant linear growth rate, which is independent of crystal size [35, 73]. Taking advantage of this feature of zeolite crystallization, Zhdanov [19] developed a method to determine the variation of the nucleation rate as a function of synthesis time. The first step is to determine the linear crystal growth rates by simply measuring the largest crystals observed at various time intervals during crystallization. Subsequently, the full size distribution of the final crystals is converted into a nucleation curve. The calculation consists of the following steps:
1) The approximate time of nucleation (ti) of a crystal with a length (Li) is determined
by using the constant linear growth rate, which can be expressed as: (5)
where is the slope of the linear part of the growth curve of the largest crystals ( . If the crystallization system presents an induction period defined as ( and
considering the size difference , then the linear growth equation can be
written as:
∫ (6)
(7)
2) This process was repeated for all the size classes present in the size distribution of the final crystals.
3) If ni crystals of length Li are present at time ti, then the fraction of crystals ( ) can be
expressed as:
⁄ (8) where N is the total number of crystals.
4) If the fraction of crystals which nucleate at time ti is i and the fraction which
nucleate at time ti+L is i+L then:
(9)
5) Finally, the nucleation rate might be expressed as the sum of these increments by:
3 Results and Discussion
3.1. Validation of EDS as a tool for studying aluminosilicates (Paper I)Zeolite A was used as a model system with a well-defined composition and analyzed by EDS. The diffractogram of the commercial zeolite A powder (Akzo Nobel) that was used is presented in Figure 3.1(a). No signal from amorphous material or other crystalline phases than zeolite A were observed. Figure 3.1.(b) shows a SEM micrograph of typical crystals exhibiting the cubic morphology of zeolite A. Hence, the investigated zeolite A powder was almost free of extraneous phases.
Figure 3.1. Commercial zeolite A powder: (a) XRD diffractogram (pattern reference
[74]); (b) SEM micrograph.
The molar Si/Al and Na/Al ratios in the commercial zeolite A powder were close to 1 according to technical specifications. These values served as a basis to evaluate the main experimental parameters affecting the outcome of the EDS analysis.
Effect of overvoltage
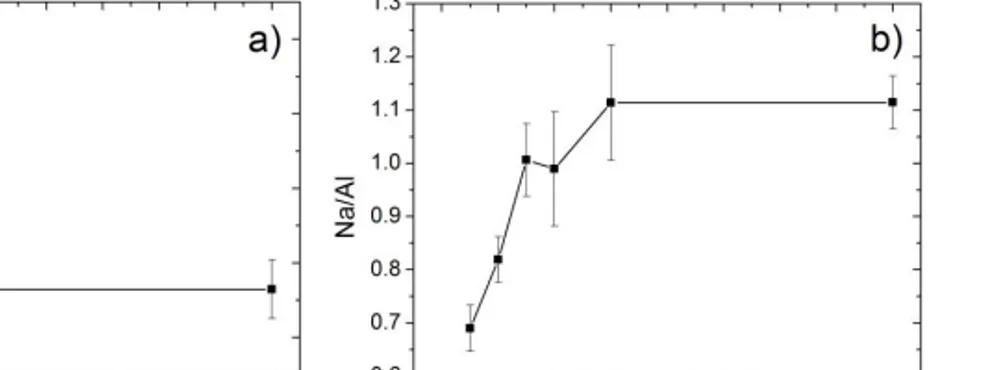
Figures 3.2 and 3.3 show the molar Si/Al and Na/Al ratios determined by EDS as a function of acceleration voltage at low and high magnification, respectively. Stable values close to 1 were obtained at high voltages. However, the Si/Al ratio steadily increases (Fig.3.2.(a) and Fig.3.3.(a)), while the Na/Al ratio decreases (Fig.3.2.(b) and Fig.3.3.(b)), as the acceleration voltage was reduced below 5 kV. Considering that the
Si/Al ratio with decreasing voltage would have been expected according to the overvoltage necessary to create maximum X-ray generation in the sample. Nevertheless, these results show that a minimum acceleration voltage of 3.5 kV can be used in order to gain representative data with limited beam penetration.
Figure 3.2. Molar ratios as a function of acceleration voltage at 100 × magnification:
(a) Si/Al; (b) Na/Al.
Figure 3.3. Molar ratios as a function of acceleration voltage at 250 000 ×
magnification: (a) Si/Al; (b) Na/Al.
Effect of charge compensation (CC) and magnification
Charge compensation was investigated as a tool in order to prevent Na diffusion at high dose level. Figure 3.4 illustrates the effect of CC on the molar Si/Al and Na/Al ratios as a function of magnification at an acceleration voltage of 10 kV. CC and magnification had no influence on the Si/Al ratio, which was constant for all investigated conditions. However, the Na/Al ratio deviates heavily from 1 at high magnification. In this respect, CC was found to prevent the diffusion of Na at higher levels of magnification. Reliable
values of the Na/Al ratio could be obtained at magnifications up to 50 000 × with CC (Fig.3.4(a)) instead of only 10 000 × without CC (Fig.3.4(b)).
Figure 3.4. Molar Si/Al and Na/Al ratios as a function of magnification at 10 kV, 200
pA and 200 000 counts in total: (a) with CC; (b) without CC.
Validation
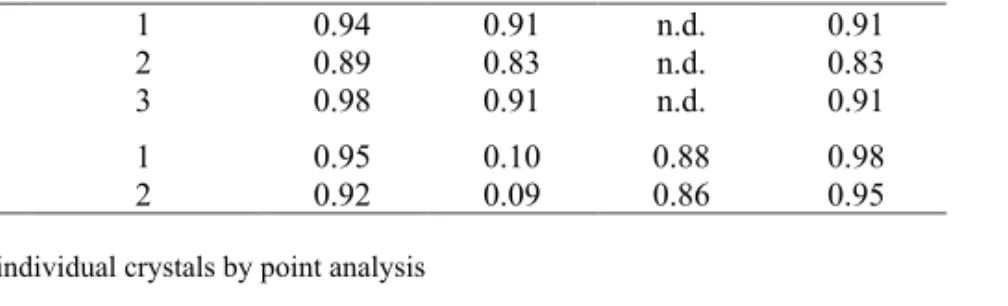
In order to evaluate the reliability of the measurements, ICP-SFMS and EDS data at 10 kV were compared, see Table 3.1. The molar Si/Al ratio determined by ICP-SFMS shows values ranging from 0.94 to 0.98. Therefore, this method underestimates the Si/Al ratio which is obviously not possible according to the Löwenstein’s rule that states that the minimum Si/Al ratio cannot be lower than 1. The measurements by EDS display higher reproducibility, but slightly overestimates the Si/Al ratio if it is assumed that the correct ratio is 1.0. Interestingly, the samples investigated by EDS showed (Na+2Ca)/Al ratios very close to 1. This reflects the validity of the quantitative EDS method developed in this work. It was found to be more reliable than ICP-SFMS because of the large error margin of the latter, which brings too much uncertainty on the elements present in large amounts.
Table 3.1. Compositional ratios in the commercial zeolite A determined by EDS and
ICP-SFMS.
Ion
exchange Method Measurement Si/Al Na/Al 2Ca/Al
(Na+2Ca)/ Al Na EDS 10 1.03±0.01 0.99±0.01 n.d. 0.99 Ca* 1 1.04±0.01 0.10±0.01 0.88±0.03 0.98 Na 1 0.94 0.91 n.d. 0.91 2 0.89 0.83 n.d. 0.83 ICP 3 0.98 0.91 n.d. 0.91 Ca 1 2 0.95 0.92 0.10 0.09 0.88 0.86 0.98 0.95 n.d. (non detected)
* Measured locally in 10 individual crystals by point analysis
3.2. Characterization of the starting materials (Paper II)
Figure 3.5 shows X-ray diffractograms of the raw aluminosilicates and dealuminated counterparts. Kaolin contains mostly kaolinite but also traces of quartz and muscovite. Kaolin was converted to mostly amorphous material with small amounts of muscovite and quartz after calcination and leaching. On the other hand, the diffractogram of raw diatomite shows the occurrence of NaCl, muscovite, albite and quartz in addition to amorphous material. After acid treatment and subsequent washing, the amorphous material remained and NaCl was removed, but the other minor constituents were still present (muscovite, albite and quartz).
Raw kaolin and diatomite had Si/Al ratios of 1.1 and 7.5, respectively. As shown in Table 3.2, this ratio was successfully increased by acid leaching to 16.5 and 22.0 for kaolin and diatomite, respectively. Acid leaching also reduced significantly the concentration of impurities in both materials.
Table 3.2. Compositions (in mole %) of kaolin, diatomite, leached metakaolin, and
leached diatomite determined by ICP-SFMS.
Sample SiO2 Al2O3 CaO Fe2O3 K2O MgO Na2O Si/Al
Kaolin 67.7 30.1 0.15 0.37 1.13 0.59 0.16 1.1
Leached metakaolin 95.9 2.92 0.12 0.16 0.6 0.19 0.08 16.5
Diatomite 78.8 5.22 4.44 0.22 1.29 3.3 6.78 7.5
Leached diatomite 96.4 2.17 0.49 0.06 0.33 0.19 0.35 22.0
SEM images of the raw and leached materials are shown in Figure 3.6. Kaolin was composed of stacks of platelets with hexagonal symmetry (Fig.3.6(a)) and leached metakaolin (Fig.3.6(b)) had a very similar morphology. On the other hand, raw diatomite (Fig.3.6(d)) exhibited large particles with typical shapes of diatomaceous biogenic sediments. During the acid treatment, diatomite particles were partially broken in smaller pieces by the mechanical action of stirring (Fig.3.6(e)).
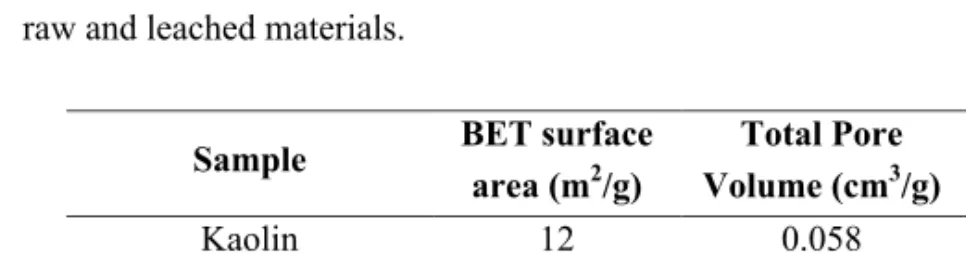
Leaching of metakaolin caused the formation of micropores [60, 61] and an increase of the surface area from 12 to 288 m2/g, as shown in Table 3.3. Leaching of diatomite only caused a slight increase in specific surface area from 38 to 55 m2/g (see Table 3.3).
Table 3.3. Surface area and pore volumes derived from nitrogen adsorption data for the
raw and leached materials.
Sample BET surface
area (m2/g) Total Pore Volume (cm3/g) Micropore Volume (cm3/g) Kaolin 12 0.058 0.004 Leached Metakaolin 288 0.24 0.089 Diatomite 38 0.093 0.003 Leached Diatomite 55 0.11 0.006
Figure 3.6. SEM images of: (a) kaolin, (b) leached metakaolin, (c) solid part of leached
metakaolin after aging, (d) diatomite, (e) leached diatomite and (f) solid part of leached diatomite after aging.
3.3. Preparation of ZSM-5 from kaolin and diatomite (Paper II)
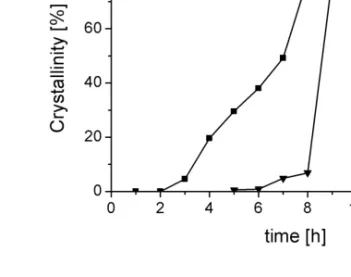
The evolution of XRD crystallinity of ZSM-5 crystals as a function of synthesis time is showed in Figure 3.7.
Figure 3.7. Crystallinity as a function of time of the reaction products prepared from:
(a) leached metakaolin; (b) leached diatomite.
The maximum crystallinity for the samples prepared from leached metakaolin is reached after synthesis times between 9 and 12 h before decreasing for prolonged hydrothermal treatment when leached metakaolin was used (Fig.3.7(a)). In contrast, if leached diatomite was the starting material, a maximum crystallinity was obtained for 12 h of synthesis (Fig.3.7(b)).
In order to explain the difference in induction period between the two systems, the liquid phases and the particles of the solid phases resulting after the aging period and before hydrothermal treatment were studied. After filtration, 26 and 80 wt% of the original solid material remained from the aged synthesis mixtures prepared from leached metakaolin and leached diatomite, respectively. The mixture prepared from leached metakaolin contained a liquid phase rich in silica (Si/Al ratio ~ 200-400) and the solid phase exhibited a Si/Al ratio of 3.8 with the presence of platelets (probably, undigested muscovite or other materials that did not become microporous), see figure Fig.3.6(c). On the other hand, it was still possible to observe particles with typical morphology of fossilized diatomites in the synthesis mixture derived from diatomite after aging as illustrated in Fig.3.6(f). These observations suggest that the shorter induction time in the metakaolin system is related to the more complete dissolution of the microporous silica after aging.
Figure 3.8 displays the diffractograms of the final products obtained from both types of raw materials after 12 h of synthesis. The main characteristic peaks correspond to the MFI structure. Peaks of quartz being similar and same order of magnitude as in the leached materials were also present intensity in both samples. However, the product obtained from diatomite displayed X-ray reflections of mordenite, approximately 5% of the intensity of the main peak of ZSM-5. The molar composition of the final products after 12 h of synthesis is presented in Table 3.4. The average Si/Al ratio was 11.5 and 20.0 for the products obtained from leached metakaolin and diatomite, respectively. From these data, the products could be considered as quite pure ZSM-5 with traces of mordenite formed during synthesis and of quartz remaining from the raw material.
Table 3.4. Molar composition of the ZSM-5 products by ICP-SFMS.
Sample SiO2 Al2O3 CaO Fe2O3 K2O MgO Na2O Si/Al
ZSM-5 (Kaolin) 94 4.15 0.10 0.18 0.65 0.22 0.65 11.5
ZSM-5 (Diatomite) 96 2.40 0.63 0.07 0.30 0.23 0.37 20.0
Figure 3.8. XRD diffractograms of the products obtained after 12 h of synthesis from:
(a) leached diatomite; (b) leached metakaolin.
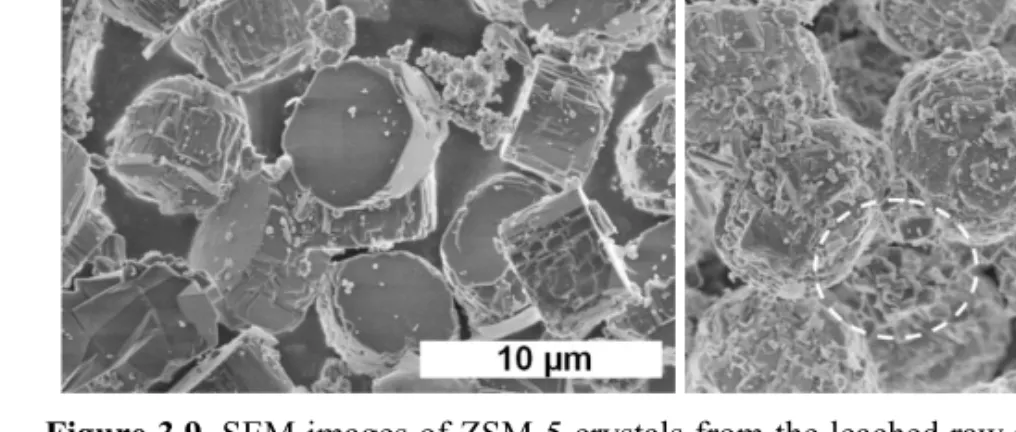
Figure 3.9 shows the morphology of the products as determined by SEM. Synthesis from leached metakaolin resulted in the formation of flat tablet-shaped ZSM-5 crystals with a diameter of 5-6 µm, but also some smaller particles, as shown in Fig.3.9(a). In contrast, the ZSM-5 crystals obtained from leached diatomite were rounded with an
average diameter around 7-8 µm and an aspect ratio close to 1 (Fig.3.9 (b)). This sample also contained smaller particles and particularly small slabs as those encircled in Fig.3.9(b), which were attributed to mordenite.
Figure 3.9. SEM images of ZSM-5 crystals from the leached raw materials: (a) kaolin;
(b) diatomite.
Although induction time was longer, the maximum crystallinity was slightly higher for samples prepared from diatomite than from kaolin and amounted to 93 and 87%, respectively, as shown in Fig.3.7. By a normalization of the BET specific surface area and total micropore volume data with respect to the ZSM-5 standard sample also used for determining crystallinity by XRD, therefore, the crystallinity of the reaction product obtained from kaolin is in good agreement with surface area values given in Table 3.5 with a specific surface area of 82% of that of the standard sample. The total micropore volume (68%) value indicates that the final product prepared from kaolin contains approximately 30% of non-microporous material in addition to the ZSM-5 crystals. The same values calculated from the BET specific surface area and total micropore volume for the diatomite-derived product, 96 and 82% respectively, are higher than what might have been expected from the XRD crystallinity value (93%) in comparison to kaolin. This can be attributed to the presence of mordenite as a by-product in addition to non-microporous materials.
It was not possible to prevent the formation of mordenite by further optimization of the synthesis parameters. Instead, formation of mordenite occurred randomly, probably due to the variability of the diatomite raw material. Calcium was found to be concentrated in the mordenite crystals as revealed by the comparison of the EDS spectra between
uncalcined ZSM-5 (Fig.3.10(a)) and mordenite (Fig.3.10(b)) crystals. Therefore, the higher calcium content in leached diatomite as compared to leached kaolin probably favored the formation of mordenite.
Table 3.5. Surface area and pore volumes derived from nitrogen adsorption data for the
final products and standard sample.
Sample BET surface
area (m2/g) Total Pore Volume (cm3/g) Micropore Volume (cm3/g) ZSM-5 (Kaolin) 255 (82%) 0.17 0.082 (68%) ZSM-5 (Diatomite) 298 (96%) 0.15 0.098 (82%) ZSM-5 standard 310 0.15 0.12
Figure 3.10. EDS spectra of crystals in the final product obtained from leached
diatomite after 12 h of synthesis: (a) ZSM-5; (b) mordenite.
The BET specific surface area obtained in this work for the ZSM-5 sample prepared from leached diatomite (298 m2/g) is comparable with that obtained in the study by Sang et al.[14] (294 m2/g), who employed water glass and aluminum sulfate as Si and Al sources, respectively. Therefore, Bolivian diatomite appears as a competitive source of inexpensive raw materials for the synthesis of ZSM-5 crystals. In addition to the higher crystallinity and BET specific surface area achieved in this work compared with kaolin, diatomite does not require heat treatment at high temperature for metakaolinization.
3.4. Aging of leached metakaolin (Paper III)
After 24 h of aging of the reaction mixture prepared from leached metakaolin at room temperature, the liquid phase was rich in Si with a molar Si/Al ratio as high as 588 (Table 3.6). This was associated to the dissolution of the leached metakaolin under the prevailing alkaline conditions. Consequently, approximately 84% of the Si present in the leached metakaolin was transferred to the liquid phase. In addition, the liquid was very rich in Na, as it contained 98% of the total amount of Na. In contrast, only 2% of the introduced Al was found in the liquid phase. Consequently, the majority of the Al was present in the solid phase, which exhibited a molar Si/Al ratio of 2.5.
Table 3.6. Molar Si/Al and Na/Al ratios of the solid components and liquid.
Leached metakaolin Impurities Liquid Gel 1
unwashed
Gel 1 washed
Si/Al 16a 2.5a 588a 20b 13b
Na/Al 0.12a 0.13a 247a 6.5c 1.2c
a determined by ICP-SFMS; b determined by EDS; c determined by combination of EDS
and ICP-SFMS
Figure 3.11. XRD diffractogram (a) and SEM image (b) platelets of muscovite at high
magnification.
The remnant solid was found by XRD to consist of impurities present in natural kaolin, such as quartz, muscovite and orthoclase as shown in Fig.3.11(a). Therefore, the solid material after aging was comprised of agglomerated particles, mostly consisting of muscovite clay platelets as shown in the SEM micrograph in Fig.3.11(b). Consequently,
the presence of muscovite and orthoclase was responsible for the low Si/Al ratio of 2.5 of the solid recovered after aging reported in Table 3.6. These compounds are hereafter referred to as impurities.
3.5. Structure of the gel (Paper III)
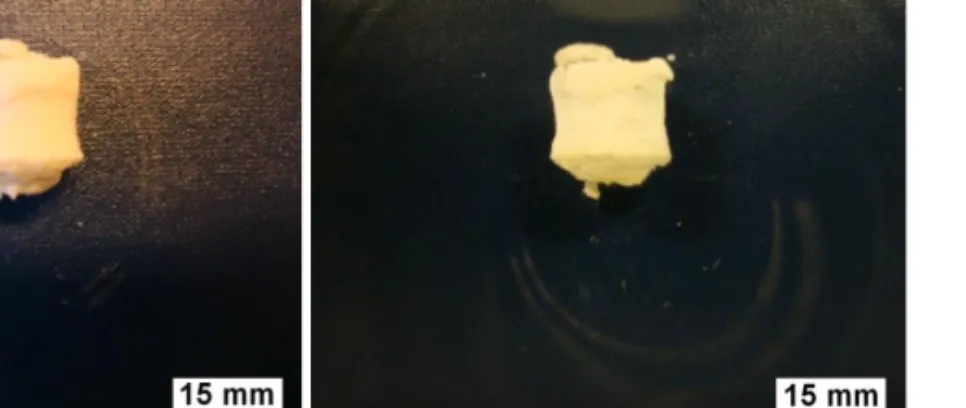
Heating of the aged reaction mixture at 169 °C caused the formation of a gel mass within the first two hours. Photographs of the gel mass obtained after 2 h of synthesis before and after drying are shown in Figure 3.12.
Figure 3.12. Gel mass recovered after 2 h of synthesis: (a) after quenching of the
autoclave; (b) after drying at room temperature for 48 h.
Figure 3.13 shows a sketch of the gel mass that exhibited constant shape and size between 2 and 4 h of synthesis. It consisted of a main white opaque part (Gel 1) that was covered by a thin translucent layer on the top (Gel 2). Crystallization of the NBA-ZSM-5 single crystals was observed to occur in Gel 1 only.
3.5.1. Crystallization stages with respect to gel evolution (Paper III)
According to the macroscopic observations of the evolution of the gel mass during the course of synthesis, the curve of the XRD crystallinity of ZSM-5 shown in Figure 3.14(a) was divided into four stages:
Stage I: apparent induction period (from 0 to 2 h) corresponding to the formation of the gel mass.
Stage II: crystallization with intact gel mass (from 2 to 4 h).
Stage III: crystallization after collapse of the gel mass (from 5 to 6 h). Stage IV: complete disappearance of the gel and ripening (after 6 h).
Figure 3.14. Evolution as a function of synthesis time of: (a) ZSM-5 crystallinity, (b)
silicon, (c) sodium, (d) aluminum concentrations in the liquid phase, (e) diameter of the particles present in liquid phase, (f) pH, (g) minimum diameter of the gel walls (*measurements performed on small fragments of the gel), (h) BET surface area of the
washed solid phase.
3.5.2. Formation of the gel (Paper III)
Between 0 and 2 h (Stage I), the formation of the gel mass occurs along with decreasing concentrations of Si and Na in solution, as shown in Fig.3.14(b) and Fig.3.14(c),
respectively. This shows that Si and Na precipate from solution, which results in the formation of the gel. Complemmentarily, the aluminum in the liquid phase which is most likely present as monomeric aluminate anions (Al(OH)4) provided by rapid dissolution of parts of the impurities in the raw material upon heating probably reacted during the first hour with larger silicate oligomers as suggested in literature [75]. This is demonstrated by the decrease in average diameter measured by DLS between 0 and 1 h (Fig.3.14(e)) and corroborated by the sharp increase in pH of the liquid between 0 and 0.5h (Fig.3.14(f)) caused by the release of [OH-] ions to the solution during condensation of the silica oligomers according to the following reaction:
≡SiO- + HO-Si≡ ↔ ≡Si-O-Si≡ + OH- (11)
Subsequently, during the second hour of synthesis, more Na and Si in the form of shorter silicate oligomers were precipitated from the solution and integrated to the gel, as shown by the decrease of the concentrations in Si and Na between 1 and 2 h in Fig.3.14(b) and Fig.3.14(c), respectively.
During stage II and III of the crystallization process, Na was continuously released from the gel to the liquid phase and the concentration of Na in the liquid phase (Fig.3.14(c)) followed relatively well the evolution of the XRD crystallinity curve over time (Fig.3.14(a)). On the other hand, Fig.3.14(b) suggests that the concentration of silicon in the liquid phase was relatively constant during the crystallization process. The slight increase at the beginning of stage III is believed to be due to the dissolution of the translucent gel part (Gel 2 in Fig.3.13) after the collapse of the main part of the gel mass (Gel 1 in Fig.3.13). This is corroborated by the detection of larger oligomers during stage III and IV by DLS (Fig.3.14(e)) and the decrease of pH at the transition stage II/III, whereas an increase of pH is characteristic of zeolite crystallization, as previously demonstrated in the literature [76], [77].
3.5.3. Structure of the gel after drying (Paper III)
After 2 h of synthesis, the dried Gel 1 (Fig.3.13) was found to consist of a sponge-like structure with cell walls exhibiting a minimum diameter in the range of 250 nm, as shown in Figure 3.15. It is noteworthy that beyond 2 h, no further growth of the cell walls was observed at longer synthesis times, as shown in Fig.3.14(g). Therefore, the