A
LIA
HMED,
L
INAA
NDERSSON&
M
ATSH
AMMARSTEDT 2012-2Earnings differentials due to
sexual orientation: A look at
some possible explanations
Abstract
Previous research has documented earnings differentials due to sexual orientation. In this paper we take a closer look at such differentials and the explanations for them. By studying yearly earnings as well as full-time monthly earnings, we are able to observe the extent to which the earnings disadvantage that is often observed for homosexual males and the earnings advantage often observed for homosexual females remain when we control for factors such as their number of hours worked. Our results suggest that male homosexuals are also at an earnings disadvantage compared to male heterosexuals after controlling for number of hours worked. This disadvantage is larger at the top than at the bottom of the earnings distribution. However, for females the earnings differential is considerably smaller when we study full-time monthly earnings than when we study yearly earnings. Thus, the results indicate that male homosexuals face obstacles on the labour market that hinder them from reaching top-level positions and high earnings levels; the earnings advantage often observed for homosexual females in previous research is more likely to stem from the fact that female homosexuals devote more time to market labour than heterosexual females do.
Contact information
Ali Ahmed
Linnaeus University Centre for Labour Market and Discrimination Studies SE-351 95 Växjö, Sweden.
ali.ahmed@lnu.se Lina Andersson
Linnaeus University Centre for Labour Market and Discrimination Studies SE-351 95 Växjö, Sweden.
lina.andersson@lnu.se Mats Hammarstedt
Linnaeus University Centre for Labour Market and Discrimination Studies SE-351 95 Växjö, Sweden.
mats.hammarstedt@lnu.se
1. Introduction
An increasing amount of research in economics has focused on sexual orientation and labour market outcomes during the last twenty years. In the 1990s, Badgett (1995) conducted a pioneering study of earnings differentials between homosexuals and heterosexuals in the United States. Several subsequent studies reached the same conclusion: Homosexual men earn less than heterosexual men; homosexual females earn about the same, or sometimes more, than heterosexual females.1
Previous research on sexual orientation and earnings is limited in the sense that it had not been able to nail the explanations and mechanisms behind the results. One possible explanation for homosexuals’ earnings disadvantage compared to heterosexuals is discrimination. Field experiments conducted in different countries document the discrimination against homosexuals on both the labour and the housing markets.2 However, it has not been possible to draw such conclusions from previous studies regarding earnings differentials between homosexuals and heterosexuals conducted on register and survey data. One reason for this has been the lack of information about time devoted to market labour among the population under study. Thus, a documented earnings disadvantage for homosexuals might be a result of discrimination, but it might also stem from supply side factors that lead homosexuals, for different reasons, to devote less time to market labour than heterosexuals.3
In this paper we add to the literature on sexual orientation and earnings since we have access to data on yearly earnings as well as on full-time equivalent monthly earnings for a sample of homosexual and heterosexual individuals in Sweden for the year 2007.4 Since we have access to data on yearly earnings as well as monthly full-time earnings we will be able study both yearly earnings differentials and monthly full-time earnings differentials between homosexuals and heterosexuals. Thereby we will be able to elucidate if the differences in earnings between homosexuals and heterosexuals often documented in previous research remain when we control for time devoted to market labour, i.e., when we compare the full-time monthly earnings of homosexuals and heterosexuals.
Our data is obtained from the LISA data base at Statistics Sweden. We follow Ahmed and Hammarstedt (2010) and Ahmed, Andersson and Hammarstedt (2011a) and define homosexuals as individuals who are living in civil unions (registrerat partnerskap) in Sweden. The comparison group is made up of married heterosexual individuals. We have
1 For studies from the US, see Klawitter and Flatt (1998), Allegretto and Arthur (2001), Badgett (2001), Clain
and Leppel (2001), Carpenter (2005) and Zavodny (2008). For studies from the UK, see Arabsheibani, Marin and Wadsworth (2004, 2005). For a study from the Netherlands, see Plug and Berkhout (2004). For studies from Sweden, see Ahmed and Hammarstedt (2010) and Ahmed, Andersson and Hammarstedt (2011a). For a study from Greece, see Drydakis (2011).
2
For field experiment regarding hiring discrimination against homosexuals, see Adam (1981) for Canada, Weischselbaumer (2003) for Austria, Drydakis (2009) for Greece, Ahmed, Andersson and Hammarstedt (2011b) for Sweden. For field experiments on discrimination against homosexuals on the housing market, see Ahmed, Andersson and Hammarstedt (2008) and Ahmed and Hammarstedt (2010) for Sweden.
3 For a discussion about different kinds of specialisation towards market work and household within homosexual
and heterosexual households, see Ahmed, Andersson and Hammarstedt (2011a).
4 Monthly earnings include fixed wages, fixed increments, piece wages, variable wages, unsocial hours bonus,
compensation for risk and emergency duty, and weekend wage for red collars. In order to be comparable among workers with different working hours, the monthly earnings are weighted by Statistics Sweden to express
access to data for all individuals living in civil unions as well as all married individuals in Sweden for the year 2007.
Homosexuals in Sweden were allowed to enter into civil unions in 1995. Homosexual individuals who do so have the same legal rights and obligations as married heterosexuals.5 All individuals who enter civil unions are registered by Statistics Sweden.6 In addition to yearly earnings and full-time equivalent monthly earnings, we have information about age, gender, educational attainment, region of residence, and ethnic origin for all homosexual and heterosexual individuals in our sample. Further, we have information about the lines of business in which the individuals are active.
Our sample of individuals is constructed in the following way. We include all individuals aged 25 to 64 years who have had both positive annual earnings and positive monthly earnings in 2007. Data on monthly earnings is collected for all employees in the public sector and for a 50 per cent random sample of the total number of employees in the private sector. In total, our sample consists of 2,011 homosexual individuals and 1 024,173 heterosexual individuals.
We start the empirical part of our paper by analysing yearly earnings differentials between homosexual and heterosexual individuals. Here we arrive at the results often observed in previous research, namely that male homosexuals are at an earnings disadvantage compared to male heterosexuals but female homosexuals earn more than their heterosexual counterparts. We then turn our attention to full-time monthly earnings. Here, our results show that male homosexuals still are at an earnings disadvantage compared to heterosexual males. This disadvantage increases as we move up the earnings distribution, indicating that homosexual males face obstacles on the labour market that keep them from reaching top positions and the highest earnings levels. Among females, the earnings differential between homosexuals and heterosexuals is considerably smaller when we study monthly full-time earnings than when we study yearly earnings. Thus, the females earnings advantage often documented in previous research seem to a considerable extent to be driven by the fact that homosexual females devote more time to market labour than heterosexual females do.
The remainder of the paper is organised as follows. Some theoretical considerations are presented in Section 2. The data and descriptive statistics are presented in Section 3 while the empirical specifications and the results are presented in Section 4. Finally, Section 5 contains the conclusions.
2. Theoretical considerations
As mentioned in the introduction, there has been a remarkable consistency across different data and countries in findings in relation to the earnings differences between homosexual and heterosexual people; male homosexuals earn less than male heterosexuals while female homosexuals earn about the same, or sometimes more, than female heterosexuals. However,
5 Homosexual women living in civil unions also have the right to get inseminated or undergo in vitro fertilisation
at a Swedish medical service center.
6 For a discussion of economic motivations for entering civil unions, or registered partnerships, see Badgett, Gates and Maisel (2008).
there has been less consistency in the explanations of these findings.7 Two popular explanations, however, dominate the literature. The first explanation of the earnings differences has been that homosexual men are discriminated against because of the prejudice against them, while homosexual women are favored because they are believed not to adhere to traditional gender roles. This discrimination-based explanation usually draws from the economic theories of discrimination.8
The second explanation of the earnings differences originate from theory of specialisation within families.9 The story here is that in heterosexual households, men specialise in market labour while women specialise in household labour as a result of traditional gender roles or comparative advantages. Such specialisation does not occur to the same extent in homosexual households. According to this theory, homosexual males will therefore specialise less in market labor and homosexual women more, relative to their heterosexual counterparts.
Both explanations that we have briefly discussed here are consistent with the empirical evidence. However, the question that naturally follows is which of these competing explanations are plausible. Limited attention has been paid to this question in the literature. Although the explanations are not mutually exclusive, investigations should at least be able to elucidate if one explanation is more or less likely than the other, or if the empirical evidence suggests that both are likely. We make one such attempt in this paper.
Our empirical analysis of earnings differentials between homosexual and heterosexual people proceeds in two steps. We first estimate earnings differentials between homosexual and heterosexual people using yearly earnings data. Here, we expect to find the traditional earnings differential pattern as in the previous research. We then turn to the following question: Do these differences exist or change when we control for number of working hours? We are able to test this since we also have information on full-time equivalent monthly earnings from Statistics Sweden. In the second step, we estimate earnings differentials between homosexual and heterosexual people using data on monthly full-time equivalent earnings.
We believe there are good reasons for doing an exercise where you examine differences both using yearly earnings and full-time equivalent monthly earnings. First, it is worth investigating what happens to the earnings differentials when we switch from an analysis of yearly earnings to full-time monthly earnings. If the earnings differential between homosexuals and heterosexuals shrinks or disappears when we study monthly earnings compared to when we study annual earnings, the specialisation explanation would be supported. However, if we still observe differences between homosexuals and heterosexuals when we observe full-time earnings, the discrimination explanation would be supported. It could be a result of earnings discrimination and/or a result of segregation of homosexuals into occupations with non-discriminatory firms.
7 For more complete discussion about different explanations see, for example, Ahmed, Andersson and
Hammarstedt (2011a) and Badgett (2006).
8 See Becker (1957), Phelps (1972).
9
3. Data
We use data from the register-based longitudinal data base LISA (Longitudinal Integration Database for Health Insurance and Labour Market Studies) developed by Statistics Sweden. LISA contains information on everyone in Sweden, 16 years and older, and his or her demographic characteristics, labour market characteristics, and use of social benefits. We include all individuals aged 25-64 who were living in civil unions in Sweden in 2007. We also include all married individuals aged 25-64 in 2007. All individuals who were living in civil unions are defined as homosexual and all married individuals are defined as heterosexual. In total, there are 2,284,817 individuals after this selection out of which 4,934 are homosexual and 2,279,883 are heterosexual individuals.
Since the purpose is to study yearly and monthly earnings, we only include individuals with information on both variables in our empirical analysis. Yearly earnings are collected from the LISA database and are the individual’s income reported to the tax authorities. We obtain data on monthly earnings from the wage structure statistics (lönestrukturstatistiken) collected by Statistics Sweden for the National Mediation Office. The wage structure statistics contain information on, among other things, monthly earnings, hours of duty, and sector. Monthly earnings include fixed wages, fixed increments, piece wages, variable wages, penalty rates, and compensation for risk and emergency duty. In order to be comparable among workers with different working hours, the monthly earnings in the data are weighted to express
full-time equivalents. Data is collected yearly, in September for the private sector and in
November for the public, for all employees in the public sector and for a 50 per cent random sample of the total number of employees in the private sector.
We only include individuals with information on both yearly earnings and monthly earnings. After this selection is done, the sample consists of 1 058,113 individuals out of which 2,073 are homosexuals and 1 056,040 are heterosexuals.10 Out of these, 2,011 homosexual and 1,024,173 heterosexual individuals have both positive yearly and monthly earnings.11 As result of the sampling procedure of the statistics on monthly earnings, public employees are overrepresented in the sample but private employees will be underrepresented. Further, women are overrepresented in our sample since more women than men are active in the public sector.
Table 1 presents some descriptive statistics of our sample. It emerges that homosexuals are, on average, younger than their heterosexual counterparts. Further, homosexuals tend to have a higher educational attainment and are more likely to reside in metropolitan areas (Stockholm, Gothenburg or Malmö) than heterosexuals. In addition, Table 1 reveals that homosexual men and heterosexual males appear to concentrate in different business lines. Homosexual men are underrepresented in the manufacturing and construction sectors and are more likely to be employed in the health care and service sector. For women, differences by business line appear less pronounced. However, Table 1 shows that homosexual women are more likely to be employed in the service and public administration sectors; heterosexual women are overrepresented in the health care sector.12
10
Self-employed individuals are excluded from the sample.
11 See Appendix A for a description of the workers who have positive yearly earnings but are dropped due to missing information about monthly earnings.
12 All these results confirm what has been found in Ahmed and Hammarstedt (2010) and Ahmed, Andersson and
Table 1: Descriptive statistics of homosexuals and heterosexual individuals with positive yearly and monthly earnings (25–64 years of age) in 2007
Males Females
Homosexuals Heterosexuals Homosexuals Heterosexuals
Age (years) 45.9 47.9 40.6 47.5 Educational attainment (%) Primary school 6.1 12.7 2.7 8.9 Secondary school 39.6 50.4 32.7 45.5 University degree 54.3 36.9 64.6 44.6 Metropolitan area (%) 69.3 37.6 59.8 35.4 Northern Sweden 2.8 8.7 7.5 9.6
Children in the household 2.9 66.9 39.1 63.2
Immigrant background 20.6 14.7 10.0 13.9 Business line Agricultural 0.1 0.6 0.5 0.1 Manufacturing 7.0 29.2 7.9 7.8 Construction 2.0 7.3 1.8 1.3 Services 35.7 30.1 24.6 18.3 Health care 30.5 8.4 29.1 37.3 Public administration 12.1 10.9 14.5 9.8 Other 12.6 13.5 21.6 25.4 Number of individuals 944 420,998 1,067 603,175
Table 2 shows the average yearly earnings and monthly earnings (full-time equivalents) of the homosexual and heterosexual individuals in our sample. Nearly 99 per cent of the men and 96 per cent of the women have both positive annual and monthly earnings. There are practically no differences by sexual orientation in this regard. These numbers are relatively large, which is because that we only include individuals with information on monthly earnings and that the earnings are collected for employed individuals only.
Turning to differences in yearly average earnings, Table 2 reveals that homosexual men, on average, earned about SEK 365,100 in 2007 while heterosexual males earned about SEK 393,100. In other words, the yearly earnings of heterosexual males were, on average, about 8 per cent higher than those of homosexual men. Heterosexual males also appear to have had higher monthly earnings than homosexual men, SEK 31,900 compared to SEK 30,600, respectively. This corresponds to a difference of about 4 per cent, which is less than that observed for yearly earnings. For women, we observe the opposite pattern: in 2007 homosexual women appear to have had both higher yearly and monthly earnings than heterosexual women. Homosexual women earned about SEK 282,200 yearly compared to SEK 253,300 for heterosexual women, corresponding to a positive earnings differential of about 10 per cent. Finally, Table 2 indicates that the monthly earnings of homosexual women
were about 7 per cent higher than those of heterosexual women; SEK 26,200 and SEK 24,300, respectively.
Table 2: Average yearly and monthly earnings of homosexuals and heterosexual individuals (25–64 years of age) in 2007 Males Females Homo-sexuals Hetero-sexuals Hetero/ homo Homo-sexuals Hetero-sexuals Hetero/ homo Yearly earnings and monthly
earnings >0 (%) 98.3 99.2 1.009 95.9 95.5 0.996
Average yearly earnings (SEK) 365,120 393,110 1.077 282,160 253,330 0.898 Average monthly earnings
(SEK) 30,580 31,910 1.043 26,220 24,280 0.926
Number of individuals 944 420,998 1,067 603,175
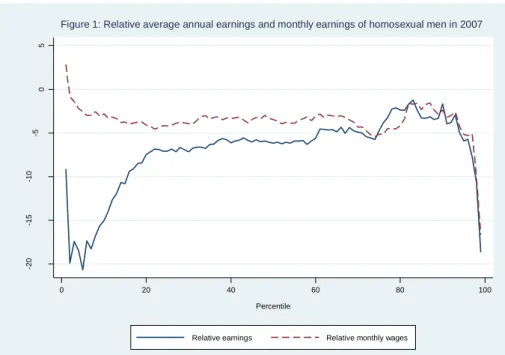
Figures 1 and 2 show the distributions of average yearly earnings and monthly earnings for men and women by sexual orientation. The figures show the percentage difference in yearly and monthly earnings between homosexuals and heterosexuals over the earnings distribution for men and women. Following Nguyen et al (2006), the percentage differences in yearly and
monthly earnings are calculated as follows: ((EarningsHomo–
EarningsHetero)/EarningsHetero)*100. The bold line in the figures shows the relative yearly
earnings for homosexuals and the broken line shows the relative full-time equivalent monthly earnings for homosexuals.
Figure 1 reveals that homosexual men are at an earnings disadvantage in relation to heterosexual men; the yearly earnings differential is negative over the earnings distribution and it decreases over the distribution up until the 90th percentile where it again increases sharply. The differential in monthly earnings between homosexual and heterosexual males is also negative over (most of) the earnings distribution but remains relatively constant at 4 per cent up until the 90th percentile where the differential increases, just as observed for yearly earnings. In the lower end of the distribution, the yearly earnings disadvantage of homosexual men is much larger than the corresponding difference in monthly earnings while the differentials are more similar in magnitude in the top of the distribution, from the 75th percentile onwards. This pattern suggests that the observed negative difference in yearly earnings between homosexual and heterosexual males may be somewhat explained by the fact that heterosexual males have longer working hours than homosexual men, at least at the lower end of the earnings distribution.
Turning to women, Figure 2 shows that lesbians are at an earnings advantage in relation to heterosexual women; the percentage difference in both average yearly and monthly earnings is positive over the entire distribution. The differential in yearly earnings is largest at the bottom of the distribution and decreases and remains fairly consistently between 10 and 14 per cent from the 20th percentile onwards. We observe the opposite pattern for monthly earnings; the differential is smallest in the lower end and upper end of the distribution but larger between the 15th and 90th percentile. In addition, the differential in monthly earnings is smaller than the differential in annual earnings over the entire distribution although the difference decreases somewhat over the distribution, with exception of the 90th percentile and above. Thus, just as for men, this indicates that the observed annual earnings differential between lesbian and heterosexual women may be somewhat attributable to the observation that homosexual women have longer working hours than heterosexual women, at least at the lower end of the distribution.
-20 -15 -10 -5 0 5 D iff er enc e ( % ) 0 20 40 60 80 100 Percentile
Relative earnings Relative monthly wages
Figure 1: Relative average annual earnings and monthly earnings of homosexual men in 2007
0 5 10 15 20 25 D iff er enc e ( % ) 0 20 40 60 80 100 Percentile
Relative earnings Relative monthly wages
4. Empirical specification and results
4.1 Empirical specification
We estimate traditional earnings equations by ordinary least squares (OLS) and quantile regressions. Each regression is estimated separately for males and females. The logarithm of yearly and full-time monthly earnings is our dependent variable; the variables presented in Table 1 enter our model as control variables. The full set of included variables is presented in Table B1 in Appendix B. First, our model is estimated by OLS for all individuals with log yearly earnings (ln yi) as the dependent variable as follows:
ln yi = + i Xi + iDi + i Zi + iHomosexuali + i
Then we estimate the same specification with full-time monthly earnings (ln wi) as the
dependent variable:
ln wi = + i Xi + iDi + i Zi + iHomosexuali + i.
In both specifications, is a constant term, and the vector Xi includes the human capital
variables age and educational attainment. The vector Di contains variables for area of
residence, incidence of children living in the household, and immigrant background. Vector Zi
includes controls for public sector, and branch of business. In the estimations of monthly earnings differential, we also include a control for if the job is a part-time position. Finally, the variable Homosexuali is a dummy variable indicating whether an individual is homosexual
or not with heterosexuals as the reference group.
Second, we estimate our model using quantile regressions.13 Quantile regression allows us to estimate the marginal effect of a covariate on log earnings at various points of the earnings distribution and not only the mean. Thus, quantile regressions enable us to estimate the effect of being homosexual on the logarithm of yearly and full-time monthly earnings at the bottom of the earnings distribution (e.g., at the 10th percentile), and at the top of the earnings distribution (e.g., at the 90th percentile). In our quantile regressions, the coefficient estimates are interpreted as the estimated effects of individual characteristics on the logarithm of earnings at the th quantile of the log earnings distribution.
We add the same control variables as in the OLS regression and estimate the model for the 10th, 50th, and 90th percentiles of the earnings distribution for men and women separately. We estimate four specifications. Specification A has no controls. Specification B includes the explanatory variables in vector Xi, Specification C the controls in vector Xi and Di, and finally
Specification D controls for the variables included in vectors Xi, Di, and Zi.
4.2 Yearly earnings differentials between homosexuals and heterosexuals
The results from the estimations of yearly earnings differentials between homosexuals and heterosexuals are presented in Table 3.14 The results from the OLS estimations show that
13 See Koenker and Basset (1978).
14
homosexual males earn about 10 per cent less than male heterosexuals. Thus, the result so often documented in previous studies – that male homosexuals are at an earnings disadvantage compared to male heterosexuals – are confirmed in our estimations.
Further, the results from Specification A confirm the pattern highlighted in Figure 1, namely that the earnings disadvantage for homosexual males decreases as we move up the earnings distribution. However, looking at the results from all other specifications, we find that even if the earnings differential between homosexual and heterosexual males is larger at the bottom than at the top of the earnings distribution there is still a considerable earnings gap between male homosexuals and male heterosexuals at the top of the earnings distribution. The gap at the 90th percentile amounts to about 10 per cent in Specification D.
Turning to females, the results also tend to confirm the results from previous research: that female homosexuals are at an earnings advantage – approximately 10 per cent – compared to female heterosexuals. Further, the results from Specification A show that female homosexuals are at an unadjusted earnings advantage compared to female heterosexuals, a pattern that was highlighted in Figure 2.
According to the result from Specification D, we find that the earnings advantage for homosexual females remains across the entire earnings distribution even when we add full controls. Female homosexuals earn about 6 per cent more than female heterosexuals at the 90th percentile of the earnings distribution.
Table 3: Estimation results from OLS and quantile regressions for annual earnings (10th, 50th and 90th percentile, respectively) Males Females OLS Q10 Q50 Q90 OLS Q10 Q50 Q90 Specification A (no controls) Homosexual –0.0750*** (0.0163) –0.1719*** (0.0408) –0.0642*** (0.0114) –0.0146 (0.0299) 0.1099*** (0.0180) 0.1159*** (0.0365) 0.1039*** (0.0113) 0.1221*** (0.0245) R2 0.0001 0.0001 0.0000 0.0000 0.0001 0.0000 0.0001 0.0001 Specification B
(controls for variables in vector Xi)
Homosexual –0.1252*** (0.0155) –0.1841*** (0.0340) –0.1354*** (0.0122) –0.0722*** (0.0278) 0.1480*** (0.0170) 0.1824*** (0.0391) 0.1312*** (0.0105) 0.0988*** (0.0223) R2 0.0992 0.0315 0.0559 0.1178 0.1028 0.0735 0.0722 0.0788 Specification C
(controls for variables in vector Xi and Di)
Homosexual –0.1402*** (0.0152) –0.1780*** (0.0343) –0.1517*** (0.0131) –0.1095*** (0.0222) 0.0880*** (0.0169) 0.1426*** (0.0495) 0.0728*** (0.0104) 0.0812*** (0.0173) R2 0.1418 0.0605 0.0805 0.1456 0.1172 0.0789 0.0820 0.1106 Specification D
(controls for variables in vectors Xi, Di and Zi)
Homosexual –0.0950*** (0.0147) –0.0911*** (0.0372) –0.0905*** (0.0099) –0.1097*** (0.0209) 0.0741*** (0.0165) 0.1092*** (0.0450) 0.0523*** (0.0120) 0.0604*** (0.0140) R2 0.4478 0.0955 0.1249 0.1835 0.1576 0.0885 0.1174) 0.1912 Number of observations 421,942 604,242
4.3 Full-time monthly earnings differentials between homosexuals and
heterosexuals
Table 4 shows the results from the estimations of monthly full-time earnings differentials between homosexuals and heterosexuals.15 The results reveal that male homosexuals are at a full-time earnings disadvantage compared to male heterosexuals. Looking at the results from Specification D, the OLS estimation shows that homosexual males are at a 7 per cent earnings disadvantage compared to heterosexual males. This could be compared to a 10 per cent earnings disadvantage in yearly earnings for homosexual males.
Looking at different parts of the earnings distribution, we find that the earnings disadvantage for homosexual males amount to about 2 per cent at the 10th percentile. This disadvantage increases as we move up the monthly earnings distribution and amounts to approximately 5 per cent and 7 per cent at the 50th and 90th percentiles, respectively. Thus, the pattern looks different from the pattern we found for yearly earnings. The fact that the earnings disadvantage of male homosexuals increases as we move up along the earnings distribution, when we observe full time earnings, indicates that homosexuals faces obstacles on the labour market, such as different kinds of discrimination, that prevent them for reaching positions that bring higher earnings.
Among females, the earnings situation for homosexual females looks strikingly different when we study monthly full time as opposed to yearly earnings. Specification A confirms the pattern highlighted in Figure 1: that female homosexuals are at an earnings advantage along the entire earnings distribution. However, when we control for all background variables available in Specification D, there are very small differences between homosexual and heterosexual females. The only statistically significant difference between homosexual and heterosexual females is found at the 90th percentile. Homosexual women earn about 5 per cent more than female heterosexuals at the top of the earnings distribution. This results is in line with previous research: homosexual females to a larger extent than heterosexual females are reaching management positions or those that demand a high educational attainment.16
15 The results from the full estimations are available from the authors upon request. 16
Table 4: Estimation results from OLS and quantile regressions for monthly earnings (10th, 50th and 90th percentile, respectively) Males Females OLS Q10 Q50 Q90 OLS Q10 Q50 Q90 Specification A (no controls) Homosexual –0.0362*** (0.0121) –0.0284*** (0.0101) –0.0339*** (0.0115) –0.0204 (0.0287) 0.0776*** (0.0080) 0.0591*** (0.0137) 0.0820*** (0.0077) 0.1053*** (0.0205) R2 0.0000 0.0000 0.0000 0.0000 0.0002 0.0001 0.0001 0.0001 Specification B
(controls for variables in vector Xi)
Homosexual –0.0861*** (0.0111) –0.0463*** (0.0103) –0.0979*** (0.0120) –0.0812*** (0.0343) 0.0487*** (0.0070) 0.0260*** (0.0090) 0.0533*** (0.0053) 0.0848*** (0.0231) R2 0.1590 0.0465 0.0827 0.1279 0.2246 0.1307 0.1690 0.1157 Specification C
(controls for variables in vectors Xi and Di)
Homosexual –0.1027*** (0.0107) –0.0487*** (0.0077) –0.1113*** (0.0097) –0.1155*** (0.0205) 0.0209*** (0.0068) 0.0080 (0.0083) 0.0268*** (0.0073) 0.0496** (0.0194) R2 0.2220 0.0875 0.1182 0.1630 0.2699 0.1595 0.1884 0.1639 Specification D
(controls for variables in vectors Xi, Di and Zi)
Homosexual –0.0694*** (0.0102) –0.0152* (0.0080) –0.0473*** (0.0116) –0.0705*** (0.0260) 0.0101 (0.0063) –0.0027 (0.0067) 0.0020 (0.0075) 0.0472*** (0.0179) R2 0.2988 0.1447 0.1793 0.2165 0.3802 0.1894 0.2641 0.2893 Number of observations 421,942 604,242
5. Conclusions
This paper has focused on earnings differentials between homosexuals and heterosexuals on the Swedish labour market. First, we paid attention to yearly earnings differentials between homosexual and heterosexual males and females. The results of our empirical analysis confirmed previous research from several countries, to the effect that male homosexuals are at an earnings disadvantage compared to male heterosexuals but that female homosexuals earn more than female heterosexuals.
Our attention then turned to full-time monthly earnings, i.e. we studied earnings among homosexuals and heterosexuals with the same number of hours worked. The results of these estimations showed both similarities and differences compared to the results from the estimations of yearly earnings differentials. The results were similar in the sense that homosexual males still were at an earnings disadvantage compared to heterosexual males. The observed differential due to sexual orientation for monthly full-time earnings was smaller than the observed yearly earnings differential at the lower end of the earnings distribution but increased as we moved up the earnings distribution. Thus, the results indicate that male earnings differentials attributable to sexual orientation among low-income earners are to a large extent driven by supply-side factors such as differences between homosexuals and heterosexuals in terms of the time that they dedicate to market labour. However, our results also give us reason to believe that different kinds of discrimination and segregation into certain occupations are factors in labour market success among homosexual males. The results indicate that male homosexuals encounter obstacles on the labour market that prevent them from reaching top-level and high-earning positions. It is well known that heterosexual females also face ‘glass ceilings’ on the labour market that keep them from reaching high-earning and management positions.17 Our results reveal that homosexual males and heterosexual females face similar obstacles on the labour market.
As regards females, our results show that the earnings differential between homosexual and heterosexual are very small when we study full-time earnings. Thus, the earnings differential between homosexual and heterosexual females often observed in previous research are to a large extent explained by differences in the number of hours that they worked. However, homosexual females are at a full-time monthly earnings advantage compared to heterosexual females at the top of the earnings distribution. Traditional gender roles may play an important role, suggesting that homosexual females are more devoted to job and career than heterosexual females who have traditionally assumed a greater responsibility for home, family and children.
To sum up, our study sheds new light on and explains earnings differentials attributable to sexual orientation. We have found that supply- as well as demand-side factors are determinants of the earnings between homosexuals and heterosexuals often observed in previous research. Future research on sexual orientation and labour market outcomes should therefore focus on the existence and the magnitude of discrimination as well as on which factors determines the supply of market labour among homosexual households.
17
References
Adam, B. D. (1981). Stigma and employability: Discrimination by sex and sexual orientation in the Ontario legal profession. Canadian Review of Sociology and
Anthropology 18(2), 216–221.
Ahmed, A.M. & Hammarstedt, M. (2009). Detecting discrimination against homosexuals: Evidence from a field experiment on the Internet. Economica 76(303), 588–597.
Ahmed, A.M. & Hammarstedt, M. (2010). Sexual orientation and earnings: A register data-based approach to identify homosexuals. Journal of Population Economics 23(3), 835–849.
Ahmed, A.M., Andersson, L. & Hammarstedt, M. (2008). Are lesbians discriminated against in the rental housing market: A correspondence testing experiment. Journal of
Housing Economics 17(3), 234–238.
Ahmed, A.M., Andersson, L. & Hammarstedt, M. (2011a). Inter- and intra-household earnings differentials among homosexual and heterosexual couples. British Journal of
Industrial Relations 49(s2), s258–s278.
Ahmed, A.M., Andersson, L. & Hammarstedt, M. (2011b). Are homosexuals discriminated
against in the hiring situation?. EALE conference paper.
Ahmed, A.M., Andersson, L. & Hammarstedt, M. (2011c). Sexual orientation and occupational rank. Economics Bulletin 31(3), 2422–2433.
Albrecht, J., Björklund, A., & Vroman, S. (2003). Is there a glass ceiling in Sweden?.
Journal of Labor Economics 21(1), 145–177.
Allegretto, S.A. & Arthur, M.M. (2001). An empirical analysis of homosexual/heterosexual male earnings differentials: Unmarried or unequal?. Industrial
and Labor Relations Review 54(3), 631–646.
Arabsheibani, G.R., Marin, A. & Wadsworth, J. (2004). In the pink: Homosexual-heterosexual wage differentials in the UK. International Journal of Manpower 25(3/4), 343–354.
Arabsheibani, G.R., Marin, A., Wadsworth, J. (2005). Gay pay in the UK. Economica 72(286), 333–347.
Badgett, M.V.L. (1995). The wage effects of sexual orientation discrimination.
Industrial and Labor Relations Review 48(4), 726–739.
Badgett, M.V.L., Gates, G.J. & Maisel, N.C. (2008). Registered partnerships among gay men and lesbians: the role of economic factors. Review of Economics of the Household 6(4), 327–346.
Becker, G.S. (1957). The Economics of Discrimination. University of Chicago Press, Chicago.
Becker, G.S. (1981). A Treatise on the Family. Harvard University Press, Cambridge. Blau, F. & Kahn, L. (1996). Wage structure and gender earnings differentials:
nn international comparison. Economica 63(250), s29–s62.
Carpenter, S.C. (2005). Self-reported sexual orientation and earnings: Evidence from California. Industrial and Labor Relations Review 58(2), 258–273.
Clain, S. H. & Leppel, K (2001). An investigation into sexual orientation discrimination as an explanation for wage differences. Applied Economics 33(1), 37–47.
Drydakis, N. (2009). Sexual orientation discrimination in the labour market. Labour
Economics 16(4), 364–372.
Drydakis, N. (2011). Women’s sexual orientation and labor market outcomes in Greece.
Feminist Economics 17(1), 89–117.
Klawitter, M.M. & Flatt, V. (1998). The effects of state and local antidiscrimination policies for homosexual men and lesbians. Journal of Policy Analysis and Management 17(4), 658–686.
Koenker, R.& Basset, G. (1978). Regression quantiles. Econometrica 46(1), 33–50. Ngyuen, B.T., Albrecht J.W., Vroman, S.B. & Westbrook, D.M. (2006). A quantile regression decomposition of urban-rural inequality in Vietnam. Journal of Development
Economics 83(2), 466–490.
Phelps, E.S. (1972). The statistical theory of racism and sexism. American Economic
Review 62(8), 659–661.
Plug, E. & Berkhout, P. (2004). Effects of sexual preferences on earnings in the Netherlands. Journal of Population Economics 17(1), 117–131.
Zavodny, M. (2008). Is there a ´marriage premium´for gay men?. Review of Economics
of the Household 6(4), 369–389.
Weichselbaumer, D. (2003). Sexual orientation discrimination and hiring. Labour
Appendices
Appendix A
Table A1: Descriptive statistics of homosexual and heterosexual individuals with positive yearly earnings and missing value on monthly earnings (25–64 years of age) in 2007
Males Females
Homosexuals Heterosexuals Homosexuals Heterosexuals
Age (years) 44.1 47.2 39.6 45.3 Educational attainment (%) Primary school 13.3 19.1 13.0 15.6 Secondary school 49.1 58.5 48.8 55.3 University degree 37.6 22.4 38.2 29.1 Metropolitan area (%) 73.6 40.7 56.5 43.9 Northern Sweden 1.2 7.6 8.0 7.1
Children in the household 2.7 65.1 33.5 64.5
Immigrant background 31.2 17.7 21.3 19.5 Business line Agricultural 0.8 1.2 1.1 0.8 Manufacturing 8.5 21.3 9.0 12.2 Construction 1.5 12.7 2.0 2.1 Services 70.3 56.8 42.0 58.5 Health care 9.2 2.6 12.1 13.3 Public administration 1.8 1.2 1.1 1.8 Other 6.2 3.3 7.2 9.9 Missing 1.7 0.9 25.5 1.4 Number of individuals 660 392,866 809 271,000
Appendix B
Table B1: Explanatory variables used in the OLS and quantile regressions
Variable Explanation
Dependent variables
ln earningsi Log yearly earnings in 2007
ln wi Log monthly full-time earnings in 2007
Independent variables
Vector Xi
Age Continuous
Age squared / 100 Continuous Primary school Reference
Secondary school 1 if secondary school, 0 otherwise University degree 1 if university degree, 0 otherwise
Vector Di
Metropolitan area 1 if living in the region of Stockholm, Gothenburg or Malmö, 0 otherwise Northern region 1 if living in the northern region of Sweden, 0 otherwise
Southern and central Sweden Reference
Children in the household 1 if resident children in the household, 0 otherwise Immigrant 1 if immigrant background, 0 otherwise
Vector Zi
Part-time position 1 if hours of duty is less then 100 %, 0 otherwise Agriculture 1 if active in the agricultural sector, 0 otherwise Manufacturing 1 if active in the manufacturing sector, 0 otherwise Construction 1 if active in the construction sector, 0 otherwise Services 1 if active in the services sector, 0 otherwise Health care 1 if active in the health care sector, 0 otherwise Public administration 1 if active in the public administration sector, 0 otherwise
Other Reference