1
Paper Submittedto:
The 25th European Regional Conference of the International Telecommunications Society, Brussels, Belgium, 22nd - 25th June 2014
The Incentives and Challenges of Delivering Linear Broadcasting
Services over Cellular Network in Developing Countries
-
Sudan as Case study-
Authors:
Ashraf Awadelkarim Widaa Ahmed, Jan Markendahl and Amirhossein Ghanbari
ahmed2@kth.se, janmar@kth.se and amigha@kth.se
Wireless@KTH, KTH Royal Institute of Technology, Electrum 229, SE-164 40 Kista, Sweden Abstract
The Broadcasting sector has been evolved in terms of service production, transmission platform and reception devices in the last few decades. In contrast to cable and satellite platform, which are suitable for fixed reception only, the terrestrial digital platform can support portable, mobile and fixed reception scenarios. In general, there are two options of mobile multimedia service; one is based on a mobile communication network with IP cast known as MBMS (Multimedia Broadcast Multicast Services), while the other is based on broadcast technology. In the context of convergence, the players in the mobile sector argues that unlike traditional mobile network systems, where the use was restricted to a given application, emerging mobile networks will be able to carry a variety of services and accordingly separate broadcasting networks will no longer be required. In line with argument, it is not economically viable to roll out dedicated wireless broadband networks by the broadcasters to meet the increasing demand for interactive broadcasting services. That is why the broadcasters may look for innovative mechanism to deliver the broadcast services over mobile broadband network owned by the telecommunication operators.
The focus on this paper is to investigate the incentives and challenges for such trend in developing countries; taking Sudan as case study. The main conclusion in this paper indicate that a potential economic incentive for delivering the broadcasting service over cellular network in Sudan subject to the deployment of high efficient mobile network. Moreover, the mobile operators may consider support such approach considering the increase demand for additional frequency resource. However, the key challenges remain in how to develop a suitable regulations landscape to assure fair and competitive business practices on hand while guaranteeing the continuation of the public broadcasting service. In this regard, a new regulation framework needs to be developed to separate the three key functions in digital terrestrial broadcasting value chain (namely the content production and distribution). Further on, the necessary interconnection regulations need to put on place in order to pave the way for rollout of common platform that are necessary for interactive and nonlinear services.
2
1 Introduction
The increasing consumer demand for interactive multimedia services and non-linear content alongside "live" broadcasting anywhere and at any time, drive new business model for MNOs and actors in broadcasting sector (ericsson White paper, 2013). MNOs relaying on the advances in the mobile network standards (such as LTE) have the capabilities of delivering variety of broadcasting services based on the underline broadcast/multicast functionality in their cellular network ( Shi, et al., 2014). Nowadays; mobile network operators (MNOs) around the globe are probing the potential opportunities of delivering non-linear content alongside "live" broadcasting as means to grow their revenue. In this connection, South Korean operator KT has announced the commercial launch of its evolved Multimedia Broadcast and Multicast Service (eMBMS) in early 2014 (Sahota, 2014). Likewise, the technological advances in the broadcasting sector, such as the transition from analogue to digital terrestrial broadcasting, open the opportunity to deliver variety of interactive broadcasting services as well as internet access (EBU, 2011). However, the transition to digital terrestrial broadcasting network transition proof to be a costly and lengthy process, especially when it comes to the provision of the end-users equipment’s. Accordingly considerable number developing countries, especially in Africa, are still at the early phases in the transition to the terrestrial digital broadcasting (APC, 2011).
Due to the ongoing technological convergence, the boundaries among previously separate services in ICT sector are diminishing. Yet, the implementation of the convergence-concept is challenged by different implications not only on technical level, but also on the policy/regulations and business model formulation levels. In this regard, a persistency to maintain a clear regulations and licensing distinctions between different types of technologies and services, namely between broadcasting and telecom services can be perceived. An evident for such persistency can be deduct from the ongoing discussion among players in the telecoms and the broadcasting sectors about who will get access to the new spectrum resources that emerge as result of the digital transition process, known as digital dividend. The players in the telecoms and mobile sectors, like the broadcasting sector, regard digital dividend spectrum in ultra-high frequency band (UHF) as means to build their distinct delivery platform for the provision of mobile broadband, broadcasting and multimedia services (ICT Regulation Toolkit, 2004) (ITU-D, 2012).
Number of publications addresses the technical and business aspects of using common cellular platform for distributing the linear and non-linear broadcasting services. For example, the authors in ( Shi, et al., 2014), investigate the technical feasibility and potential economic benefits of replacing the current terrestrial VHF/UHF TV broadcasting system with a mobile, cellular data (IP). The investigation in ( Shi, et al., 2014) considers typical Swedish rural and urban environments and different models for TV viewing patterns beside the expected advances in
3
cellular technologies up to year 2020. The study indicates that the distribution of broadcasting services over cellular TV can be beneficial if the current trend towards more specialized programming, more local contents, and more on-demand services continues. Likewise in (ECC, 2013), the Electric Communication Committee (ECC), one of the European Union arms, conducted feasibility study of delivering the broadcasting services over cellular network (namely LTE eMBMS) compared to the use of the current digital terrestrial broadcasting network (i.e. Digital Video Broadcasting - Terrestrial, second generation or in short DVB-T2) in terms of the efficient use of the spectrum and the deployment cost. The Authors in (ECC, 2013) indicate that by considering the situations in a typical European country (namely Germany); the provision of linear broadcast TV over today cellular network is not viable in terms of spectrum utilization and deployment cost. On other hand, the authors in ( Laili, et al., 2012), investigate the interaction and business relationship between the over the top (OTT) players, TV broadcasters and telecom operators. The Indonesian telecom market is used as case study in (Laili, et al., 2012), where the possible reaction strategies of the telecom operators to the OTT TV/video services is investigated and identified.
The aim of this paper is to investigate the incentives and challenges for using common cellular platform for the provision of mobile broadband, broadcasting and multimedia services in developing countries. The main focus is to assess the technical and economic feasibility; however the possible transformation in the business models for all the involved actors’ along with the anticipated changes in regulation landscape will be discussed as well. In this regard we aim to answer the following two questions;
RQ1: What are the incentives and challenges of delivering the broadcasting Services over cellular network?
RQ2: Could all the parties benefit from such approach or not? How the regulations and market conditions in the developing countries work for or against such approach?
2 Methodology
A quantitative research approach has been adopted in this study in order to investigate and answer the proposed research questions. In this regard a techno-economic analysis will performed to investigate the economic incentive of using today cellular network for delivering broadcasting services in comparison to a dedicated digital terrestrial broadcasting infrastructure. The techno-economic study will be conducted considering a case of developing country without a digital terrestrial broadcasting infrastructure; namely Sudan. Moreover, a qualitative study will be adopted to complement and enrich the discussion. The qualitative analysis is based on literature review and semi-structured interviews with representatives from regulatory authority, broadcasting sector and mobile operators in Sudan.
4
3 Developments in Broadcasting Services
Prior to year 1980, the signals broadcast were analog and the broadcasting services are delivered via a dedicated platform to end-user (viewer and listener). At that time was no much choices with regard to the devices that are used for listening to the radio or watching television. That is why all broadcasters provided free-to-air services based on vertically integrated value chain depend on three main transmission platforms; namely satellite, cable and or terrestrial (over the air). In the analogue broadcasting era, the value added by the transport network and signal transmission is considerably lower than that of programmer and content production (ITU, February 2013).
The transition to the digital broadcasting technologies fuel the competition between traditional platforms namely satellite and terrestrial broadcasting networks (i.e. cable and over-the-air transmission) and open the door for new delivery platform over IP network. Nowadays, in addition to the linear broadcasting services such as IPTV, digital terrestrial broadcasting services (cable and over-the-air) and satellite broadcasting services, a new services known as nonlinear broadcasting services is emerged. The nonlinear broadcasting services refer to the reception of audiovisual content in a non-continual manner; where the end-user can demand, control the view of the audiovisual content based on her/his convenient. In some cases non-linear service offers can also be realized by using receiving devices equipped with suitable storage and software technologies that enable creation of personal media archives. The content can be stored during linear transmissions and used later in a non-linear fashion. Access to non-linear services normally requires a return channel and some degree of interactivity. In recent years, the non-linear media services witnessed a significant growth in the European Union (EU) as shown in Figure 1.
Figure 1: Evolution of TV viewing in Germany, France, Italy, Spain and the UK, Source: IHS - Screen Digest: Cross-platform Television Viewing Time FY 2012 (Forecast for 2020 by EBU)
218 217 217 219 219 226 230 233 232 232 231 230 225 0.5 1.0 2.2 4.1 6.8 10.2 13.6 17.5 22.0 25.5 29.1 32.5 48 0 50 100 150 200 250 300 2005 2006 2007 2008 2009 2010 2011 2012 2013 2014 2015 2016 - - - 2020* M inute s per per son per day
5 3.1 Changes in the Broadcasting Value Chain
The transition to digital technology and IP-based platform has changed the value chain of the broadcasting in both of the production and distribution side. As result, the traditional public broadcasters (with a free to air business model) have faced competition from new terrestrial, cable and satellite operators offering free to air (FTA) and pay-TV services. Further on, the IP-based broadcasting services open the door for number of non-traditional broadcasting players to establish business to consumer (B2C) (EBU, 2013) (ECC, 2013). In the face of higher competition, the quality of content became increasingly important in both of the production and distribution sides. In this regard, the supply chain of the digital broadcasting services has evolved to included multitude of functions and multitude of services which open the door for the involvement of many actors as shown in Figure1 (Mohamudally, 2011) (EBU TECHNICAL, 2011) (Plum Consulting, January 2014). Nowadays the main actors in the broadcasting services value chain can be classified into four categories namely the Content Providers (CP), Content Aggregators (CA), Network Facilities Provider (NFP) and Receivers Manufacturers and Equipment Vendors (ITU-R, 2013). The Content Providers (CP) owns the copy right of the content and should be compensated for the usage of the content. CP could be individual such as signers or cooperation such as traditional broadcasters and movie-based content owner (e.g. HBO, Disney etc.). Content Aggregator (CA) is an actor who owns the multiplexer (MUX), The CP provides access to “Multiplexer” to aggregate content. The Network Service Provider (NSP) is actor who owns and operates the transport network between the production sites and transmission site. Network Facilities Providers (NFP) provides network of transmitters throughout the country; a NFP can be broadcaster with transmission facilities; owning the transmitters sites (TX) or mobile network operators. Manufacturers and vendors are the actors who manufacture consumer devices and digital professional system components in production, transmission and reception sides.
Linear Service
Non Linear Service
Traditional Broadcaster
- Satellite - Cable - Terrestrial
IPTV
Professional OTT Actors - Video on demand - e.g. Netflix Individual users - Web-Sites Etc. MUX Operators (Broadcasting) Telecom Operators Dedicated Broadcasting Platform - Satellite - Terrestrial Multi-purpose Telecommunications - Fixed operators - Mobile operators Common platform Broadcasting transmission Broadcasting Platform - Satellite - Terrestrial Broadband access Telecommunications - Fixed operators - Mobile operators Common platform Conventional devices Uni-directional receiver - Radio - TV - IPTV decoder Multi-purpose devices Bi-directional devices - Smartphone - Tablets - Notebooks, etc. Broadcasting Content aggregation Multimedia aggregation
6 3.2 Market, Policy and Regulations Trends
There is a growing international bandwagon to allocate considerable part of the Ultra-High Frequency (UHF) spectrum bands to mobile services. In this respect ITU in in year 2007 (WRC-07), has already allocate the upper part of the UHF band (790–862 MHz) to the mobile service in Region 1 as from 2015, and allowed some countries of this region to use this allocation immediately, under certain conditions. These conditions include protection of the existing broadcasting services agreement and all its future developments. Countries that wish to implement mobile services in the band 790–862 MHz are required to protect broadcasting services against harmful interference. Furthermore the WRC-12 concluded with a decision to create a new mobile allocation in the band 694-790 MHz in ITU Region 1, which is proposed to come into force in year 2015 in order to enable the necessary technical studies to be concluded which is known as the second digital dividend. However, there are conflicting interests between the broadcasters and the mobile operators on many issues making it impossible to predict what kind of final decision would be taken at WRC-15 on the matter.
The broadcasting operators are not prepared yet to abandon their frequencies in UHF bands where they operate on primary basis; which considered as the main tool to compete with satellite, cable and IPTV, they would like to distribute the maximum possible number of high definition (HD) channels, which take up more frequency resources. In this regard, the mobile multimedia broadcasting service is one of the key features added by the digital terrestrial broadcasting compared to other broadcasting platforms. In a way the public broadcasters will require a significant assurance and arrangements to free around 300-375 MHz of frequencies currently allocated to terrestrial broadcasting for common future use. While, the policy-makers are concerned about the capability of the future mobile broadband network (evolved 4G or 5G) to distribute public service TV broadcasting in more efficient way than dedicated territorial platform, and about the possible implications on regulations of both of telecom and broadcasting sector. Here the principal objective of National regulators is to assure the delivery of broadcast services to all population especially the continuation of free-to-air public broadcasting services over future platforms. In this regard, the regulatory framework needs to evolve in order to address the interconnection issues between the broadcasters and the mobile operators as well as the spectrum allocation issue.
4 Sudan as Case Study
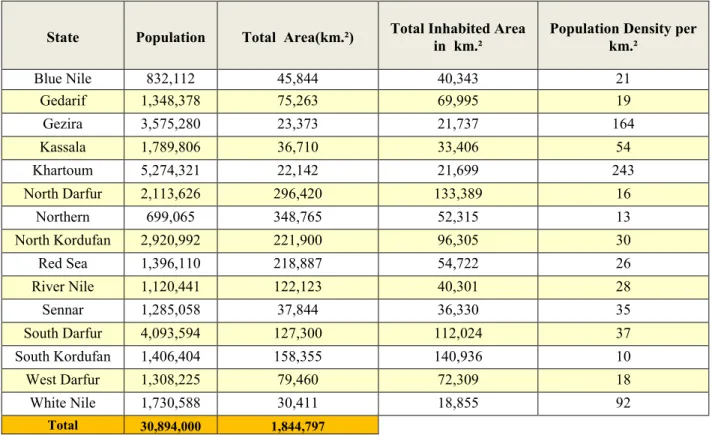
Sudan ( Republic of the Sudan ), with a total area of about 1,844,797 square kilometers, is currently the third largest country in Africa , next to Algeria and Congo , and the 16th country in the world. Sudan population estimates to be around 30,894,000 inhabitants (without including the population in South Sudan which is estimated to be around 8.26 million) with an annual growth rate of about 2.1% on average. More than 70% of this population is living in the towns and rural
7
areas outside the capital, Greater Khartoum. The population’s distribution per each state/province is estimated as shown in Table 1 as well as their density per square kilometers, these estimations will be used as input for the quantitative study conducted within the scope of this paper (wikipedia, 2011) ((NTC), 2011) (worldbank, 2012).
Source of the Data: (statoids, 2014)
State Population Total Area(km.²) Total Inhabited Area in km.² Population Density per km.²
Blue Nile 832,112 45,844 40,343 21 Gedarif 1,348,378 75,263 69,995 19 Gezira 3,575,280 23,373 21,737 164 Kassala 1,789,806 36,710 33,406 54 Khartoum 5,274,321 22,142 21,699 243 North Darfur 2,113,626 296,420 133,389 16 Northern 699,065 348,765 52,315 13 North Kordufan 2,920,992 221,900 96,305 30 Red Sea 1,396,110 218,887 54,722 26 River Nile 1,120,441 122,123 40,301 28 Sennar 1,285,058 37,844 36,330 35 South Darfur 4,093,594 127,300 112,024 37 South Kordufan 1,406,404 158,355 140,936 10 West Darfur 1,308,225 79,460 72,309 18 White Nile 1,730,588 30,411 18,855 92 Total 30,894,000 1,844,797
Table 1: The Population’s Distribution per each state/province1
4.1 Status of the Broadcasting Sector in Sudan
Sudan had known the analogue terrestrial broadcast transmission since 1940, the broadcasting sector in Sudan falls, at present, within the portfolio of the minister in charge of Information. Sudan National TV Broadcasting (SNTBC) and Sudan National Radio Broadcasting Corporation (SNRBC) which are government-owned entities that supervise and monitor all radio
1 Recently Darfur has been re-structured to include another two states more East Darfur, Central Darfur and likewise
Kordufan region has been re-structured to include another state, namely West Kordofan. Nowadays, Sudan is divided into 18 WILAYAT(states).
8
and TV programming. The state-owned Sudan Radio and Television Corporation (SRTC), is the only broadcaster with transmission facilities within Sudan. SRTC act as signal distributors who avail their technological capacities for signal distribution to licensed broadcasters upon their request on an equitable non- discriminatory basis. Since Sudan is a multi-cultural and multi-racial society, it holds a cultural heritage that is very rich in various customs and traditions, number of public and private TV and radio stations in operation throughout the country.
In the Sudan today, there are around 19 local television stations in different states to meet the needs of the people there, as well as a satellite channel, a national channel and other specialized channels (e.g. sports, religious and education). The process of obtaining a new broadcast (TV or Radio) license in Sudan starts with an application to the broadcasting regulatory in Sudan, namely the National Broadcasting Regulation Assembly (SNBRA) to secure his approval on the intended programming content. Based on this approval, the telecom regulatory authority (NTC) allocates the necessary frequency band(s). This licensing process is considered to be somewhat cumbersome, time consuming and quite inefficient in today’s era of liberalization, digitization and convergence of telecommunications, broadcasting and information technologies and services. In particular, the arising and increasing difficulty to differentiate between the radio spectrum used for telecommunications and that used for broadcasting and other services points to the pressing need to merge the separate regulatory authorities of telecommunication and broadcasting in Sudan into a new authority regulating both area. Moreover, a license to provide broadcast service does not mean that the programming can automatically be distributed and separated agreement with the signal distribute need to be reached. In other words, to be able to distribute the programming, the media service provider must enter into a signal distribution agreement with one of the available signal distributors for the transmission of his licensed content (i.e. SRTC in case of the terrestrial broadcasting services).
The Terrestrial broadcasting services play a key role in Sudan. According to study conducted by the ITU around 50% of the population in Sudan receives television services by terrestrial broadcasting (ITU-R, 2014). Sudan National transition plan to digital Terrestrial Broadcasting has been in place according to Geneva agreement of 2006 (GE 06) which has been resulted from the Regional Radio Communication Conference of 2006 (RRC 06) for countries in Region 1 (Europe, Africa and the Middle East and Region 3 (Islamic Republic of Iran). The GE-06 Regional Broadcasting Agreement is based on T-DAB for radio and DVB-T for digital television broadcasting and stipulates the following main points (ITU-R, 2013) (ITU-R, 2006):
Band III (174-230 MHz) is allocated for Terrestrial Digital Video Broadcasting DVB-T and Terrestrial Digital Audio Broadcasting (T-DAB) planning.
9
Bands IV & V (470-862 MHz) are allocated for terrestrial- Digital video broadcasting (T-DVB) with four reception modes of fixed, mobile, portable indoor and portable outdoor.
The set international switch-over date to terrestrial digital broadcasting systems by GE06 is June 2015, however analog TV broadcasting will be protected up to year 2020 upon the request of a number of African and Middle East countries in very high frequency (VHF), i.e. Band III from 174 to 230 MHz.
In spite of the existing digital terrestrial plan since 2006, the digital terrestrial broadcasting services aren’t operational yet in Sudan as well as in many other African countries as shown in Figure 3.That is why the Digital satellite television broadcasting is widely used in the Sudan and the number of terrestrial television viewers has fallen drastically as households switch to the wider choices and richer content of satellite television (AUC, 2012).
Figure 3: Status of African Union Member States (MS) (AUC, 2012)
4.2 Sudan Mobile Broadband Market
The mobile subscription in Sudan have witness tremendous growth to reached more 25 million (around 81% penetration rate) by the end of 2013. However, some estimation indicate that roughly third of the population in Sudan is still without a mobile subscription, leaving much room for growth fuelled by the explosion demand for mobile data and the advance capabilities appear on increasingly affordable handsets (GSMA, 2013). While the fixed telephony services
10
have witnessed a continuous decrease to reach less than half a million subscription (around 1% penetration rate). Moreover, the broadband connections remain relatively low with around one million broadband users (3%) which mainly provided through mobile broadband connectivity. However, the number of internet users are estimated to be 11 million users ((NTC), 2011).
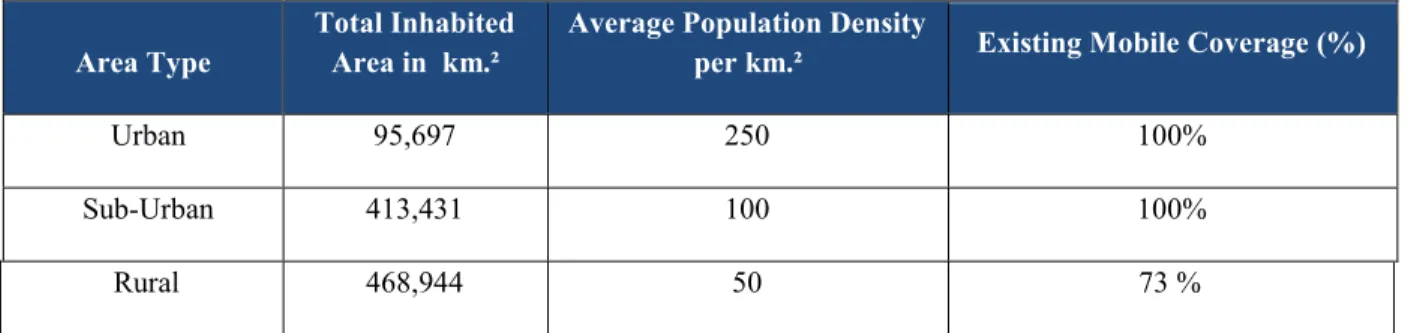
Currently, five key players/operators exist in the telecommunication market in Sudan; two fixed telephony operators (SUDATEL and CANAR) and three mobile network operators (MTN, ZAIN and SUDANI (SUDANI owned by SUDATEL GROUP)). There are two licensed international gateways; one for CANAR and the other for SUDATEL GROUP for routing their own international traffic as well as that of all other operators. Each of ZAIN and MTN has a licensed international gateway for routing its own international traffic only. ZAIN have the biggest mobile network coverage, as of year 2013 its mobile network covers around 87% of the populated (wirelessintelligence.com, 2012) ((NTC), 2011). In this regard, a rough estimation about the coverage in the urban, suburban and rural areas can be given as illustrated in Table 2.
Area Type
Total Inhabited Area in km.²
Average Population Density
per km.² Existing Mobile Coverage (%)
Urban 95,697 250 100%
Sub-Urban 413,431 100 100%
Rural 468,944 50 73 %
Table 2: Mobile Service Coverage as Percentage of the Populated Area in Sudan
Similar to other countries in North and East Africa, the demand for the broadband connectivity in Sudan is expected to grow strongly in the forthcoming years. In this regards, according to statistics published by Cisco, the internet traffic is estimated to grow at a compound annual growth rate of around 40% between year 2012 and year 2017 in the Middle East and Africa region. This anticipated growth in the data traffic will have a direct impact and implication on the underline broadband infrastructure in terms of capacity requirement, investment costs and maintenance and operation cost. In view of the low penetration of the fixed broadband connections, in Sudan and other countries in the region, the mobile broadband connectivity is expected to play a key role in meeting this demand (GSMA, 2013).
4.3 Digital Terrestrial Broadcasting Services Deployment in Sudan
The rollout of the digital terrestrial broadcast infrastructure is a challenging and complex process that required not only the principal understanding regarding network architecture and network planning, but also the impact of technical choices on the existing business ecosystem business and the surrounding regulations. In general the construction of the frequency plan has to
11
take into account constraints imposed by factors such as: frequencies occupied by existing broadcasters (Analogue Broadcasting); the need to co-ordinate broadcasting frequencies with neighbouring countries; demographic and topographic conditions, exiting demands and the market trends.
4.4 Spectrum Plan and Transmission Standards
Determining the TV presentation formats is a step that precedes the actual selection of a transmission standard and system. TV presentation formats, namely the Standard Definition TV (SDTV) and High Definition TV (HDTV) are independent of the transmission standard and are established as part of the program production process. However, the choices on the presentation format have an impact on the broadcast delivery platform and vice versa the choices in the delivery platform and transmission standards are of great importance for the choosing the presentation format. The choice of the video transmission standards, the decision on the video bit rate for Standard Definition TV (SDTV) and High Definition TV (HDTV) is required to reach optimum balancing between picture quality and multiplex capacity. Figure 2 illustrated average bit rate for SDTV and HDTV versus different compressing techniques. The multiplex capacity should be sufficient to carry the required number of services with the required bit rate and depends on: The transmission system; Modulation, code rate and guard interval; and Number of programs (including sound and data) that need to be transmitted in the Multiplex. The choice of the video bit rate for SDTV and HDTV services is a trade-off between picture quality and multiplex capacity; yet to achieve an acceptable picture quality the requirements in Table 2.
Source: (ITU, August 2012)
Table 3: Video bit rate requirements (ITU, AUGUST 2012)
There are many terrestrial digital video and audio broadcasting standards existing around the globe. Europe has adopted the Digital Video Broadcasting-terrestrial (DVB) and Digital Audio Broadcasting-terrestrial, North America has adopted Advanced Television Systems Committee (ATSC) and the Japanese and some South American States have adopted Integrated Services Digital Broadcasting (ISDB) standards. In this regard, the African Telecommunication Union
12
(ATU) invited its member to consider the adoption of the MPEG4 (is a method of defining compression of audio and visual (AV) digital data identified by the Moving Picture Experts Group) and the Digital Video Broadcasting – Second Generation Terrestrial (DVB-T2) standards in the region. The main motivation behind ATU recommendations is to pave the way for more harmonized and efficient use of the spectrum resource especially in UHF band, such direction aligned with the Arab Spectrum Management Group (ASMG) concerning the effort to free the band from 690 to 790 MHz for land mobile communication services in region 1.
During the Radio communication Conference in year 2012 (WRC-12), the ATU support the resolution 232 which set the basis for allocating the frequency the band from 694 to790 MHz (UHF TV Channels 49 to 60) for mobile communication services in region 1 (ITU, February 2013) (ITU-R, 2014). Successively, the African telecommunication union (ATU) lead the coordination effort across the continent (in collaboration with The international telecommunication Union (ITU)) in order to ensure a minimum resource of four nationwide digital terrestrial broadcasting coverage’s in the band 470-694 MHz and free the band from 694 to 790 for MHz mobile services (ATU, 2012). In view of this development, the number of the allocated channel to the digital broadcasting services in UHF bands will be reduced to around 27 RF channels (i.e. around 216 MHz) in Africa. The urge question here if these spectrum resources will be enough to satisfy the need for the broadcasting services or not remains an open issue.
Taking Sudan as example, based on the limited available information at present, the terrestrial TV analogue broadcasting (Free to Air) situation in Sudan can be summarized as follows; one national TV program broadcasted nationwide (using different frequency for each city) and in total 18 TV Programs broadcasted at states level (using different frequency for each city). Hence, four national multiplexer seem to be enough to support the short-term requirements for the broadcasting sector but with some concerns about the long-term requirement especially when High Definition TV is taken into the account.
4.5 Choice of the Network Structure
Traditionally, the implementation of the digital broadcasting plan is based on one of two types of terrestrial digital broadcasting networks, namely the Multi-frequency networks (MFN) and the Single frequency networks (SFN). The MFN architecture allows the use of the same or different programs to be carried by individual transmitters using different frequencies. While the SFN architecture depends on the use of multiple transmitters operating on the same frequency and carrying the same programmed to cover a certain area. The transmitters in an MFN have not to obey rules of synchronous emissions, therefore no co-ordination between transmitters site is required which make the network planning task much easier compared to the case in the SFN. Moreover, the installation of local or regional services is easy with the MFN concept compared to the SFN concept. In an SFN it is not possible to provide an extra service for only a part of the
13
common service area. However, this can also make use of the SFN concept more convenient to cover wide region by employing few number of transmitters. In addition to that, the frequency efficiency of SFNs is high compared to MFNs. In short, the type of network that implemented in each country depends on the availability of frequencies, the type of coverage required, and the number of multiplexes to be provided and may depend on further national constraints or strategies.
From the available data and information, the majority of the analog TV transmitters in Sudan operate in the very high frequency (VHF) bands and this operation will be protected up to year 2020 as stipulated in the GE-06 Regional Broadcasting Agreement. Eventually the transition from analogue to digital broadcast in Sudan will require replacement of 19 analogue television sites which mainly operates from power ranging from 500 to 2KWatts. Only the tower and shelter could be used in these sites and all the transition equipment will need to be upgraded. That is why, during the early deployment of the digital broadcasting service, the dominant reception mode in Sudan would likely be fixed reception mode. In a fixed reception digital terrestrial television system, it is reasonable to assume that existing customer receiver antennas will be appropriate, assuming the same frequency bands and polarization as the existing analogue services are used.
In this paper, a mixed MFN and SFN structure based on small service SFN area of 55 square kilometer is proposed for the rollout out of the digital terrestrial broadcasting network in Sudan as shown in Figure 4. Within each SFN area, around three sites could exist based on the reference network structure recommended by ITU, namely reference network (RN2). Further on, the configuration of each transmitter site is based on the reference planning configurations (RPC) by the ITU as indicated in (ITU-R, 2006).
Source (ITU-R, 2006)
14
The aforementioned small Service Area SFN will serve as building block for the frequency-reusing plan in MFN structure manner as illustrated in Figure 5. Based on the proposed network structure, number of RF-frequency channels can be used at spacing distance of 110 Km is adopted as shown in Figure 5 ((NTC), 2011). In this regard, between 4 to 6 RF-channels could be used per our building block. However this could be an optimistic proposal and yet the actual number of multiplexers is subject to more comprehensive spectrum planning exercise including coordination with the neighboring countries.
Moreover, the proposed mixed MFN-SFN structure can be interpreted in different ways to meet the real life demand in term of the number of multiplexers to be provisioned for city-wide coverage, state-wide coverage and nation–wide coverage as shown in Figure 5.
15
4.5.1 Network Dimensioning
Two deployment scenarios for provisioning the liner terrestrial broadcasting services are considered; namely building a dedicated digital terrestrial broadcasting infrastructure is compared to the delivery of the digital terrestrial broadcasting services over the mobile network infrastructure. In order to deliver the broadcasting service over cellular network, The MBMS (Multimedia Broadcast Multicast Services) in UMTS and its LTE counterpart MBSFN (Multimedia Broadcast Single Frequency network or Multicast Broadcast Single Frequency Network) are the main technologies considered. The network in each of the deployment option is dimensioned in terms of the required number of transmitter sites (RBSs) and backhauling links. 4.5.1.1 Number of the transmitter sites
The rollout of 4 up to 6 multiplexers at the nation-wide level, state-wide and/or city-wide in Sudan will be considered as base for the comparison in this study. Based on the system specification in Table 4 and the reference network structure of Small Service Area SFN illustrated in Figure 4, the number of the DVB-T2 Transmitter sites can be calculated as shown in equation (1).
(1)
Where Aservice is the size of the service area to be covered, ARBS is the coverage area of specific DVB-T2 type. Likewise by considering the system specifications descried in Table 3, the required number of LTE radio base stations to satisfy the mobile subscribers demand is subject to the coverage and capacity constraints of the type of radio base station used and of course the demand level as shown in equation 2.
(2)
Where P represents the mobile broadband service penetration rate, 𝑁𝑢𝑠𝑒𝑟 is the number of user per square kilometer, Aservice is the size of the service area, ARBS is the coverage area of
specific radio base station type, B is the available (spectrum) bandwidth per TRX, NTRX is the number of TRXs per a radio base station, SE is the spectral efficiency of the adopted radio access technology (i.e. LTE), Ruser is the average offered data rate per user and DDTTB represents the
broadcasting services data rate requirement. The DDTTB can be estimated as shown in equation 3.
𝐷𝐷𝑇𝑇𝐵 = 𝑆𝐸𝐷𝑇𝑇𝐵∗ 𝑁𝑀𝑈𝑋∗ 𝐵𝑇𝑉 (3) 𝑁𝐵𝑆= [((𝑃 ∗ 𝑁𝑢𝑠𝑒𝑟∗ 𝑅𝑢𝑠𝑒𝑟∗ 𝐴𝑅𝐵𝑆)) 𝑁𝑇𝑅𝑋∗ (𝐵 ∗ 𝑆𝐸 − 𝐷𝐷𝑇𝑇𝐵) ] ∗ [ 𝐴𝑠𝑒𝑟𝑣𝑖𝑐𝑒 𝐴𝑅𝐵𝑆 ] 𝑁𝐵𝑆 = 3 ∗ [𝐴𝑠𝑒𝑟𝑣𝑖𝑐𝑒 𝐴𝑅𝐵𝑆 ]
16
Where 𝑆𝐸𝐷𝑇𝑇𝐵 represents the spectral efficiency of the DVB-T2 (Small Service Area SFN), 𝑁𝑀𝑈𝑋 is the number of planned multiplexers, 𝐵𝑇𝑉 is the bandwidth of the RF-channel (which is equal to 8 MHz).
4.5.1.2 Number of the Backhaul Links
The number of required backhaul links can be calculated as function of the average backhaul load offered at transmitter ( 𝑅𝐵𝐻), the maximum capacity of the backhaul link (CBH) and the number
of transmitter sites (NBS) as illustrated in Equation 4.
N
BHL= (
𝑅
𝐵𝐻/C
BH)* N
BS(4)
Option
Inter-Sites Distance (ISD) in
[km]
Spectral Efficiency bit/s/Hz
References Re-use Distance in [Km] Optimistic Conservative LTE MBSFN 2 Km 4 3 1.1 (ECC, 2013) LTE MBSFN 5 Km 10 1.5 0.5 (ECC, 2013) LTE MBSFN 10 Km 20 0.7 0.1 (ECC, 2013) DVB-T2 (Small SFN) 55 km 110 3.3 (ECC, 2013)
Table 4: Coverage and Spectral Efficiency for Different Options
4.5.2 Power Consumption Model
The power consumption in the radio access network is composed of two components, namely the power consumed in the transmitter sites (RBSs) and the power consumed in the associated backhaul links. Each one of these two components contains two parts; 1) fixed power consumption part, which is independent from traffic load and 2) dynamic power consumption part, which varies according to the traffic load. The power consumption in a radio transceiver, either in digital terrestrial broadcasting transmitter or a transceiver chain in the mobile network) can be divided into five categories; namely: 1) the power consumed for computation, signal processing proposes (such as the signal processing unit). 2) the power consumed as results for the traffic transmission over the air 3) the power necessary for the operations of the electronic components 4) loss in the wiring, cables, physical interfaces (connectors) and antenna systems 5) power consumed in the auxiliary system such as active cooling system, monitoring/alarm system, direct current power supply regulation (DC-DC), main alternating current power supply for connection to the electrical power grid (AC-DC), etc. The auxiliary system cooling cabinet may be used to house the electronics for all sectors.
17
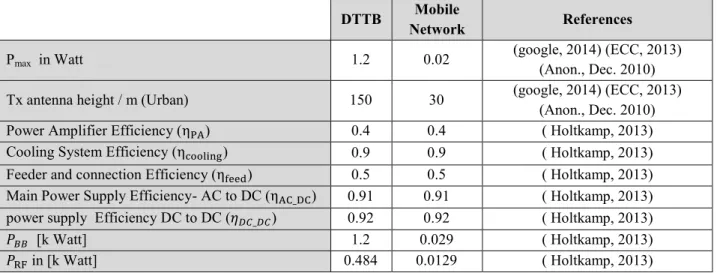
In this paper, the power consumption model developed within the EARTH project will be adopted with minor amendment to estimate the power in the LTE radio base station and DVB-T2 transmitter site as shown in Equation 1 ( Holtkamp, 2013):
𝑃𝑐[Watts] = 𝑁𝑇𝑅𝑋∗ ([ 𝑃𝑚𝑎𝑥) 𝜂𝑃𝐴∗ 𝜂𝑓𝑒𝑒𝑑] + ([𝑃𝑅𝐹−𝑢𝑛𝑖𝑡+ 𝑃𝐵𝐵−𝑢𝑛𝑖𝑡] ∗𝐵𝑊 ∗ 𝐴𝑁𝑇 𝐵𝑊 𝑇𝑅𝑋 )) 𝜂𝐷𝐶−𝐷𝐶∗ 𝜂𝐴𝐶−𝐷𝐶∗ 𝜂𝑐𝑜𝑜𝑙𝑖𝑛𝑔 (4)
Where Pc represents the total consumed power per LTE radio bases station or DVB-T2 transmitter, NTRX represents the number of transmitters (TRXs), Pmax represents the maximum power supplied to the antenna system, PBB represents the power consumed in the digital part, i.e. the processor module as result of the digital signal processing and computation in the analogue part, i.e. the PRF represents the power consumed in radio frequency (RF) module as results of the data transmission, BW represents the utilize spectrum bandwidth per transmitter, BWTRX represents the maximum possible spectrum bandwidth per transmitter and ANT represents the number antennas per the transmitter. The used assumptions to calculate the power consumption per specific transmitter site type is shown in Table-5.
In the case of the LTE radio base station, the base station will not operate at the maximum load all the time (i.e. transmit at Pmax). However around 52% of the maximum power Pmax will
be utilized to continuously advertising the base station availability by transmitting the broadcasting pilot and signaling information. While the remaining percentage from the maximum transmits power is consumed proportional to the users’ traffic load in the downlink.
DTTB Mobile
Network References
Pmax in Watt 1.2 0.02 (google, 2014) (ECC, 2013) (Anon., Dec. 2010)
Tx antenna height / m (Urban) 150 30 (google, 2014) (ECC, 2013) (Anon., Dec. 2010) Power Amplifier Efficiency (ηPA) 0.4 0.4 ( Holtkamp, 2013)
Cooling System Efficiency (ηcooling) 0.9 0.9 ( Holtkamp, 2013)
Feeder and connection Efficiency (ηfeed) 0.5 0.5 ( Holtkamp, 2013)
Main Power Supply Efficiency- AC to DC (ηAC_DC) 0.91 0.91 ( Holtkamp, 2013)
power supply Efficiency DC to DC (𝜂𝐷𝐶_𝐷𝐶) 0.92 0.92 ( Holtkamp, 2013)
𝑃𝐵𝐵 [k Watt] 1.2 0.029 ( Holtkamp, 2013)
𝑃RF in [k Watt] 0.484 0.0129 ( Holtkamp, 2013)
18
The power consumption in the backhaul link can be model considering fixed part that consumed independently from the traffic load and dynamic part that depend on the traffic load as follows:
Power consumption per Backhaul connection= PF + Ptx_BH * (%load)
(5)
Where Ptx_BH represents the maximum transmission power per backhaul link, PF represent
fixed part consumed independently from the traffic load and %load the proportional relation between the traffic backhauled from the transmitter site and the maximum capacity offer by a backhaul link. The used assumptions to calculate the power consumption per specific backhaul link type is shown in Table-6.
Backhaul Link Type PF
[W]
Ptx_Bh
[W]
Maximum
Capacity Source
Fiber Optic Link 5 2.5 10 Gbps (GROBE, ET AL., 2011) (SKUBIC, ET AL., JANUARY 2012)
Table 6: Power Consumption in Backhaul Link
4.5.3 Cost Model
Based on the pre-described dimensioning methodology and power consumption model; the total investment cost (CapEx and OpEx), i.e. the annual investments and operation costs is calculated as shown in Equation (2) and Equation (3). The annualized CapEx is assumed to be composed of the cost in the radio access part in addition to the cost in the backhauling part. The total cost in the radio access part is calculated as function of the number of transmitter sites (NBS) and the cost of transmitter site (CBS). While the total cost backhauling in the backhauling is calculated as function of the backhauling number (NBHL) and the cost of a backhaul link (CBHL). In addition to that a markup cost (Ninst) including the associated civil works, installation and commissioning costs are considered as shown in Equation 2 and associated with cost values of different equipment shown in Table 7.
𝐶𝐶𝑎𝑝𝐸𝑥 = 𝐶𝐵𝑆∗ 𝑁𝐵𝑆+ 𝐶𝐵𝐻𝐿∗ 𝑁𝐵𝐻𝐿 + 𝑁𝑖𝑛𝑠𝑡 (2) While the operation expenditure (OpEx) in the radio sites and the backhaul network is composed of the cost of annual operation and maintenance (O&M) activities cost (CO&M) together with the cost of annual power consumption in radio access part (PBSs) and backhauling part (PBHLs), radio sites rent cost (CRsite ) and leased lines and/or spectrum fee per backhaul link (Cls ) as shown in Eq.3 and associated with incurring cost values shown in Table 6.
&
OpEx BSs BHLs O M site ls
19
Item Cost (k€) Reference
LTE Radio Base Station (with 3 TRX, 20 MHz per TRX) 25 (Ahmed, et al., 2013)
Cost of additional TRX in LTE 5 (Ahmed, et al., 2013)
Site Construction (LTE Macrocell) 50 (Ahmed, et al., 2013)
DVB-T2 Transmitter 225 (alibaba, 2014) (ROHDE&SCHWARZE, 2013)
Cost of combiner in DTTB site (2 MUX per Transmitter) 15 (ROHDE&SCHWARZE, 2013)
DTTB Site Construction 400 (ROHDE&SCHWARZE, 2013)
Fiber Optic Link (ONU+ modem) 0.5 (Ahmed, et al., 2013)
Fiber Optic rollout cost per Km 1.5 (Ahmed, et al., 2013) Annual Fiber Optic leased line fee (STM1= 155 Mbps) 1.2 (Ahmed, et al., 2013)
Annual Site rent 3 (Ahmed, et al., 2013)
Price of Electricity (KWH) 4 0.0000776 O&M represent 10%(of CapEx) and installation 5%(of CapEx)
Table 7: Cost Assumptions
In order to compare the different deployment scenarios, the total cost of ownership (TCO) considering the annual investments and operations costs for 10 years (from year 2010 to year 2020) is calculated. For this purpose, the net present value (NPV) method is used considering discount rate of 10%, as shown in Equation (4).
NPV = ∑ (1 + r)TCOtt
T
t=1
(4)
Where TCOt represents the annualized total cost of ownership in term of the annualized CapEx and annualized OpEx at year t, while r represents the discount rate and T represents the network operation period in year. The calculation of the annualized total cost of ownership is based on the introduced cost model in equation 2 and equation 3.
5 Results and Discussion
The players in the telecoms and mobile sectors, like the broadcasting sector, regard the spectrum resources in UHF band (from 470 MHz to 862 MHz) as suitable for the provision of mobile broadband/ broadcasting and multimedia services due to its favorable propagation characteristics which make it suitable for the provision of urban indoor coverage as well as coverage in rural areas. That is why the regulators, spectrum managers are faced with the question how to utilize these frequency resource in most efficient way to provision the required broadcasting and mobile broadband services in cost effective way. Nowadays, the average spectrum allocation of the spectrum per mobile operator in Sudan ranges between 15 to 30 MHz which is relatively low compared to the average spectrum allocations in the developed countries
20
such as Sweden (the average allocated spectrum per mobile operator in Sweden is around 60 to 70 MHz). Theses spectrum allocations are limited to the rollout of the 2G and 3G mobile services which put more pressure on the regulatory body to release more spectrums for future mobile broadband services (i.e. 4G systems) favorably in bands below 6 GHz. Regulatory bodies in Sudan in particular and the African continent in general perceive the Digital Dividend in the 700 MHz and 800 MHz bands as means to allow the mobile operators to improve both coverage and quality of mobile broadband service in a cost effective manner especially in rural area. In view of the anticipated spectrum release due to the Digital Dividend in the 700 MHz and 800 MHz bands around 50 MHz spectrum bandwidth can be allocated to each of the exiting mobile network operators. In this regard, the total cost of ownership (TCO) has been calculated for three deployment scenarios, namely the deployment of separated infrastructure for mobile broadband and broadcasting services compared to the cost of deploying common platform for mobile broadband and broadcasting services.
A potential cost saving ranges between 15% (in high demand scenarios for mobile broadband service, where a demand of 5 GB per month and user is assumed) to 30% (in low demand scenarios for mobile broadband service, here a demand of 1 GB per month and user is assumed) can be anticipated when a common platform is deployed as shown in Figure 7 and Figure 8 respectively. However, as demand for Mobile broadband services increase the potential saving expected from the deployment of the common platform will decrease as can interpreted from the results in Figure 8. Moreover, the fragmentation of the spectrum resources among different mobile network operators may lower the economic incentives of delivering the broadcasting services over cellular network.
From the macroeconomic perspective the required heavy investment to rollout a separated network can be relaxed in term of Capital Expenditures (CapEx) and Operation Expenditures (OpEx). That is why building a common platform for both of the mobile broadband services and digital terrestrial broadcasting’s services in UHF bands can be motivated due to potential saving in the deployment cost and energy consumption compared to the case when a separate infrastructure is rollout; yet this incentive can be realized only when an efficient mobile systems is deployed (i.e. dense LTE network deployment with Inter site Distance of two kilometers as shown in Table7).
21
Figure 6: Potential Saving in the Total cost of Ownership (low MBB demand(1GB/month))
Figure 7: Potential Saving in the Total cost of Ownership ( High MBB demand(5GB/month))
Inter site Distance (ISD in KM) 2 5 10
Spectral Efficiency SE 3 1.5 1
Cell Area 3.14 19.63 78.539
Cell Capacity (MBB)_20 MHz 180 270 180
Cell Capacity (Common )_120 MHz 86.4 -183.6 -333.6
DTTB 211.2 211.2 211.2
Table 8: Commom Platform Capapcity
Around 30% Saving
22
Moreover, the migration from multiple separate networks (i.e. for each of the broadcasting services and mobile broadband services) to common platform will lead to a centralization of the network planning, operation and maintenance activates which will results in a reduction of the operation cost (OpEx) that is required for the services provision and consequently decrease power consumption costs as shown in Figure 9 and Figure 10. The reduction in the energy consumption represents an important incentive especially in the developing countries where considerable number of mobile radio base stations and broadcasting sites remain outside the national electricity power grid.
Figure 8: Potential Saving in Power Consumption (Low MBB demand (1GB/month))
Figure 9: Potential Saving in Power Consumption (High MBB demand (5GB/month))
Around 15% Saving
23
Nevertheless, the incentives and the challenges to rollout a common platform for the mobile broadband and broadcasting services go beyond the simple cost benefit analysis to encompass questions about the possible impact on the existing broadcasters and mobile operator’s value chains. In this regard, local market requirements, the interests of existing actors and regional and international regulatory requirements regarding the use of the frequency spectrum need to be taken into account. In Sudan as many others developed and developing countries, the terrestrial broadcasting service used to play a key social role in terms of promoting education and learning, social cohesion, media pluralism and cultural diversity. Consequently policy maker will be sensitive to make any major changes on the traditional regulation and policy that consider the existence of public service broadcasters as a matter of public policy.
Subject to the development in regulations frameworks, it is likely that the different actors in the mobile and broadcasting markets will choose to develop multiple areas of activity, spanning several stages of the value chain. Traditionally the Telecommunications Service Provider (i.e. MNO) business model is used to be centric around rolling and operating the necessary infrastructure to supply the telecommunications services without a real focus on the creation and the provision of the content. However, the business strategy of the MNOs may extend to include the content production function in addition to the integration of transport network and signal transmission activities with multiplexing of the broadcasting service with other telecom services. In this respect, the business model of the publicly-funded broadcasters will be threaten, where a public broadcaster such as the state-owned Sudan Radio and Television Corporation (SRTC) are used to be the only broadcaster with transmission facilities within Sudan. SRTC like other public broadcaster in the region is used to provision the public broadcasting services in exchange for exclusive access right to the broadcasting spectrum resources. In this regard, a new framework may need to be developed to separate the existing provision of broadcasting network facilities and the provision of services to pave the way for the rollout of common platform by putting on place the necessary policy and regulation to assure fair revenue sharing among the different actors.
Acknowledgment
Part of this work has been performed in the framework of the FP7 project ICT-317669 METIS, which is partly funded by the European Union and 5GrEEn project, which is an EIT-ICT Labs project supported by the EIT, European Institute of Innovation and Technology. The authors would like to acknowledge the valuable contributions of their colleagues in METIS and 5GrEEn, although the views expressed are those of the authors and do not necessarily represent the aforementioned projects. Moreover, the authors would like to thanks the interviewed representatives from broadcasting sector, telecom regulatory body and mobile operators in Sudan. However, the views expressed are those of the authors and do not represent any official views from those representative or their organizations.
24
References
1. Holtkamp, H. A., 2013. Enhancing the Energy Effciency of Radio Base Stations, Edinburgh: University of Edinburgh.
2. Laili, A., Markendahl, J., Tollmar, K. & Blennerud, . G., 2012. Competing or aligning? Assessment for
Telecom-operator's strategy to address OTT TV. Bangkok, Thailand, 19th ITS Biennial Conference 2012.
3. Shi, L. et al., 2014. CellTV - on the Benefit of TV Distribution over Cellular Networks: A Case Study. New York, Cornell University, Computer Science -Networking and Internet
Architecture,http://arxiv.org/abs/1303.4924v2.
4. (NTC), N. T. C., 2011. Evoultion of the telecom sector in Sudan_ Annual report, Khratoum: Sudan National Telecommunication Corportion (NTC).
5. Ahmed, A. A. W., Markendahl, J., Cavdar, C. & Ghanbari, A., 2013. Study on the Effects of Backhual
Solutions on Indoor Mobile Deployment “Macrocell vs. Femtocell. London, IEEE, PIMRC 2013.
6. alibaba, 2014. http://www.alibaba.com/showroom/dvb--t2-transmitter.html. [Online] Available at: http://www.alibaba.com/showroom/dvb--t2-transmitter.html[Accessed 12 June 2014].
7. Anon., Dec. 2010. Green Network Planning of Single Frequency Networks. IEEE Transactions on
Broadcasting, 56(4), pp. 541-550.
8. APC, 2011. why-does-digital-broadcast-migration-matters-to-africa. [Online] Available at: http://digmig.apc.org
[Accessed 15 Jan 2014].
9. ATU, 2012. http://www.atu-uat.org/index.php/reports/summit-reports. [Online] Available at: http://www.atu-uat.org [Accessed 10 may 2014].
10. AUC, 2012. INFORMATION NOTE ON THE TRANSITION FROM ANALOGUE TO DIGITAL TERRESTRIAL TELEVISION, Addis Ababa: African Union.
11. EBU TECHNICAL, 2011. The Future of Terrestrial Broadcasting, Geneva: EBU TECHNICAL. 12. EBU, 2011. The Future of Terrestrial Broadcasting, Geneva: EBU Technical Report 013.
13. EBU, 2013. MEDIA DELIVERY STRATEGIES: Report on the Future of Terrestrial Broadcasting, Geneva, Switzerland: EBU.
14. ECC, 2013. TV Distribution via Celluar Network, Lisboa: ECC.
15. ericsson White paper, 2013. LTE Broadcast-a revenue enabler in the mobile media era, Stockholm: ericsso. 16. google, 2014. https://sites.google.com/. [Online] Available at:
https://sites.google.com/site/lteencyclopedia/lte-radio-link-budgeting-and-rf-planning[Accessed 13 June 2014].
25
18. GSMA, 2013. Sub-Saharan Africa Mobile Economy 2013, s.l.: GSMA. 19. ICT Regulation Toolkit, 2004. Impact of Convergence. [Online] Available at:
http://www.ictregulationtoolkit.org/6.4 [Accessed 2 Feb 2014].
20. ITU, August 2012. transition from analogue to digital broadcasting- including the Asia-Pacific Region, GENEVA: ITU.
21. ITU-D, 2012. Digital Dividend:Insights for spectrum decisions, Geneva: ITU-D.
22. ITU, February 2013. Trends in broadcasting: An overview of developments, Geneva: ITU. 23. ITU-R, 2006. RCC06, FINAL ACTS, Geneva: ITU.
24. ITU-R, 2013. Trends in broadcasting An overview of developments, Geneva: ITU.
25. ITU-R, 2014. Spectrum requirements for terrestrial television broadcasting in the UHF frequency band in
Region 1 and, Geneva: Report ITU-R BT.2302-0.
26. Mohamudally, N., 2011. The Technological Challenges In Mobile Networks And Communications In View
Of Unleashing The Full Potential Of M-learning. s.l., ©FORMATEX.
27. Plum Consulting, January 2014. Benefits of digital broadcasting: A report for the GSMA, London: Plum Consulting.
28. ROHDE&SCHWARZE, 2013. http://www.itu.int/ITU-D/arb/ARO/2014/DB/Docs/S1-Skanda.pdf. [Online] Available at: http://www.itu.int/ITU-D/arb/ARO/2014/DB/Docs/S1-Skanda.pdf [Accessed 14 June 2014]. 29. Sahota, D., 2014. koreas-kt-launches-lte-broadcast-service. [Online] Available at:
http://www.telecoms.com [Accessed 1 Feb 2014].
30. Skubic, B., Betou, E. I. d., Ayhan, T. & Dahlfort, S., January 2012. Energy-Efficient Next-Generation.
IEEE Communications Magazine , pp. 122-127.
31. statoids, 2014. http://www.statoids.com/usd.html. [Online] Available at: http://www.statoids.com [Accessed 10 may 2014].
32. wikipedia, 2011. wikipedia. [Online] Available at: www.wikipedia.com
33. wirelessintelligence.com, 2012. https://wirelessintelligence.com/. [Online] [Accessed Dec 2012]. 34. worldbank, 2012. /data.worldbank.org. [Online] Available at: