Evaluation of an Adaptive Cruise
Control (ACC) system used by drivers
with lower limb impairments
Paper presented at the Third Annual World
Congress on Intelligent Transport Systems,
Oct. 14-18, 1996, Orlando, Florida, USA
|
U')
G)
_|
H
oo
N
x
0
>.
&-H h 35m
Björn Peters
Swedish National Road and
'Fansport Research Instiwte
VTI särtryck 281 - 1997
Evaluation of an Adaptive Cruise
Control (ACC) system used by drivers
with lower limb impairments
Paper presented at the Third Annual World
Congress on Intelligent Transport Systems,
Oct. 14-18, 1996, Orlando, Florida, USA
Björn Peters
wedisir
and
Evaluation of an Adaptive Cruise Control (ACC) system used by
drivers with lower limb impairments
No 2104
Björn Peters
Swedish National Road and Transport Research Institute
S - 581 95 Linköping
Sweden
phone +46 13- 20 40 70
fax
+46 - 13 - 1414 36
email bjorn.peters©vti.se
ABSTRACT
An advanced driving simulator equipped with an Adaptive Cruise Control (ACC) system was used to study driving behaviour of drivers with lower limb impairments. The ACC system could keep a constant speed selected and set by the driver and also adapt speed in order to keep a safe distance to a leading vehicle. The purpose of the study was to investigate ACC driving influence on workload, comfort and driving behaviour compared to manual driving. Twenty subjects with leg impairments, all experienced drivers of converted cars, participated in the study. Two common types of hand controls for accelerator and brakes were used for the manual driving condition. These were different both with respect to function and position All subjects drove 100 km at two occasions, with and without the ACC system available. Subjective workload was found to be lower and performance better when ACC was used. Manual speedkeeping is a loading task and increased variation in spped could indicate increased load or tiredness. The difference in speed variation between manual and ACC supported driving increased with the distance driven. The subjects thought they could control both speed and distance to leading vehicles better while driving with the ACC. ACC driving did not influence reaction time, speed level, lateral position or variation in lateral position. Headway during car following situations was shorter for the ACC condition compared to manual driving. The ACC was well received, trusted and wanted. It was concluded that the ACC system substantially contributed to decrease workload and increase comfort for drivers with lower limb disorders.
INTRODUCTION
People with lower limb disorders constitute one of the largest groups of mobility handicapped people. Many of these can maintain or regain their independent mobility through driving converted cars. Drivers with impaired legs have to rely on their upper limbs to perform the driving task. This imposes a higher load on their upper limbs compared to able-bodied drivers ([l], [2]) and long distance driving is often experienced as problematic (B]). Reducing the load on the upper limbs would improve comfort and mobility for these drivers. Advanced Transport Telematics (ATT) applications could be used to improve driving conditions for both disabled and elderly if systems are designed with respect to their need and resources ([4], [5]). This makes ATT applications which are primarily aimed at improving the driver's comfort like the Adaptive Cruise Control (ACC) particularly interesting.
ACC systems will probably be one of the first in vehicle ATT systems to be introduced on the market. The conventional Cruise Controller (CC) was developed for constant speed driving on a motor-way with no traffic or smooth traffic flows. The ACC can handle some interaction with other traffic i.e. adjusting speed in order to keep a safe distance to a leading vehicle.
Hand controlled accelerator and brakes can be designed in numerous ways. All systems have their pros and cons depending on the individual driver s need and resources and the specific vehicle. There is no single standard solution that suits all drivers. The design of the hand controls might influence the driver s steering control ([l]). The specific questions of interest in this study were: Will ACC driving reduce physical load and improve comfort?, Will ACC driving influence steering control ?, Will ACC driving influence reaction time?, What influence will ACC driving have on Headway and TTC (Time-To-Collision) during car following situations ?, Will the drivers approve of the ACC?, and finally Will the effects ofACC driving be dijåferent depending on the type of hand control systems used?
METHOD
Twenty subjects with lower limb disorders, seventeen men and three women, participated in this study. All subjects were experienced drivers of converted cars. The subjects were divided in to two subgroups equal in size depending on the type of hand control they used for manual driving. One group drove with a single lever system and the other a dual lever system for accelerating and braking. The first group had a mean age of 37.6 years and the second 41.9 years. The total mean age was 39.8 years (sd 11.1). The rather few number of female subjects (15%) corresponds to the gender distribution among lower limb disabled people in general. All subjects had a minimum driving experience of at least 2 years (mean 9.7 years) or at least 40,000 km in converted cars equipped with the type of hand control they used in this study. They estimated that they drove between 10,000 and 45,000 km per year (mean 22,200 km, sd 10,340 km).The study was performed as a two by two mixed factorial design. All subjects drove both with and without ACC but with only one hand control system. The order of ACC condition was counterbalanced.
The dynamic driving simulator at the VTI was used in this study ([6], [7], [8]). The vehicle is modelled in the
computer system and the moving base system simulates accelerations in three directions through roll, pitch and linear lateral motions. The visual system presents the external scenario on a 120O wide screen, 2.5 metres in front of the driver. The sound system generates noise and infrasounds that resembles the internal environment in a driving car. The vibration system simulates the sensations the driver experience from the contact between the road and the vehicle. The driving simulator have high performance characteristics with very short time delay of maximum 40 ms. A short time delay between visual and motion perception is important to prevent motion sickness and to maintain a high level of reality.
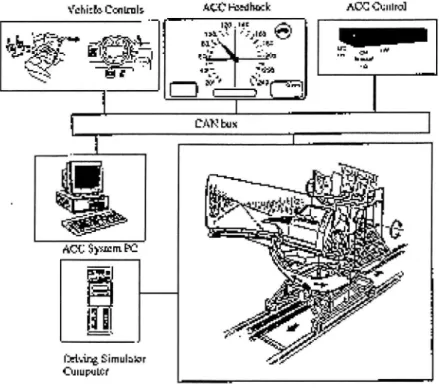
The ACC system was installed in the driving simulator. All communication between the ACC and the driving simulator was handled by a CAN bus (Figure l). Basically the ACC worked as a standard CC by keeping a set cruising speed selected by the driver, but it could also adjust speed in order to maintain a safe distance to a leading vehicle. This function was realised by a simulated sensor for vehicle detection mounted in the front of the car. The ACC controlled both throttle and brakes when activated. The selected speed could be adjusted up and down in increments of 10 km/h by the driver. Speeding overrode the ACC, but the selected speed was resumed when the accelerator was released. The driver could at any time disengage the ACC by braking or turning the ACC off manually. After braking the ACC could resumed previous speed if the speed was not below 30 km/h. Headway applied by the ACC was speed dependent. The ACC included a simulated stop-and-go function which worked if there was a leading vehicle. Feedback to was provided on the dash board (Figure l). When the ACC was turned on the word CRUISE would appear in amber at the lower right on the dash board. The speedometer had a circle of amber which indicated selected speed. At the top right on the dash board an amber car symbol was lit when a leading vehicle was identified. The ACC controls were placed on the direction indicator stalk to the left of the steering column. The controls had the following functions ON/OFF, SET/RESUME, Step Up (+ 10 km/h) and Step Down (- 10 km/h).
'urchizlo Central: h ? I- aedhmk ACC Chink-J] "äs-5:55; - if} _
få ? gig-'a'
=;
en
l.
fitting Simulabar Cmupumr Biting Sirl'lulfmfFigure l Simulator set up for the ACC study
The car body was a Saab 9000 with an automatic gearbox. The car entrance was 2 metres above ground level. A wheel chair lift made it possible for the subjects to enter the car. Two common systems of hand controlled accelerator and brakes were installed (Figure l, top left). With the single lever system the driver could brake by pushing and accelerate by pulling. The other system had two separate levers placed on the steering column. The braking lever was
pushed, and the accelerator lever was moved radially. Both systems were operated by the driver's right hand. The left hand was used for steering.
The test road was 9 m wide with two lanes each 3,5 m wide and with a hard shoulder of 1 m. The road surface
consisted of asphalt with randomised texture with high friction. It was daylight conditions with a sight distance of approximately 500 m. The route consisted of mixed straight sections and sections with varying horizontal and vertical curvature. The route included also cross roads with traffic lights. The speed limit, marked by road signs, was in general 90 km/h but 70 km/h at traffic lights. The experimental route was 100 km long. The same route was used for all subjects and both with and without ACC.
Different traffic situations appeared in a randomised sequence but equal to all subjects during the driving session. The subjects were meeting oncoming vehicles. There were six cross roads with traffic lights along the test route. Unexpected traffic events were simulated by visual stimulus. Yellow and red squares were displayed at the left side of the road. The squares were 4 x 4 cm in size and at a distance of 2.5 m from the driver's eyes, representing an approximate sight angle of 1°. The subjects were told to brake as fast as possible for red squares and to do nothing for the yellow. There were sixteen carfollowing situations during the ride. Catching up procedure was standardised. There were four types of car following situations: Leading vehicle braking, Leading vehicle driving with varying speed, Leading vehicle with constant speed, Leading vehicle stopping at traffic lights.
The following measures were used: speed, lateral position on the road, time headway, and reaction time. Subjective measures of workload (NASA - RTLX) ([9], [10]) and questionnaires were used to collect the subject's opinion. Before the test all subjects were give written and verbal instructions and answered a questionnaire about age, gender, handicap, and driving experience. All subjects were instructed to drive and interact with other road users as
they would do normally in real life traffic under comparable conditions. At both occasions, with and without ACC, the
subjects drove a 20 km long training route where all the relevant traffic situations were demonstrated. After the test drive all subjects rated their workload and in a separate questionnaire answered questions regarding experienced reality, experienced illness, speed and distance control, and usability of the ACC system.
RESULTS
The general driving behaviour was analysed in terms of mean speed and lateral position on the road and the variations of these measures. The mean speed level was for ACC driving 88.6 km/h (single lever drivers 89.3 km/h and dual lever drivers 87.8 km/h) and for No ACC driving 89.1 km/h (single lever drivers 88.2 km/h and dual lever drivers 89.9 km/h). A two way ANOVA did not show any significant (5%) interactions or main effects. The lateral position indicated how far to the right in the lane the driver were driving, i.e. the distance between the centre of the steering wheel and the mid-line of the road. Analysis of mean lateral position measures over 100 km showed that single lever users drove on average approx. 14 cm more to the left than the other group. This difference was significant (F(1,36) = 5.00, p: .0317). There was though no interaction effects (5%) and no main effects from ACC use. This difference in lateral position turned out to be consistent both for free flow driving and during car following situations.
Free flow driving was defined as the total distance when the subjects did not have to deal with catching up, overtaking, or traffic lights situations. They just followed the road and occasionally met oncoming traffic. The total free flow driving distance was approximately 60 km (60%) of the total route. The mean speed for free flow driving was for the ACC condition 94.7 km/h (single lever drivers 95.4 km/h and dual lever drivers 94.1 km/h) and for No ACC driving 96.3 km/h (single lever drivers 95.0 km/h and dual lever drivers 97.6 km/h). There were no interaction or main effects (5%). The variation in speed was for the ACC condition 3.3 km/h (equal for both groups) and for No ACC driving 4.7 km/h (single lever drivers 5.3 km/h and dual lever drivers 4.1 km/h). The difference between ACC and No ACC was significant (F(1,36) = 6.59, p= .0145). The mean variation in lateral position was analysed with a two way ANOVA and showed no interaction effect but a main effect due to hand control (F(1,36) = 5.24, p= .0280). Single lever drivers had a greater variation in lateral position (0.27 m) compared to those driving with the dual lever system (0.21 m) (F(1,36) = 12.12, p= .0013).Manual speed keeping imposes a constant load on the driver. Variation in speed (km/h) during free flow driving was analysed to detect possible degradation in manual speed keeping compared to ACC driving. The difference increased with distance driven (Figure 2).
+ - Total W&W Dual lever + Single lever
O-25km
25-50km
50-75km
75-100km
!
l
l
i Distance
Figure 2 Difference in speed variation (km) between No ACC and ACC condition
Mean (n = 4) reaction time for red squares were calculated for all subjects. The mean reaction time for the ACC
condition was 1.32 s (1.41 s for single lever drivers and 1.23 5 for dual lever drivers) and 1.43 s for the No ACC
condition (1.50 s for single lever drivers and 1.37 s for dual lever drivers). A two-way ANOVA revealed no interaction or main effects (5%).
Car following situations were analysed with respect to mean headway, variation in headway, shortest headway, time to collision (TTC), speed and lateral position. Headway was defined as the time distance between the front end of the subject s car to the rear end of the vehicle in front divided with the current speed of the subject s car. Time-to-collision (TTC) was defined as the time it would take to drive the distance to a leading vehicle with the speed difference between the two cars involved i.e. if the two cars drove with the same speed the TTC would be indefinite independent of speed level and distance. The mean headway was longer while driving without ACC 3.3 s (single lever drivers 3.2 5 and dual lever drivers 3.4 s) compared to ACC driving condition 2.6 s (same for both groups). The main effect from ACC was significant (F(1,36) = 8.82, p = 0053) but there was no main effect of hand control nor any interaction effects. Headway variation was reduced when the ACC system was available 1.0 compared to 1.4 s. Also this main effect was significant (F(1,36) = 15.68, p = 003). The average min TTC was 5.2 s while driving without ACC and 7.3 s while driving with (F(1,36) = 7.39, p = .01). Speed and lateral position were also analysed for the car following situation. The results conformed to what was found for the free flow driving. Less variation in speed for the ACC condition (F(1,36) = 12.61, p = 0011) and dual lever users drove more to the right (F(1,36) = 4.80, p = .0351) and vary less in lateral position (F(1,36) = 6.47, p = .0154). The shortest headway was considered to be critical for the car following situations. The number of short headway deceased while driving with the ACC.
Subjective workload. After each driving session the subjects rated the six workload factors; mental demand, physical demand, time pressure, performance, e ort, and frustration level on separate continuous subscales ranging from very low (0) to very high (100). Workload was on three separate forms for the total driving task, car following situations, and car following at trafic lights. The loading factors were in general rated lower and performance higher for the ACC condition for both groups. The total driving task was rated as more loading with No ACC than with ACC (Figure 3). Two way ANOVAs revealed significant main effects of ACC mode for four factors: physical demand (F(1,36) = 10.13; p = 0030), time pressure (F(l,36) = 6.13; p = .0181), performance (F(l,36) = 4.12; p = 0497), and e ort (F(1,36) = 4.67; p = .0373). No main effects of hand control or interaction effects were found.
The car following situations were also in general considered to be less loading under ACC driving conditions. There were significant main effects of ACC mode for five of the work load factors: mental demand (F(1,36) = 14.96; p = 0004), physical demand (F(1,36) = 16.99; p = 0002), performance (F(1,36) = 7.01; p = .0119), frustration level (F(1,36) = 5.66; p = 0229) and effort (F(1,36) = 5.38; p = 0262). There were only two car following situations at trafic lights in total. All loading factors were lower for the ACC condition and performance higher (p < 02). There
Total Driving Task Effort Performance D AOC I No ACC Time pressure Physical demand 0,00 20,00 40,00 60,00 80,00
Figure 3 Mean workload ratings for both groups (n=20) of the total driving task with and without
ACC.
Speed and distance control. The subjects were asked to rate how well they could control speed level and how much effort they had to assigned to control it. The same types of questions were asked for the distance control to a vehicle ahead. Scales with seven steps were used ( 1 = very bad / no effort and 7 = very well / very high effort). Both groups rated the control to be higher and effort to be lower for the ACC condition: speed keeping (ACC mean = 6.2,
No ACC mean = 4.0), speed keeping effort (ACC mean = 1.6, No ACC mean = 3.6), distance keeping (ACC mean = 5.8, No ACC mean = 4.6), distance keeping e ort (ACC mean = 1.7, No ACC mean = 3.0). All differences were
significant (p < 0.015) but there were no main effects of type of hand control and no interaction effects.
ACC usage. After driving with the ACC the subjects were asked rate some aspects which were considered to be important for ACC usage and acceptance. A seven point rating scale was used. The results were General opinion of
the ACC? (mean = 6.7 sd = 0.75), ACC contribution to comfort? (mean = 6.5 sd = 0.95), Learn to use ACC?
(mean = 6.7 sd = 0.59), Trusting ACC? (mean = 6.5 sd = 0.69), Wanting to have ACC? (mean = 6.9 sd = 0.45), ACC better than own CC? (mean = 6.5 sd = 0.77).
DISCUSSION
Physical overload in the upper limbs caused by driving is a serious problem for drivers with lower limb impairments. It does not just cause discomfort but can eventually cause musculo-skeletal problems and reduced mobility. It was expected that ACC driving would reduce workload and improve comfort which was also confirmed. The subjects estimated the experienced workload for the total driving task and the car following situations including traffic lights to be substantially lower when the ACC was available and performance higher (Figure 3). For the total driving task it was found that ACC supported driving was experienced to be 50% less loading with respect to physical demand and time pressure and effort was rated to be 40% lower (Figure 3). Analysis of the variation in speed during free ow driving supports these findings (Figure 2). Speed control seems to become more loading as the driving proceeds. This is indicated by increased variation in speed. Specific questions concerning speed and distance control showed that the subjects found it much easier and less loading to control both speed and distance to leading vehicles when using the ACC system. The ACC system decreased the workload to a level approximately equal to what have been found for able bodied drivers ([1 l]) under comparable conditions. There were no differences between the two subgroups in this respect. The subjects attitudes to the ACC system were recorded by a questionnaire. The ACC system was very well accepted, wanted and trusted by the subjects. They found the system easy to learn and that it contributed substantially to increase comfort. The answers were more positive than what was found in an other comparable study with able-bodied drivers ([ll]). The ACC was also very much preferred over conventional CC.
Nineteen out of twenty (95%) subjects had a conventional CC in their own car. This is far more than in other studies
With able bodied drivers where only approx. 10% had a CC ([11], [12]). These results show that the ACC application
can be of important value beyond mere comfort to improve the independent mobility of drivers with lower limb impairments.
Both headway and TTC are crucial parameters for car following situations. Headway determines the time distance and TTC the approaching speed to a leading vehicle. When headway data was analysed for the car following situations it was found that both variation in headway and mean headway decreased when the ACC was available. The reduced variation in headway indicated a smoother traffic flow. Mean headway was approximately 0.7 seconds shorter for ACC condition. This meant that on average the subjects were driving 17 m closer at a speed of 90 km/h to leading vehicles. This shorter distance was accepted but it does not seem to conform to the distance preferred during unsupported driving. This result is in line with what have been found in a number of other studies with able-bodied drivers ([13]). These results seems to indicate that headway should preferably be adjustable according to driver's characteristics and preferences in order to conform to the individual driving behaviour. This need is likely to be even more pronounced when considering bad weather conditions, night time driving etc. The number of shortest headways per individual were deceased when ACC was used but the average of the shortest headways was not significantly different between the two conditions. Min TTC during car following was approx. 2 s less for the unsupported condition. This means that speed difference was greater when the ACC was not used. It should be noted though that there were no safety critical situations included in this test.
Choice reaction time was used as a measure of the driver s alertness. The reaction manoeuvres (brake for a visual stimuli) were different depending on the type of hand control used and ACC condition. For the unsupported condition the drivers using the dual lever system had to move his/her hand from the speed lever to the brake lever. This was not the case for those who used the single lever system but they had to move the lever a longer distance. When the ACC system was engaged the driver was free to place his/her right hand on the steering wheel or on the brake lever or somewhere else irrelevant to the driving task. If the driver prefered to place it on the brake lever this could influence the brake reaction time. There was though no influence of ACC mode or type of hand control on the choice reaction time nor did the reaction times change with order of appearance.
The two types of hand control systems used in the study could in uence the steering control in different ways. The drivers who used the single lever system could use only one hand for steering while driving without ACC while the dual lever system allowed the drivers to keep both hands on the steering wheel. In an earlier study ([1]) with quadriplegic drivers it was found that the variation in lateral position was 7 cm greater for those who used the dual lever system compared those driving with the single lever system. It was suggested that this could be caused by interference between the steering control and speed control. The analysis of lateral position data in this study showed that the dual lever users had 6 cm less variation in lateral position compared to the other. They drove also on average 14 cm more to the right in the lane. These findings were consistent for the complete route, free flow driving, and car following situations and independent of ACC condition. If the differences between the two subgroups were caused by the hand controls or if the groups were just different in their driving behaviour is hard to say. The differences between the groups found in this and the previous study are contradictory with respect to variation in lateral control.. ACC driving was expected to improve the lateral control by decreasing lateral variation as both hands could be used for steering but the analysis did though not revealed any decrease for none of the groups. This seems to support the idea that there were differences in driving behaviour between the groups which influenced the variation in lateral position The single lever users continued to steer with one hand most of the time (more than 70% of the time) even when the ACC was available. This might explain why there was no effects of ACC support on the variation in lateral position for these drivers. The driving task was though not very demanding with respect to lateral control and the benefit of having both hands available for steering control might appear first when the steering control demands get higher.
The general driving behaviour was analysed with respect to speed and lateral position. There were no effects of ACC mode or type of hand control system on the mean speed level. The mean speed level for the total route, including car following, overtaking, and stopping, was just below 90 km/h. Mean speed for free flow driving was approx. 5 km/h higher but the difference was not significant (5%). The variation in speed during free flow driving was reduced when the ACC was used.
This study did not include any critical situations but it is expected that the same safety considerations as for other driver apply also to drivers with disabilities but might be more prounced depending of the type of handicap. Drivers
with disabilities in general does though not seem to differ from other drivers with respect to traffic accident involvement on the contrary there is some evidence that they are less involved in accidents ([14]). ACC systems are aimed to increase the driver's comfort but the use of them might have negative safety implications due to high expectations ([12]). Form the driver s point of view the ACC might appear to include a Collision Avoidance System (CAS). Thus it is important to make the distinction clear between ACC and CAS to the user especially when the feedback of the ACC is designed ([15]). Feedback aspects of ACC driving should also be evaluated with respect to drivers with perceptual impairments. Control aspects of the ACC system were not explicitly considered in this study but it seems clear that the controls used were not optimally designed with respect to the group of drivers considered. Further testing would be of value.
The results from this study can be of value for the further development of the ACC application and the design of its HMI (Human Machine Interface). ACC systems are not yet available on the market. Only limited testing have been performed so far and there has not emerged very much guidance on how the ACC application should be designed in general and virtually nothing with respect to drivers with disabilities. The next step in developing the ACC could be to realise "green wave" or "stop and go" functions. Such features would make the ACC application even useful in more urban like environments and extend its value for drivers with disabilities.
CONCLUSIONS
* ACC reduced workload and increased comfort
* ACC support becomes more important over longer distances
* ACC was rated to improve speed and distance control in car following situations
* ACC system was well accepted, wanted and trusted
* ACC driving produced a shorter mean time headways compared to manual driving * ACC had no effects on speed level, variation in lateral position, or reaction time.
* ACC driving did not influence workload, comfort, and driving behaviour differently with respect to type of hand control used
ACKNOWLEDGEMENTS
This study was performed by the VTI as part of the DRIVE II Project V2032 (TELAID). The work was financially supported by the Swedish Transport Research Board (TFB). Saab Automobile provided the ACC system and AMU/K'avlinge the hand controls.
EN DNOTES
l. Peters, B. and L. Nilsson. Driving Performance of DSN (Drivers with Special Needs) using Hand Controls for Braking and Accelerating. in 26th International Symposium on Automotive Technology nd Automation (ISATA).
1993. Aachen, Germany: Automotive Automation Ltd, London.
2. Verwey, W. and R. Veenbaas, Driving Performance of Paraplegic Drivers using Common Hand Controls for Accelerating and Braking, . 1993, TNO Human Factors Research Institute: Soesterberg, NL.
3. Nicolle, C., T. Ross, and S. Richardson, Identification and Grouping of Requirements for Drivers with Special
Needs, . 1992: Thesaloniki, Greece.
4. Parviainen, J.A., W.G. Atkinson, and M.L. Young, Application ofMicro-Electronic Technology to Assist Elderly
and Disabled Travellers, . 1991, Transportation Development Centre Policy and Coordination Transport Canada.
5. Guthrie, B.M. and A.J. Philips. Market Estimates of Intelligent Transportation Systems for Seniors and People with Disabilities. in First World Congress on Applications of Transport Telematics and Intelligent Vehicle-Highway Systems. 1994. Paris, France: Artech House, London.
10. 11. 12. 13. 14. 15.
Nilsson, L. Behavioural Reseach in an Advanced Driving Simulator - Experiences of the VTI System. in 37th Annual Meeting of the Human Factors and Egonomics Society. 1993. Seattle, USA.
Nordmark, S. The VTI Driving Simulator - Trends and Experiences. in Road Safety and Tra ic Environment in Europe. 1990. Gothenburg.
Hart, SG. and L.E. Staveland, Development of NASA - TLX (Task Load Index): Results of Empirical and
Theoretical Research, in Human Mental Workload, P.A. Hancock and N. Meshkati, Editors. 1988, Elsivier
Science Publisher B.V. p. 139 183.
Byers, J.C., A.C. Bittner, and S.G. Hill. Traditional and Raw Task Load Index (TLX) Correlations: Are paired
comparisons necessary? in Advances in Industrial Ergonomics and Safety I. 1989: Taylor and Francis.
Nilsson, L., Driving with Autonomous Intelligent Cruise Control in Critical Traffic Situations. Effects on Driver
Behaviour, Workload and Attitudes, . 1995.
Nilsson, L. Safety E ects ofAdaptive Cruise Controls in Critical Tra ic Situations. in Second World Congress of Intelligent Transport Systems. 1995 . Yokohama.
Morello, E., Cross-Project Evaluation of Transport Telematics Applications; Final Report, . 1996.
Haslegrave, C.M., Car Control Conversions for Disabled Drivers, . 1986, TRL: Crowthorn, UK.
Duncan, B. and M. Fuchs. MMI Desing for AICC and Collision Avoidance Systems. in First World Congress on Applications of Transport Telematics and Intelligent Vehicle-Highway Systems. 1994. Paris, France: Artech