ALTERED AND ENHANCED IODARGYRITE WITH
BISMUTH TRIIODIDE FOR USE IN
PRECIPITATION ENHANCEMENT OPERATIONS
by
Paul Tilden Scott
Captain, USAF
Department of Atmospheric Science
Colorado State University
ALTERED AND ENHANCED IODARGYRITE WITH BISMUTH TRIIODIDE FOR USE IN
PRECIPITATION ENHANCEMENT OPERATIONS
by
Paul Tilden Scott
This report was prepared with support provided by the United States Air Force, Wright Patterson AFB under Colorado State University Contract 2523A; NSF contract
AEO-8420980, and NOAA contract NA85RAC-05070
InVeStigators: William G. Finnegan Peter C. Sinclair
Lewis O. Grant
Department of Atmospheric Science Colorado State University Fort Collins, Colorado 80523
April 1987
(
.
'. ,~\ "'\ '/ .
ABSTRACT
A new ice nucleant aerosol is developed from the principles of synergism. Two known ice nucleants, silver iodide (AgI) and bismuth triiodide (BiIg ) are combined as 2% AgI-NH.I X mole % BiIs NH.I in a water-acetone solution. The resultant aerosol after combustion is tested for effectiveness in the Colorado State University Isothermal Cloud Chamber (ICC), and the optimum ratio of AgI and BiI3 is determined to be 0.5 mole % BiIs. The effectiveness at this optimum ratio is an order of magnitude greater than AgI alone, although the temperature spectrum, rate, and mechanism are similar. A subsequent x-ray powder analysis identifies the optimum ratio aerosol as the iodargyrite form of AgI having the closest match to ice ever reported for a hexagonal crystal. Unlike other mixed AgI containing aerosols the resultant aerosol maintained its hexagonal form of AgI at all mole ratios of BiIs tested. Bismuth is at too small of a ratio to be identified through the method employed although it appears to be fully incorporated into the AgI crystal as an oxide or iodo-oxide. The plausible structure is looked at in light of epitaxial and active site theories of heterogeneous ice nucleation.
ACKNOWLEDGEMENTS
Research is certainly a pain at times and is not possible as a solo performance. This study was no solo effort and was aided in many ways. Many thanks to the Air Force Institute of Technology (AFIT) for the educational opportunity, the U.S. Air Force in providing the principal funding for this project (USAF, Wright-Patterson AFB, under Colorado State University Contract #2523A) and to Deep Water Chemical in supplying the bismuth triiodide. Special thanks also to the following: Dr. Peter C. Sinclair, Dr. William G. Finnegan, and the rest of my graduate committee for their enlightening advise, help and direction; William Watt for his engineering expertise and help in gathering the data; Becky Armstrong for her skill and devotion in typing and struggling with a new word processing package; Verna Dunn for substitute typing when Becky broke her humerus falling off Verna's horse; Jenny Martin for sharing her word processor and her help to Becky and me; Judy Sorbie for graphics; and Fredell Boston for putting up with me in the Library. Also, thanks to Dr. Dale Winder and Dr. Oren Anderson of the Colorado State Physics and Chemistry Departments, respectively, for their help in understanding crystal structure. My warmest thanks go to Pammy Tabor for getting me through the first year and my family at Rocky Mountain Church of Christ for their love and much encouragement through the stretch. For my Dad, a special thank you, and to Jacqueline, whom I love, thank you for saying yes. And most of all, I thank my God, especially for his love, his mountains, and the opportunity to ski.
In memory of
my beautiful and loving mother, Wilma Colleen.
Table of Contents
1 INTRODUCTION
1.1 Choice of an Ice Nucleant Aerosol 1.2 Purpose . ; . . . ..
2 HISTORICAL PERSPECTIVE
2.1 History and Nucleation Theory of AgI Containing Aerosols 2.1.1 Early work with AgI and Bils . . . . .
1 1 2 4 4 4
2.1.2 Heterogeneous Ice Nucleation Theory 5 2.2 Characterization of an Ice Nucleant. . . 7 2.2.1 Methods of Determining an Aerosol's Ice Nucleation Theory 7 2.2.2 Rates of Ice Nucleation . . .
2.2.3 Ice Nucleation Mechanism ..
3 INSTRUMENTATION AND PROCEDURES 3.1 Instrumentation . . . .
3.1.1 Isothermal Cloud Chamber 3.1.2 Vertical Dilution Tunnel . 3.2 Data Collection Procedures . . . 3.2.1 Experimental Procedure .
3.2.2 Collection of Sample for X-Ray Analysis . 3.3 Procedure of Data Analysis
3.3.1 Effectiveness 3.3.2 Rates . . . . v 8 9 12 12 12 14 14 14 15 15 15 16
3.3.3 Kinetic Approach to Rates . 3.3.4 Mechanisms... 3.3.5 Dilution Correction. . . . 4 DATA 4.1 Effectiveness Data 4.2 Rate Data . . . .
4.3 X-ray Powder Analysis Data
5 ANALYSIS
5.1 Effectiveness
5.2 Rates and Mechanisms .
5.3 Nucleant Morphology . . . .
5.4 Heterogeneous Nucleation Theory .
6 CONCLUSION 6.1 Future Research 6.2 Summary . . . . . vi 17 18 19 22 22 23 23 37 37 38 39 45 47
. . .
.
.
47.
. . . .
48List of Figures
3.1 Schematic of the CSU Isothermal Cloud Chamber 13 3.2 Example of a series (two stage) first order reaction 19
4.1 Effectiveness of nucleation versus varied mole ratios of Bih to AgI (in solution) . . . 26 4.2 Effectiveness of nucleation versus temperature for the aerosol
pro-duced via combusion of the optimum ratio soltuion of AgI and Bil3. 27 4.3 Rates of ice crystal formation comparing the aerosols produced via
combustion of AgI-NH4I- 0.5 mole % BiI3-NH4I . . . 28 4.4 Rate of ice crystal formationn at different temperatures produced
via combusion of the optimum ratio soltuion of AgI and Bil3 . . . . 29 4.5 Raw kinetic plots from rate data of Figure 4.3 . 30 4.6 Raw kinetic plots from rate data of Figure 4.4 . 31 4.7 Raw kinetic plots varying the liquid water content in the cloud
chamber . . .
. .
.
. . .
32 4.8 Kinetic plots of Figure 4.5 corrected for airflow dilution 33 4.9 Kinetic plots of Figure 4.6 corrected for airflow dilution 34 4.10 Kinetic plot of Figure 4.7 corrected for airflow dilution . 355.1 D-values of Table 4.1 applied to the iodargyrite structure of AgI 40 5.2 Proposed crystal structure of the AgI-BiX aerosol (right) with the
AgI crystal (left) as a reference. Silver appears as white atoms and iodine as dark atoms. . . . 43
vii
List of Tables
3.1 Air Flow Dilution Rates . . .
.
.
. . .
.
. .
.
.
. . . .
.
. .
.
.
4.1 Data from x-ray powder analysis...
20
36
5.1 Lattice Constants from x-ray analysis . . . 42 5.2 Correlation of Effectiveness with Percent Disregistry with ice 43
Chapter 1:
INTRODUCTION
1.1 Choice of an Ice Nucleant Aerosol
Weather modification programs are continually in need of an ice nucleant, whose optimum effectiveness, in producing ice crystals, will occur at temperatures warmer than -20°C and approaching ~OC. At these cloud temperatures sufficient moisture is often available, although natural ice nuclei are seriously lacking. While the major aim of research is searching for an aerosol more effective at warmer temperatures, there is also much to gain by a more cost effective aerosol. Silver iodide and silver iodide containing aerosols have long been in operational use, but the search continues to modify silver iodide to be more effective at warmer temperatures and more cost effective.
Precipitation enhancement programs must also have an ice nucleant which can be targeted. A nucleant with an unusually long time lag would be of little value in most seeding operations. This lag, as measured by the rate of ice crystal formation, is important in determining the location and type of delivery system, as well as the development of ice crystals and the actual precipitation process. The appropriate ice nucleant with the desired rate to match the intended target will greatly aid the success of a cloud seeding operation.
Another factor in selecting of an optimum ice nucleant is its behavior in particular environmental conditions. The behavior of an ice nucleant is manifested in its mechanism of ice nucleation. The mechanism will reflect whether the aerosol is suitable for a given cloud liquid water content. Vapor concentration which is temperature dependent will also greatly influence an aerosol's behavior.
2
A final aim in the choice of an ice nucleant aerosol is in understanding the chemistry of the aerosol catalyzed ice nucleation reaction. This is not normally a necessary part in the selection of an aerosol, but is important in the wider application of cloud glaciation operations. This is not completely possible yet, but inference can be drawn from chemical analyses and crystallographic research. Knowing why a particular aerosol functions well as an ice nucleant might be the best lead to subsequent research to find a better ice nucleant.
1.2 Purpose
The objective of this study was to investigate the synergistic interactions of two ice nucleants, silver iodide (AgI) and bismuth triiodide (BiIg ). Synergism is the
joint action of agents which when taken together increase each others effectiveness. Both AgI and BiIg were determined as ice nucleants almost forty years ago, but
little work has been done to promote BiI3 as an operationally used cloud seeding agent. AgI on the other hand, has been used in weather modification programs since its inception.
Another purpose is to determine the rate of ice crystal formation by the resultant aerosol. Rates of ice crystal formation and effectiveness at several different temperatures will also be determined. Such information is a necessity to make the resultant AgI-BiI3 aerosol useful in a cloud seeding operation.
A third purpose is to better understand the function of the aerosol as an ice nucleant. From the effectiveness and rate of nucleation, a mechanism of ice nucleation will be determined with some reliance on chemical kinetics.
Beyond this macro study of the mechanism, the microstructure of the AgI-BiIg resultant aerosol will be examined. Using an x-ray powder pattern analysis, the structure will be determined, and a direct correlation will be drawn between the crystal structure and the ice nucleating effectiveness of varying ratios of the AgI-Bilg hybrid aerosol. The conclusions drawn from this structure/effectiveness study will be used to examine the epitaxial (closest fit) and active site theories of
3
AgJ heterogeneous nuclection, shedding some light on these theories and creating new questions for further research.
>
Chapter 2:
HISTORICAL PERSPECTIVE
2.1 History and Nucleation Theory of AgI Containing Aerosols
2.1.1 Early work with AgI and BiIgVonnegut (1947) has generally been credited with the discovery of silver iodide (AgI) as an ice nucleant, although he has given credit to M. R. Block (Vonnegut, 1969). Albeit, Vonnegut was responsible for the pioneering work with AgI in the weather modification field; he developed the first solution combustion system for the generation of AgI aerosols. The AgI-ammonium iodide (NH"I)-acetone-water solution was quick-quenched to produce a sub micron AgI aerosol (Vonnegut, 1949). The NH4I was used to solubilize AgI in order to prepare pure AgI. The NH"I, used as solubilizing agent, is assumed to decompose during combustion (St. Amand, 1971) with no detectable incorporation into the AgI crystal (Von-negut, 1949). Other solution combustion methods of AgI aerosol production were subsequently tried and used operationally. The 2AgI-NaI acetone system was commonly used during the 1960's, but neither this nor any other acetone system was as effective as the original method of Vonnegut's (Garvey, 1975). NH"I as the solubilizing agent for AgI was reintroduced in 1970 (personal communication with William Finnegan).
Sano and Fukuta (1956) first discovered bismuth triodide (BiIg ) as an ice nucleant. BiIg was later shown to have a slightly warmer threshold temperature than AgI as an ice nucleant in freezing bulk water. Only lead iodide (PbI) proved to be a more effective nucleant than BiIg (Fukuta, 1958). Except for Fukuta's theoretical considerations explaining the nucleating ability of BiIg ,
5
research operations have not used BiT3 since 1958. The theorized reasons behind the ice nucleating ability of BiI3 are similar to AgI. This theory and the most generally accepted theories of AgI nucleation will be discussed in the next section followed by a section on the characterization of a nucleant.
2.1.2 Heterogeneous Ice Nucleation Theory
Vonnegut's initial decision to use AgI as an ice nucleant was based on the similarity of the AgI crystal structure to that of ice. Such a nucleant might better promote the epitaxial growth of ice crystals (Vonnegut, 1947). Crystal structure similarities are also attributed to the nucleating ability of BiIg • An
alternate theory of AgI nucleation suggests an active site mechanism. Evidence indicates impurities or defects on the surface of a nucleant are responsible for the adsorption of water in structural clusters (Fletcher, 1960, 1961). This theory might also be plausible for BiIg nucleation. However, it is unlikely that either process is solely responsible for the nucleation ability of an aerosol. Any attempt at bringing the structure of a nucleant closer to a match with ice will, as a matter of consequence, change the surface properties of that nucleant. An intended change of presumed active sites will likewise alter the structure of a nucleant. Therefore, the actual process of heterogeneous nucleation is probably a combination of these two theories. An examination of these theories in relation to AgI and BiIs will follow in this section.
Just as certain crystals can promote the phase transition of like or similar chemical bodies, it was reasonable to assume this principle could be applied to other reactions involving a phase transition. Turnbull and Vonnegut (1952) related the crystallographic theory of crystal nucleation catalysis to that of ice nucleation. In nucleation catalysis of alloy production, the nucleant or catalyst crystal structure similarity had a direct relationship to the crystal structure of the alloy produced and the temperature at which the phase transition occurred. The phase transition of water to ice via AgI nucleation showed the same direct
>
6
relationships. Accordingly, the 1.5% disregistry between the lattice constant of AgI and ice, accounted for the 2.5°C of supercooling required to freeze water. Turnbull concluded that a nucleant with a closer match to ice would be an even more effective nucleant. Vonnegut's initial choice of AgI and its subsequent success as a nucleant lends much credence to this closest match theory. Further evidence in support of this theory, was demonstrated with an ice.nucleant produced by a coprecipitating AgI and AgBr (Chessin and Vonnegut, 1971). The most effective ratio of AgBr to AgI was 40 mole % which showed 50% less supercooling (as compared to AgI) to freeze water. X-ray analysis of varying ratios of AgBr to AgI also indicated that the heretofore mentioned optimum ratio of AgBr to AgI also had the closest match to ice. However, this match was along the "a" axis only, and the resultant crystal structure was no longer similar to ice. The hexagon crystal structure of AgI had been changed to a face centered cubic with the addition of AgBr. Chess in and Vonnegut are careful to point out that the change in the lattice structure of AgI by AgBr might also cause alterations in other physical and chemical properties of the nucleant's surface that may affect nucleation.
The other theory, referred to here as the active site theory, was born in part because of doubts about the epitaxial growth of ice and the hydrophobic nature of AgI (Zettlemoyer, 1961). AgI, made free of hygroscopic impurities by react-ing pure silver with pure iodide, did not adsorb water and showed insignificant nucleating ability (Corrin, et al., 1964). Doped AgI, made by purposely contam-inating AgI with NO; showed a positive correlation between water adsorption and increasing amounts of contaminant. It was concluded AgI's effectiveness as a nucleant was due to impurities of hygroscopic sites (Corrin, 1967). The idea of contaminated AgI is a real occurrence, since the grade of AgI commonly used in combustion generation processes, is contaminated during its manufacture by hygroscopic residual by- products, e.g. alkali nitrates and halides (DeMott, 1982). In addition, Davis (1974) has shown the AgI aerosol generated via combustion
7
of the 2% AgI-NH4I-acetone-water-system required a trace of NH.,I for more effective ice nucleation.
Fukuta (1958) used a crystal structure approach to explain the apparent activity of BiI3 • He equated the "a" axis lattice constant of pseudcr hexagonal Bih (7.815 A) to the length of one side of the smallest hexangle of ice (4.5133 x
.J3
= 7.815A).
This might be stretching the closest fit theory a bit, but it might explain the juxtaposition of active sites.Clearly, neither of these theories independently resolve all of the questions of heterogeneous nucleation, but likely, it is a combination of both. The synergistic effect referred to by Corrin (1967) might be applicable to more than a nucleant-contaminant interaction. It seems plausible to look at the synergistic effect of combining two independent ice nucleants. This study may in turn shed more light on the theories of heterogeneous ice nucleation.
2.2 Characterization of an Ice Nucleant
2.2.1 Methods of Determining an Aerosol's Ice Nucleation Theory
Several methods of determining an aerosol's ice nucleation activity or effec-tiveness have been tried. Unfortunately, some methods only allow one mechanism of nucleation to operate, and all methods fail to bridge the gap between the laboratory and the real atmosphere. Early attempts used cold boxes (Shaeffer,
1946), but the small volume to surface area ratio accounted for severe diffusional loss of aerosol to the walls. In addition, temperature gradients and the distur-bance caused by the ice crystal counting technique make measurements totally unacceptable.
Following cold boxes, rapid expansion chambers emerged on the scene (Warner,
1957). Wall effects were reduced by treating the walls with glycol, but the rapid cooling induced by rapid expansion created high transient supersaturations. The
lIP'
8
rate (time dependence) of the nucleation process was also ignored. This gave little meaning to the number of ice crystals formed (Fletcher, 1958).
The membrane filter technique which utilizes membrane filters to capture aerosol particles (Bigg, et al., 1963; Stevenson, 1968), is a method that originally only allowed a vapor ice nucleation mechanism to function. The membrane filter is placed in an ice thermal diffusion chamber where the supersaturation of water vapor is controlled by maintaining a specific temperature difference between the filter surface and an ice surface above the filter. Though widely used, it also ignores the influence of the membrane substrate on the ice nucleation process (Fukuta, 1966; Schaller and Fukuta, 1979). More recently, the membrane filter teclmique has been improved to allow for contact nucleation by placing water droplets on a hydrophobic membrane filter. This technique has been used successfully in measuring active atmospheric nuclei (R. C. Schnell, 1979).
Many other teclmiques have also been employed to test the effectiveness of an aerosol, but only large cloud chambers have been routinely used to calibrate the effectiveness of aerosol generators and pyrotechnics used in weather modification programs. Colorado State University's Cloud Simulation and Aerosol Laboratory (Steele and Krebs, 1966; Garvey, 1975) has been a leader in large cloud chamber design, testing, and operation. The large volume minimizes wall effects and allows one to deal with the large aerosol samples generated from actual field generators. As discussed in section 3.1.1, the CSU Isothermal Cloud Chamber (ICC) does not suffer from the highly variable and high transient supersaturations of other methods. The CSU ICC can be said to represent a slow settling stratus cloud at water saturation.
2.2.2 Rates of Ice Nucleation
In the past, the time dependence of ice nucleation was termed the "time lag" . This "time lag" was investigated by Warner and Newham (1958). They found the rate of appearance and fallout of ice crystals decreased exponentially with
>
9
time. Unfortunately, this time dependence has often been ignored despite the importance of targeting a cloud seeding operation. Fletcher (1958) understood the importance of rate in referring to the uselessness of effectiveness without a specification of time. But, he incorrectly interpreted time dependence in terms of aerosol particles activated as a function of time and temperature which assumes depositional behavior. On the other hand Isaac and Douglas (1972) explain that the same results could have been attained by contact nucleation of small aerosols. In all chemical reactions, it is understood that energy barriers induced either physically or chemically, depend on a time dependent process. The significance of any reaction is highly questionable with an unacceptable (either too long or too short) rate of reaction. Therefore, any characterization of an ice nucleant aerosol is incomplete without a thorough understanding of the rate of ice nucleation.
2.2.3 Ice Nucleation Mechanism
Generally, four mechanisms of ice nucleation are agreed upon. These are defined here as follows:
vapor deposition - the deposition of water vapor directly to the ice phase to form an ice embryo
condensation freezing - the condensation of water vapor to the liquid phase followed by freezing to form an ice embryo
condensation to droplet freezing - the complete condensation of water vapor onto a nucleus to form a water droplet which subsequently freezes contact freezing - the freezing of cloud droplets upon direct contact by an ice
nucleus
The mechanism of immersion freezing (penetration of a drop by an aerosol particle, followed by freezing) is not discussed here, because it would be difficult to separate from contact freezing. Also, it is unlikely such a mechanism occurs naturally due to surface tension effects.
p
10
While the mechanisms above and methods to investigate these mechanisms have been discussed widely, only those ~ethods which delineate nucleation mech-anisms in competitive cloud situations will be discussed. The advantage is obvious from the point-of-view of weather modification, and affords the opportunity of testing those aerosols commonly used in cloud seeding operations. There are four methods known to have been used for investigating in situ ice nucleation mechanisms. The first method analyzed ice crystals obtained from an orographic cap cloud (Davis and Auer, 1972) and from the CSU Isothermal Cloud Chamber (Weikmann, et aI., 1970) for double structured frozen droplet centered crystals. These are associated with contact nucleation (Auer, 1970). Davis and Auer reported that increases in ice crystal concentrations during seeding operations with AgI (2% AgI- NH4I-water-acetone) at -12°C could be explained entirely by a collision nucleation mechanism. Wiekmann et al. reported that all aerosols tested are primarily contact nuclei at -17°C.
A second method for use in large cloud chambers used fluorescent tracer particles within cloud droplets to determine the percentage of ice crystals with frozen droplet centers (Katz and Pilie, 1974; Katz and Mack, 1980). Only 2-5% of the crystals formed were the result of contact nucleation at water saturation. Their work demonstrated circular center ice crystals were not unique to contact nucleation. Unfortunately, low liquid water contents and an impractical nucleant
(pure AgI) reduce the significance of their work.
A third method employed by Garvey and Davis (1975) recognized the depen-dence of contact nucleation on particle size and droplet concentration. Using the 2AgI-NH4I-water-acetone system, they noted the differences in ice crystal formation rates with changes in these parameters. The changes did indicate contact nucleation and they obtained excellent agreement between experimental and theoretical coagulation rate constants.
The final method used by DeMott (1982) employed chemical kinetic law to delineate mechanisms. He showed that AgI and AgI-AgCI operated primarily
p
11
as contact nucleants and theoretical calculations provided further proof. This method is also used here, to help characterize the AgI-BiIs-NH.I- water-acetone combustion aerosol.
p
Chapter 3:
INSTRUMENTATION AND PROCEDURES
3.1 Instrumentation
3.1.1 Isothermal Cloud Chamber
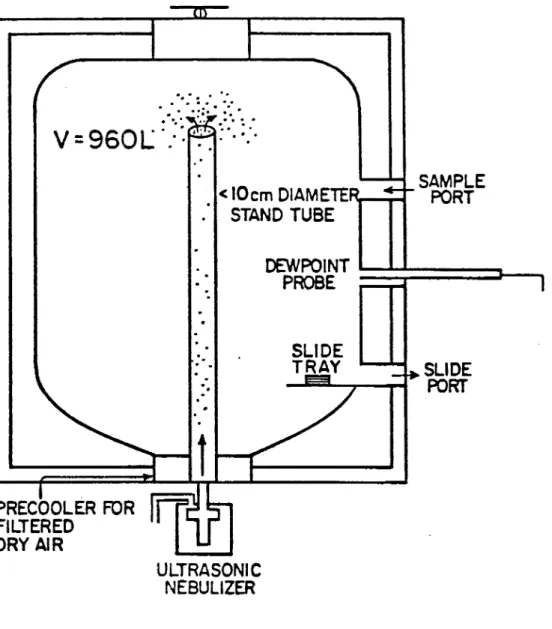
The CSU Isothermal Cloud Chamber (ICC) has been described in its present configuration by Garvey (1975). The only modification is a recalibration of the cloud inlet airflow, an important parameter in more accurately assessing the rate of reaction. This will be discussed in section 3.4.
A schematic of the ICC appears in Figure 3.1. A Cloud is produced by con-tinuous atomization of distilled water with a Monaghan 670 ultrasonic nebulizer. As the droplets rise, they are mixed with cold air and eventually escape out of the stand tube at the top of the cloud chamber.
The cloud density is controlled by varying the rate of droplet introduction into the ICC. A Cambridge dew point' hygrometer monitors the cloud moisture content. The difference between the saturation mixing ratio corresponding to the dew point temperature and the cloud temperature is the liquid water content (LWC). The LWC may be varied between 0.3 "and 3.0 gm-3• The homogeniety of
the cloud has previously been examined with an extended dew point probe. The accuracy of LWC measurements horizontally and in time has been found to be
±
0.15 gm-3 at 1.5 gm-3 LWC. At 0.5 gm-3 LWC accuracy decreases to±
0.20gm-3• LWC accuracies were determined at -12°C.
To maintain the cloud density, air must continually be circulated into and out of the cloud chamber. This air flow into the chamber was measured at each temperature used in this experiment, and must be taken into consideration in
...
13-.
...
' ..V
=
960l
<:";"f"r";:""
< IOem DIAMETEnr-""'T'"'t STAND TUBE SAMPLE PORT DEWPOINT~;:r===:::J---,
PROBE ~ PRECOOLER FOR FILTERED DRY AIR ULTRASONIC NEBULIZER SLIDE PORT14
determining effectiveness and rates of nucleation. Measured air flow values are used to compute the data in Table 3.1 and are assumed constant over time for a given temperature and liquid water content.
Temperature is monitored by an array of thermocouples and can be maintained to within ± O.02°C at an average chamber temperature of - 16°C. This increases to ±O.5°C at -20°C. The time response is limited by the chart recorder to 35 seconds.
3.1.2 Vertical Dilution Tunnel
The vertical dilution tunnel has also been described in detail by Garvey (1975). The tunnel is operated in a natural draft mode with the CSU standard test generator below the tunnel. Samples are taken at the first rooftop platform with a 4.0 liter syringe. Dry (-30°C dew point) air is available to dilute the sample as needed before insertion into the cloud chamber.
3.2 Data Collection Procedures
3.2.1 Experimental ProcedureMuch of the procedure evolved as this study progressed. The first phase was to test and optimize the ratio of BiIs to AgI for best effectiveness in ice nucleation. The first solution tested was a 2.0% AgI-NH.I-20.0 mole% Bils-NH.I in a water-acetone solvent. Each solution to be tested is burned in the CSU standard test generator and the resultant aerosol is collected with a 4.0 liter syringe. After collection and dilution with dry air, the resultant aerosol is injected into the ICC at -10°C. At 3 to 5 minute intervals, a slide is pulled and examined in a cold box microscope. Each slide is viewed at 5 different slide locations with the number of crystals per viewing area counted. These five crystal counts are averaged to get the number of crystal per viewing area. This process is cORtinued until the average number of crystals per viewing area is less than one crystal on two successive slides.
lIP'
15
The entire process is repeated until the cumulative crystal count on two or more experiments are within 10% of the mean. Subsequent solutions with decreasing mole ratios of Bils were tested in the same manner at -10°C.
After determining the ratio of AgI-Bils whose resultant aerosol has the highest effectiveness of ice nucleation, this aerosol was again tested over several temper-atures from _6°C to -20°C. It was also tested at -10°C for liquid water content of 0.5 gm-S in addition to the standa!d LWC of 1.5 gm-s. Changes in liquid
water content leading to changes in a reaction kinetic rate coefficient is the primary method of distinguishing between droplet dependent or vapor dependent mechanisms.
3.2.2 Collection of Sample for X-Ray Analysis
After determining effectiveness and rates for each solution, results suggested the need for an x-ray powder determination in an effort to identify the resultant aerosols and to intercorrelate the results. Aerosol samples were collected by placing a nucleopore filter attached to a suction pump in the dilution tunnel. About 1 hour was required to collect 1 gram of aerosol. The collected aerosols were then sealed in vials and sent to the Molecular Structure Corporation in
College Station, Texas to identify and determine crystal lattice spacings.
3.3 Procedure of Data Analysis
3.3.1 EffectivenessEffectiveness is defined as the total number of ice crystals which will grow and fall out per gram of aerosol. In the previous section, the method of counting crystals was discussed. The cumulative number of ice crystals counted during a single experiment is related to effectiveness through the following equation.
t r (#C / ) Ac D. RD
Euectiveness rystals g nucleant
=
Nic x - X-v.
x
-R
Av • g
1"""""'--16
Nic
-
cumulative number of ice crystalsAc
-
Cross-sectional area of cloud chamber (cm )A"
-
Microscope viewing area (cm )D.
-
Syringe dilution factorV.
-
Syringe volume(1)
RD
-
Wind tunnel dilution rate (ljmin)R,
-
Aerosol generation rate (gjmin)Ac , A" and V. are constants given by S.35 x 103 cm, 2.01 x 10⁻² cm, 4.0 liters,
respectively.
D. accounts for the syringe dilution needed to allow nucleation to proceed without over depleting cloud liquid water. At colder temperatures (e.g. - 16°C, three dilutions with dry air are needed. At temperatures warmer than -SoC, no dilutions are necessary. Syringe dilution factors employed are S.64, 74.7 and 646.0 for one, two or three dilutions with dry air, respectively.
RD
is determined from the vertical motion in the wind tunnel during aerosol generation. 1.0 x 10⁵ I min-1 is used for RD. This value can vary under variableatmospheric conditions; however, the resultant inaccuracies are minimized by multiple testing at different times on different days.
R, differs according to solutions used and the generator nozzle. This value is redetermined periodically and whenever the nozzle is cleaned or replaced.
The effectiveness equation (3.1) simply relates the laboratory situation to the real atmosphere. Some short falls of individual parameters are noted, and in most cases, repeatability of the data will limit errors. Other inherent problems in modeling the cloud chamber will be discussed in section 3.5 under dilution mechanisms.
3.3.2· Rates
The rate of reaction or ice crystal production is determined from the data by computing the percent production of ice crystals versus time. In this way, rates calculated from various runs can be compared despite differences in total number of crystals. Multiple tests at the same temperature and for the same aerosol are
17
averaged to obtain average and more representative plots. As already mentioned, variations in natural draft dilutions can affect both the concentration and sizes of aerosols. While data multiplicity can limit the concentration differences, par-ticle size can have a subtle effect on the nucleation mechanism. This limits the sensitivity of the data, and at present, arithmetic averaging appears appropriate.
3.3.3 Kinetic Approach to Rates
In an effort to better portray and discern the rate data, a chemical kinetics approach is used. DeMott (1983) showed the power of this technique in charac-terizing a mixed AgI-AgCI aerosol.
In a reaction
A _ Aerosol
B - H20
IC - Ice czrstals
A+B-+IC (3.2)
B is held constant and in great abundance so the reaction depends only on A. The kinetic expression is:
_ d[A]
= K[A]N
dt ob,
[A] _ Concentration of A Kinetic rate coefficient _ Order of reaction
(3.3)
In actuality, the reaction is second order (the reaction being dependent on both the concentration of A and B). However, by holding B in great abundance, the reaction depends only on the concentration of A (N = 1), i.e. pseudo first order. Integrating and solving for A: .
(3.4)
[A] _ the concentration of A at any time t
[A]o -
the initial concentration of A18
Although [A] is not an observed parameter, it can be put in terms of the product Ie, (one A reacts with one B to form one Ie) i.e.
[A]t
[IC]t
= 1
-[A]o
[IC],
[IG], _
the concentration of ice crystals at any time t[IC], _
the final concentration of ice crystals Substituting equation (3.5) into (3.4)[IC]t
In[1 -
[IC])
=
-Ko6IJ
t(3.5)
(3.6)
Because this equation was originally in terms of [A], as the reaction proceeds [A] is depleted. Therefore, the plot of equation (3.6) will have a negative slope. Taking the absolute value of equation (3.6) will give a positive slope. This will better represent the production of ice crystals as the reaction proceeds. Therefore, equation (3.6) is plotted as
{I
In[l -fJg];
I}
vs time (t) with the previously determined rate data. Ko6IJ represents the slope; thus, changes in the rate are easily observed as a change in slope.3.3.4 Mechanisms
The kinetics approach discussed in the previous section assumes a single stage pseudo first order reaction. Such a reaction would result in a straight line behavior inferring a reaction or mechanism with only one rate determining step. In the case of contact nucleation, contact is a rate determining step. This rate determining step is second order, but the overall reaction is pseudo first order by virtue of experimentally holding the water droplet concentration constant. Equation (3.7) below represents this process.
A+WD ~ WDN ~ IE~ IC (3.7) Where A represents an aerosol, WD N represents a nucleated water droplet, IE is an ice embryo or frozen droplet, and Ie is the ice crystal. K}, K2 , and K3 are the
19
rate constants associated with contact, freezing, and crystallization from the vapor phase respectively. Kolll is the overall rate constant experimentally determined. In contact nucleation, WD N ~ IE ~ IC is very fast so K2 and Ks are large and do not contribute significantly to the observed rate constant. If however, the rate constant associated with freezing were to represent a slower process and approached the rate constant associated with the contact step, straight line behavior would no longer be observed. Thus, straight line behavior will effectively eliminate condensation freezing and 'condensation to droplet freezing' as possible mechanisms. The delineation between contact and deposition mechanisms can be related to droplet concentration and will be discussed in the analysis of the data.
3.3.5 Dilution Correction
In adjusting the cloud chamber to conform to atmospheric conditions, the problems with syringe dilution have been noted. Colder cloud chamber temper-atures will show faster than normal rates. The exact effect is unknown. Other factors which also may affect the rate· and the effectiveness are airflow dilution and wall diffusion.
Wall diffusion is the diffusional loss of aerosol to the walls of the cloud chamber. It is very dependent on particle size and thus difficult to evaluate. Davis (1974) indicated wall diffusion is small compared to air flow diffusion and becomes much more negligible for higher air flows and faster rates. Consequently, wall diffusion
is not considered a major factor and is therefore neglected in this study.
Air flow dilution is independent of particle size, but very dependent on temper-ature and liquid water content. It can be determined quite easily (Davis, 1974). The kinetic expression for the loss of aerosol due to air flow dilution is:
(3.8)
a _ the air flow rate V _ the chamber volume
20
Integrating and solving
[A],
Q-In[-]AD
= ~t[A]o V (3.9)
Equation (3.8) is very similar to (3.6).
V
is the slope due to air flow dilution. Equation (3.9) and (3.4) can be combined to determine the corrected kinetic rate coefficient (Kcor):(3.10)
The corrected rate expression becomes:
(3.11)
Where
(3.12)
Thus, the data plotted with equation (3.6) is replotted using Kcor as the new slope. Values for
V
appear in Table 3.1.Table 3.1: Air Flow Dilution Rates
Temperature LWC (gm-3)
V
(min-I) -8 1.5 .0473 . -10 1.5 .0579 -12 1.5 .0651 -16 1.5 .0693 -20 1.5 .0751 -10 0.5 .0297Effectiveness can also be corrected for air flow dilution using the same method. Rewriting equation (3.4) and solving for [A],
21
Digressing from the corrected kinetic rate expression (3.11) to a differential form and noting again that one aerosol is assumed to produce one ice crystal.
_ d[A]
=K [A]
=d[IC]
dt cor . dt (3.14)
Substituting (3.13) into (3.14):
(3.15)
Integrating and solving for [IC]
(3.16)
As the reaction comes to a close, t~oo. Letting t~oo in (3.16)
(3.17)
Rearranging
[A]o =
K
06•[IC]
Kcor (3.18)
Therefore, K06./Kcor multiplied by the observed effectiveness ([IC]totol/g aerosol) will give an effectiveness corrected for air flow dilution. Correcting for air flow dilution gives a net result of increasing the total number of ice crystals since Ko6,
>
Kcor ; vice versa, airflow dilution decreases an aerosols actual effectiveness.Syringe dilution, wall diffusion, and air flow dilution also result in increasing the rate by accelerating the depletion of ae~osol.
Chapter 4:
DATA
4.1 Effectiveness Data
Effectiveness or number of ice crystals produced per gram of a nucleant aerosol is presented in Figures 4.1 and 4.2. Figure 4.1, effectiveness versus mole percent ratio of BiIs to AgI, shows the AgI/BiIs ratio which gives peak effectiveness. This ratio is 0.5 mole
%
Bits to 1 mole AgI in solution at a mean effectiveness of 4.3x 101", which is subsequently referred to as the optimum ratio. The small open
circles are data points from individual experiments. In order to better present the data, both ordinate and abscissa are 10glo scales. The effectiveness of the aerosols produced by combustion of a 2% AgI-NH .. I-acetone-water solution and a 2% BiIs-NH,.I-acetone-water solution are represented as horizontal dotted lines. These dotted lines show the theoretical left (AgI with no Bismuth) and right (Bils with no AgI) asymptotes. The upper solid line corrects this figure for airflow dilution. Figure 4.1 is not corrected for airflow dilution since its purpose was to show the optimum ratio of BiIs to AgI. Data points are represented by open circles. Figure 4.2, effectiveness versus temperature is shown as the dotted line. A temperature of -10°C and LWC of 1.5 gm-S are used for the generation of all this
data. -10°C was chosen somewhat arbitrarily as a place to start. Temperatures warmer than -10°C might have made it impossible to detect the effectiveness of some aerosols. Colder than -16°C would have caused many of the better mole ratio aerosols to approach the same effectiveness value. A LWC of 1.5 gm-S is chosen accordingly in addition to providing a competitive cloud environment of water droplets and vapor.
p
23
4.2 Rate Data
Rates of ice nucleation are shown in Figures 4.3-4.7. Individual data points are mean averages of all runs at that temperature. Figure 4.3 and Figure 4.4 show the percent of reaction completed versus time. The former compares the rate of ice nucleation with AgI and the ice nucleation rate of the optimum ratio. Both indicate similar rates. Figure 4.4 demonstrates rate as a function of temperature. LWC remains constant. Kinetic plots (equation (3.6)) of the same data are shown in Figures 4.5 and 4.6. While it is difficult to see any significant difference in the rates of Figures 4.3 and 4.4, their respective kinetic plots (Figures 4.5 and 4.6) provide greater resolving power for the rate differences. Figure 4.7 is a kinetic plot indicating rate as a function of LWC. This plot will serve as an aid in determining the mechanism of nucleation. The term raw data, in figures 4.5- 4.7 refers to the data not having been corrected for airflow dilution. Figures 4.8-4.10 corresponding to
r
igures 4.5-4.7 are kinetic plots corrected for airflow dilution.4.3 X-ray Powder Analysis Data
Three samples of varying mole ratios of Bi~ to AgI were chosen for x-ray powder analysis. Samples were collected and sent to the x-ray laboratory as mentioned in section 3.4. The three samples chosen were the aerosols produced via combustion of: the optimum ratio (0.5 mole percent Bils to AgI); AgI only; and a 10 mole percent ratio of Bil3 to AgI. From figure 4.1 these three aerosols represent a peak effectiveness, and left and right extremes of effectiveness, respectively.
The data received included d-values (crystal lattice spacings) with maximum probable errors; corresponding relativ:e irradiances, 2-Theta values, and peak widths for each sample. Table 4.1 presents this data. Computer identification of each aerosol sample indicated, in all cases, AgIjIodargyrite, i.e. the hexagonal crystal form of AgI as opposed to the cubic form. Analysis of this data and
p
24
reduction of lattice spacings (d-values) to lattice constants is discussed in the next chapter.
-
c o ~=
"0 III C =..-
tID<
3
'"
-S
<
1015
-
-
c 0 Q) 10'4 -0 ::::J C15
~
..!!l 0 1ii 10'3 >. '-u Q) u.-~
II) 1012 II) Q) C Q) > :;:: U Q)....
W
0" o o 8 • 0.flJl
o•
o ~---A---2%AgI'NH41 (noBi13 )-I
I
CSU Standard Generator
o2% AgI' NH4 I with varied mole ratio of 8i13
LWC
=
1.5 9
m-
3T= -Iooe
I
Natural Draft
8 o o - - - 2 % B i I3·NH41 ( n o A g I ) -1010, I I I I I , 0.001 0.01 0.1 1.0 10 100Percent Mole Ratio of 8iI3 to
Imole Ag I in Solution
N
p
27IdS
-
'6
10'5
~
D'"
JD1c:J4
!
.,
CSU Sfandard Generator
.w
2
%AgI·NH
41
I0.5mole
%BiI
3
•
1013
-
LWC
=
1.5gm-
3 fitNatural Draft
fit-
>10'2
~
1&JlOll
IOm~~__
~~~~~~~~~~~~__
~~__
~o
-2 -4 -6 -8 -10 -12 -14 -16 -18 -20 -22 -24
TEMP (OC)Figure 4.2: Effectiveness of nucleation versus temperature for the aerosol produced via combusion of the optimum ratio solution of AgI and Bih. The dashed line represents the best fit to the observed data points, and the upper solid line represents the observed data corrected for airflow dilution.
p
28 100e
A
A 90,
i
Ii
0 2·I.AQI·N~I 4 2-t. AgI· NH.aIlO.5mol.".Bi IS c60
0J
50
•
CSU Standard GeneratorT=-IO°C
'0
40
LWC=1.5gm-
S-
i
30
Natural Draft u~
4 0o
35 40
TI ME (min)Figure 4.3: Rates of ice crystal formation comparing the aerosols produced via combustion of AgI-NH4I-o.5 mole % BiIs-NH4I.
29
100
I
•
•
I
90
i
•
o T=-20.C•
~ x AT· -16·C GI-
& • T· -12·C .J! Q. X T. -IO·C~
0 & T. - S·C ueo
•
CSU Standard Generationi:
.2
x 2°/oAgI· NH 4I/0.5mole °/oBiI3-
u &~
LWC= 1.5gm-3'0
0 Natural Draff-
i: A GI•
~ xct
20
& 100
35 40
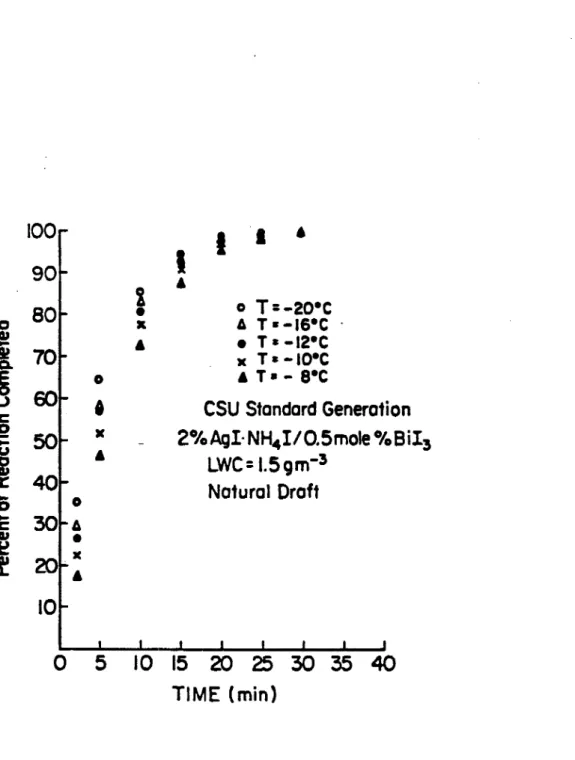
TIME (min)Figure 4.4: Rate of ice crystal formationn at different temperatures produced via combusion of the optimum ratio soltuion of AgI and Bil3 •
-
-ul'U'
...
--
I-
Z ..J3.0
---g5 Reaction % Complete 30csu
Standard GeneratorLWe
=
I.5 9
rn'"3Temp.
-Iooe
Natural Draft
Row Data
•
2%AgI'NH
4I1 : 0.5 mole %BiI3
Reaction o---2%AgI'NH~I50·/. Complete
15
20
25
TIME (min)
J> 31
3.0
...
2.0
~~
.... M--
t-..
Z .J1.0
-20e
--16 x----12 6---10 +--_.--80-·--"-5
10 1520
25
30
TIME (min)ass
3.0
-~
... _ 2.0
-
ou
-
...
~--
I--
3
1.0
V
32 Reaction 95% complete,
/
/ ' /
/ //
/ 0/
/
/
0 / 7 /, /
/.:/ esu
Standard Generatar ~ ~/oAgI·NH4I:0.5mole%8iI3/
Temp
=
-Iooe
/
/0
Noturol Draft Raw Datae-1.5gm-
3LWe 0---0.59 m-3 LWe10
15
20
25
30
35
TIME (min)Figure 4.7: Raw kinetic plots varying the liquid water content in the cloud chamber
33
3.0
2.0
--
-ulu
t-4 ....--
-
f-
3
1.0
- - 2% AgI· NH
4I:0.5mole % BiI
3--2% AgI·NH
41
5
10
15
20
25
30
35
TIME
(min)3.0
1.0
34
Corrected for Air Flow Dilution 2 0 1 6 --12 1 0 · _ ·
-
-8-··_··-0~---~5---~IO---~15~~2~0---~2~5--~~~---~35
TIME (min)p
3.0
~~
-...
~ ~2.0 -.......
I Z ..J1.0
35csu
S1andard Generator2 %
AgI· NH4I:
O.Smole 0/0BiI3
Temp=-IO°C Noturol Draft---1.5gm-
3LWC
---0.5gm-
3LWC
/ ' ' / ,;' / ' / ' / ' . / / ' ,;' / ' . / . / / ' . / . / . / . / . / . / . /Corrected for Air Flow Dilution . / . / . /
10
15
20
25
30
35
40
TIME (min)36
Table 4.1: Data from x-ra;y powder analysis, Wavelengths used 1.54184, 1.54056, and 1.54439.
2% AgI-NH,I-D.5 mole % BiIs-NH,I D value I/IMAX D1:3.96607
±
.00350 33.60 D2:3.74654±
.00311 100.00 Ds:2.29252±
.00112 69.10 2% AgI-NH,I D value I/IMAX D1:4.00237±
.00356 36.10 D2:3.77846±
.00317 100.00 Ds:2.30544±
.00114 76.80 2% AgI-NH,I-lO mole % BiIs-NH,ID value I/IMAX D1:4.01007
±
.00358 47.00 D2:3.78373±
.00318 100.00 Ds:2.30681±
.00114 83.00 I : 1 '»
Chapter 5:
ANALYSIS
5.1 Effectiveness
One of the most striking features of ice nucleation by the AgI-BiI3-NH.I system is seen in figure 4.1. The highest effectiveness occurs at a ratio of 1 mole AgI to 0.5 mole% BiI3. This kind of specific mole ratio of one compound to another compound has also been demonstrated in other ice nucleation aerosols. DeMott (1982) produced a mixed AgI-AgCI aerosol via solution combustion of a 2% AgI-NH.I-acetone- water with varying mole ratios of NH.CIO •. He attained the highest effectiveness with a ratio of 30 mole% NH. ClO •. Vonnegut and Chessin (1971) with their AgI-AgBr aerosol produced the highest effectiveness with a ratio of 40 mole% AgBr. However, the relative proportions of reactants AgI and BiI3 is different from previous AgI containing aerosols in that the mole concentration of silver is 200 times that of bismuth. The aerosol of this ratio also has an effectiveness an order of magnitude greater than AgI alone, which demonstrates the dramatic change such a small port~on of another compound (BiI3) can have on the resulting ice nucleant. The reasons for this increased effectiveness by the optimum ratio of AgIjBiI3 resultant aerosol will become clear upon examining the morphology of the resultant aerosol in Section 5.3.
Figure 4.2 shows the optimum ratio approaching a limiting effectiveness of 1.1 x 10¹⁵ at -20°C. This is not surprising, however since all nucleants approach some minimum temperature at which a limited effectiveness is attained. Better effectiveness at warmer temperatures is a common goal for weather modification programs, but _6°C is the warmest temperature used in this study. It is clear,
38
however, that the optimum ratio AgI/BiIs resultant aerosol is not a warm tem-perature candidate.
5.2 Rates and Mechanisms
Raw rates of ice crystal formation are shown in Figures 4.3 and 4.4. It is immediately obvious from Figure 4.3, that the standard AgI aerosol is somewhat mimicked by the optimum ratio AgI/BiIs aerosol. Thus, the rate and mechanism are probably similar, but the efficiency of ice crystal catalysis (figure 4.1) is much greater for the optimum ratio aerosol. The process of ice crystal formation is a very slow process taking 30 minutes or more for completion, but as much as 90% of the reaction is complete in less than 15 minutes.
Figure 4.4 clearly shows that the ice crystal formation rates are a function of temperature, i.e. the rate increases with decreasing temperature. Also each curve has a similar exponential shape. These factors indicate the aerosol probably functions in the same way at all temperatures and also functions like the standard AgI aerosol. However, kinetic plots are needed before the true character of these rates can be discerned.
Figure 4.5 and 4.6 are raw kinetic plots of the previous rate data. Indeed, the data is easier to discern in relation to rates. The ice formation rate of AgI and the optimum ratio aerosol in figure 4.5 are no longer inseparable. The rates are similar, but are not identical. The optimum ratio aerosol has slightly faster rate of ice crystal formation. Figure 4.6 demonstrates the temperature dependence of ice formation rates much more clearly than the nonkinetic plots of figure 4.4. However, more important in both figure 4.5 and 4.6 is the straight line behavior of the data. As mentioned in section 3.3.4, linear behavior is indicative of a single stage pseudo first order reaction. All temperatures indicate pseudo first order with a singular mechanism of ice nucleation. To determine the actual mechanism, the relationship between rate and liquid water content must be determined.
39
The liquid water contE~nt and temperature of a supercooled cloud parcel could make a big difference in the nucleation rate and mechanism in operation. Of course, the ICC allows on.e to maintain a constant temperature and liquid water content to better discern the mechanism present. As mentioned before, in a constant volume saturated environment such as the ICC, a decrease in liquid water will lead to decrease in droplet concentration. Vapor concentration remains constant because it is temperature dependent. Therefore, a change in liquid water would have no effect on a vapor dependent process. On the other hand a droplet process such as contact nucleation would show a change in rate. Figure
4.7 shows a direct relationship between liquid water content and rate of ice crystal formation. Clearly, at -lOOC and all temperatures tested, the optimum ratio AgI-BiIs resultant aerosol employs contact nucleation in the production of ice crystals. Contact nucleation is a psuedo first order (second order) single stage reaction. DeMott's (1982) kinetic study of' AgI-AgCI indicated many of the same results. However, at - 20°C his aerosol demonstrated a vapor dependent mechanism beyond 20 minutes. IT this mechanism exists for the optimum ratio aerosol it is disguised in the noise since the reaction is 96% complete in 18 minutes. Otherwise the optimum ratio AgI-BiIg aerosol serves as a contact nucleator in the production of ice crystals with a slightly faster rate of reaction as the standard AgI aerosol.
5.3 Nucleant Morphology
During the early stages of this study, it was suspected that BiIg underwent some stage of oxidation during the quick quenching process after combustion generation. The first real clue came in the erratic data generated when the 3% AgI-NH4I-x mole % BiIs solution remained idle for a period of time. In addition, a flask of solution lost its characteristic "red Kool-Aid" color, turning brown and murky, after only one day. The aerosol generated via combustion of a 0.25% BiIg-NH4I solution was identified from color and melting point as Bi20s,
IP
40
confirming BiIs readily oxidizes. As an ice nucleant, Bi20 s demonstrated minimal
effectiveness (Figure 4.1). There is, however, no indication the bismuth form incorporated into the crystal structure of the hybrid AgI-Bi aerosol is Bi20s. As will be inferred from the x-ray analysis it is, in fact, very unlikely the incorporated form of bismuth is BhOs .. Hence, the resultant aerosol will be referred to as AgI-BiX since the exact form is unknown.
As mentioned in the previous chapter, each of the three samples were identified from an x-ray powder analysis as iodargyrite, the hexagon crystal form of AgI. Neither bismuth nor a form of bismuth was detectable. This is unusual because, even in the case of the aerosol generated from a 10 mole
%
BiIs to AgI, the dominant crystal form remains hexagonal. It is assumed that all mole ratios of BiIs result in iodargyrite. Other mixed AgI containing aerosols such as AgI-AgBr and AgI-AgCI have a face centered cubic structure (Vonnegut and Chessin, 1971; and Palanisamy, et al., 1986). Since the form of bismuth does not change the type of crystal structure, it must not exist as Bi20s. Bi20s has its own crystal structure,namely monoclinic with a pseudoorthorhombic structure type. The existence of Bi20s would preclude the formation of the close packed hexagon structure of AgI.
Instead the form of bismuth is fully incorporated into the AgI crystal, and this form is probably inseparable from AgI as an independent molecule or crystal, such as BizO" or BizO"Iz (Personal communication with Dr. Oren Anderson).
The changes bismuth imposes on the crystal structure of AgI will be seen later. First, it is important to relate the d-values of Table 4.1 to the iodargyrite crystal structure (figure 5.1). From simple geometry, the lattice constants along the "c" and "a" axis are determined and given in Table 5.1. The published lattice constants of Agl and ice are given for comparison. It is immediately obvious
41
T
Dz
1
c
Figure 5.1: D-values of Table 4.1 applied to the iodargyrite structure of AgI showing the basal and prism planes. Silver appears as white and Iodine as dark atoms
p
42
Table 5.1: Lattice Constants from X-ray Analysis
Sample "a" Lattice Constant "c" Lattice Constant AgI aerosol 4.616
±
.002 7.447±
.006 AgI-D.5 mole%
Bil3 4.583±
.002 7.493±
.006 AgI-10.0 mole%
Bil3 4.622±
.003 7.567±
.006 *AgI 4.5955±
.002 7.5005±
.003 *Ice 4.521±
.001 7.367±
.001 *From CRC Handbook of Chemistry and Physics standard deviation of errors (8) = 0.0019the closest match to ice is the optimum ratio AgI-BiX aerosol. The difference in lattice constants between the AgI aerosol and the CRC published values for AgI lie in the method of AgI preparation. That is, AgI is somewhat unstable and the method of preparation or collection (Le. precipitate, quick-quench, natural or pyrotechnic) may gr'eatly affect the structure. For example, the preparation methodology may contribute as much as one percent oxygen or carbon into the final AgI structure (personal communication with Dr. Dale Winder). But, the most important conclusion from table 5.1 and the x-ray analysis is that the optimum ratio AgI-BiX aerosol has the closest hexagonal match to ice ever reported. Other aerosols have shown a closer match to ice along a single plane such as the AgI-50 mole
%
AgBr aerosol (Chessin and Vonnegut, 1971) or Metaldehyde (the 110 plane) (Fukuta, 1963). However, none had the hexagonal symmetry more similar to ice.Another important point to draw from Table 5.1 are the differences between lattice constants of the three samples with ice. These differences are statistically significant as can be seen from each constant's error. Table 5.2 emphasizes these structural differences. The disregistry with ice is the percent difference between
>
43Table 5.2: Correlation of Effectiveness with Percent Disregistry with Ice
Sample
AgI
AgI: 0.5 mole % Bils AgI: 10 mole
%
BilsIce % Disregistry a 2.10 1.34 2.23 0 Effectiveness c (ice crystals/g nuclei) 2.58 5.6 x 10¹³
1.72 4.4 x 10¹⁴
2.72 4.0x 10¹²
0
the lattice constants of each sample with ice. Again, the optimum ratio AgI-BiX aerosol has the better match with ice. One can only speculate as to how BiX brings the AgI-BiX crystal into a closer match with ice. In the possible substitution of oxygen and bismuth for iodine and silver, there is a decrease in the ionic radii for each respective substitution. The incorporation of a foreign ion(s) would necessarily cause a strain in the lattice. This "lattice distortion" will be smaller or larger than the original lattice depending on the ionic radii of the foreign ion(s) (Palanisamy, et al., 1986). AgI-AgBr and AgI-AgCI both show such a "lattice distortion" in substituting smaller ionic radii bromine and chlorine for iodine (Vonnegut and Chessin, 1971; P alanis amy, et al., 1986). Figure 5.2 gives a plausible AgI-BiX crystal. The left portion of Figure 5.2 shows a model of AgI while the right portion shows the strained AgI with a bismuth substituted for one silver and two oxygens substituted for two iodines. 0- and Bi+3 have ionic radii of 1.40
A
and 1.20A.
While 1- and Ag+ have ionic radii of 2.16A
and 1.26A,
respectively. The result is a smaller crystal. The relative size of each crystal may be compared ideally by overlaying the bottom structure on top of the upper structure of figure 5.2. It is hypothesized that this modified AgI crystal, by being a closer match to ice, imposes less strain during the epitaxial growth of ice.In relating this model with Table 5.2 and Figure 4.1, as the amount of bismuth is decreased from 0.5 mole percent, a fewer number of AgI aerosol particles are shrunk. The effectiveness, in turn, approaches the effectiveness value of AgI. As
Figure 5.2: Proposed crystal structure of the AgI-BiX aerosol (right) with the AgI crystal (left) as a reference. Silver appears as white atoms and iodine as dark atoms.
.:..
.:..
p
45
the amount of bismuth is increased from the optimum AgI-BiI3 ratio, too much bismuth disrupts or strains the AgI crystal moving the structure away from a match with ice. Also, excess bismuth, as Bi203, swamps the aerosol population as
a competing aerosol particle with poor ice nucleating abilities.
While a direct mathematical correlation between disregistry and effectiveness seems obvious, three data points would hardly make such a correlation significant. This is an area where further research could be done. Other evidence and specu-lation as to the nature of the AgI-BiX aerosol will be discussed with reference to heterogeneous nucleation theory.
5.4 Heterogeneous Nucleation Theory
Much of the credibility for the "closest fit" argument is the theory of Turnbull and Vonnegut (1952) which relates an aerosol's disregistry with ice to its threshold temperature of ice nucleation. In an attempt to relate the data of this study with Turnbull and Vonnegut's epitaxial dis registry theory, a bridge between the theory and experiment was sought. Unfortunately, effectiveness data is too inaccurate to be able to relate to the minimum temperature of ice nucleation. However, the AgI-BiX aerosol clearly owes much of its ice nucleation ability to its close match with ice. A complete x-ray analysis of many different ratios of AgI to BiI3 could establish this relationship in much greater detail. The only remaining question may relate to what chemical or other changes might have occurred during the 'lattice disruption'. This is examined in the next paragraph.
Another aspect of heterogeneous nucleation theory is the active site theory. The data of this study presents a less quantitative picture for the study of the active site theory. However, the small amount of BiX incorporated into the AgI lattice mechanism. A small ratio of a compound could improve the nucleating ability of AgI by altering or augmenting sites to make them more hygroscopic (Corrin, et al., 1967)" If the form of bismuth is an oxide, this might better facilitate water cluster formation (Zettlemoyer, et al., 1963). This theory also
....
46
better explain more fully the quick drop off of effectiveness with ratios of Bils greater than 0.5 mole percent. Too many hygroscopic sites (i.e. oxide surfaces) might create a water monolayer which would prevent the formation of water clusters. Water clusters are thought to be a possible precursor to freezing. Too many hygroscopic sites might also favor a slower deposition mechanism versus a faster contact freezing mechanism (Edwards and Evans, 1968). Figure 5.2 which served as a plausible structure for the epitaxial theory also serves as a plausible model for the active site scenario. The model of figure 5.2 exposes two oxides on perpendicular faces of the iodargyrite crystal. But, just as one model will explain both epitaxial and active site theories, it is impossible to argue totally in favor of one theory at the expense of the other. As the crystal structure of AgI shrinks to become a closer match with ice, sites are modified and brought into a better juxtaposition for active site nucleation. Thus, both theories of nucleation catalysis are probably operating in concert.