DISSERTATION
AMINO ACID TRANSMITTERS AND THE NEURAL CONTROL OF FEEDING AND ENERGY HOMEOSTASIS
Submitted by Matthew S Dicken
Department of Biomedical Sciences
In partial fulfillment of the requirements For the Degree of Doctor of Philosophy
Colorado State University Fort Collins, Colorado
Spring 2016
Doctoral Committee:
Advisor: Shane T. Hentges Michael M. Tamkun
Gregory C. Amberg Ronald B. Tjalkens
Copyright by Matthew Scott Dicken 2016 All Rights Reserved
ABSTRACT
AMINO ACID TRANSMITTERS AND THE NEURAL CONTROL OF FEEDING AND ENERGY HOMEOSTASIS
Consuming the correct number of calories to maintain a healthy bodyweight is a delicate balancing act between intake and energy expenditure, and humans in modern society seem to have a keen knack for throwing the balance off-center. In the U.S. alone, more than 1/3 of adults are obese based on the body mass index scale, and $147 billion is the estimated annual medical cost for obesity in the United States. On the other end of the feeding spectrum, anorexia in the U.S. has been steadily rising since the 1960s, and has the highest mortality rate of any mental illness. While great strides have been made in understanding the neuronal regulation of energy balance, there is a need to more fully understand the homeostatic systems within the
hypothalamus that are so powerful that they are able to drive individuals to poor health or death, often even in the face of consciously fighting their urges.
Two groups of functionally opposed neurons contained within the arcuate nucleus of the hypothalamus, Neuropeptide Y / Agouti-related peptide (NPY/AgRP) and proopiomelanocortin (POMC) cells (the so-called first order feeding neurons), have been extensively studied for their roles in energy homeostasis—mostly through research into the peptides they are named after. There is clear evidence that peptides play an essential role for the function of NPY/AgRP and POMC cells, but what about simple amino acid transmitters? While it is known that GABA is packaged and released by NPY/AgRP cells and that this release is relevant to feeding behavior,
there is still a dearth of information about this aspect of the circuitry, very much an area waiting to be mined.
This study focuses on better understanding the functional release and relevance of amino acid transmitters packaged in both NPY/AgRP and POMC cell populations. Evidence is
presented here for the conclusive release of both GABA and glutamate from POMC cells within intact circuitry. For NPY/AgRP neurons, evidence is presented for a shift in functional release of GABA from these neurons onto POMC cells depending on feeding state, corroborated by
concurrent in situ hybridization experiments. Using a combination of electrophysiology and in
situ hybridization approaches, evidence is also provided that mRNA levels of glutamate
decarboxylase can act as a general proxy for functional GABA release.
Altogether, these results indicate that amino acid transmitters play a significant role in first order feeding neuron physiology. Not only does this warrant further study on the
significance of each transmitter alone and their purpose in comparison with the peptides released, but also the interplay between POMC cell and NPY/AgRP cell amino acid transmitters and their many shared downstream targets. Imbalances in proper glutamatergic and GABAergic signaling may significantly contribute to obesity, and advancing this area of study could lead to correcting those imbalances to restore healthy energy homeostasis.
ACKNOWLEDGEMENTS
Graduate school has been an amazing experience for me—mostly positive, but not always. Fortunately, I have always had a great accompaniment of individuals to help me achieve my successes in knowledge and publication, as well as give me courage in the face of my
struggles. First and foremost, I could not have asked for a better mentor in Shane, whose wealth of knowledge, pragmatism, encouragement, humor, and honesty molded me into the scientist I am today. She maintains an amazing lab environment built for success and personal growth; after all—“every day in the Hentges lab is a holiday.” I would also like to thank the rest of my
committee, Mike, Greg, and Ron, for the support and constructive input they provided; there were more than a few times when I walked into their labs for some enlightenment. My good friends and labmates also deserve thanks, especially Connie, Reagan, Phil, Jacob, and Steven who helped me throughout my graduate career in a multitude of ways both research-related and not.
I would also like to express my gratitude for my girlfriend Caitlin, as well as my mom, Jane, the two most supportive and loving family members a person could have. They
TABLE OF CONTENTS
Abstract ... ii
Acknowledgements ... iv
List of figures ... vii
Chapter 1: Introduction ...1
1.1 Obesity ...2
1.2 Endocrine and peripheral input into the central nervous system ...3
1.3 Hypothalamic regulation of energy balance ...6
1.4 General hypotheses and aims of the study ...20
Chapter 2: Regulation of GABA and glutamate release from proopiomelanocortin neuron terminals in intact hypothalamic networks ...22
2.1 Summary ...22
2.2 Introduction ...23
2.3 Materials and Methods ...24
2.4 Results ...28
2.5 Discussion ...36
Chapter 3: Gad1 mRNA as a reliable indicator of altered GABA release from orexigenic neurons in the hypothalamus ...41
3.1 Summary ...41
3.2 Introduction ...42
3.3 Materials and Methods ...43
3.5 Discussion ...60
Chapter 4: Conclusions, extensions from findings, and future directions ...64
4.1 Summary, weaknesses, and future directions for presented research ...64
4.2 Related experiments ...69 4.3 Final Remarks ...77 References ...78 Appendix I ...95 Appendix II ...96 Appendix III ...103 List of abbreviations ...106
LIST OF FIGURES
1.1 Opposing first order feeding neuron populations are located in the arcuate nucleus of the
hypothalamus ...10
1.2 Classical paradigm of opposing first order feeding neurons ...13
2.1 POMC cell-specific expression of functional ChR2 ...29
2.2 POMC neurons release GABA and glutamate onto cells within the arcuate nucleus ...32
2.3 Light-evoked IPSCs and EPSCs are inhibited by opioid receptor activation ...34
2.4 Mu and kappa opioid receptors mediate inhibition of evoked release from POMC terminals ...35
2.5 GABA-B receptor activation inhibits GABA release from POMC terminals ...36
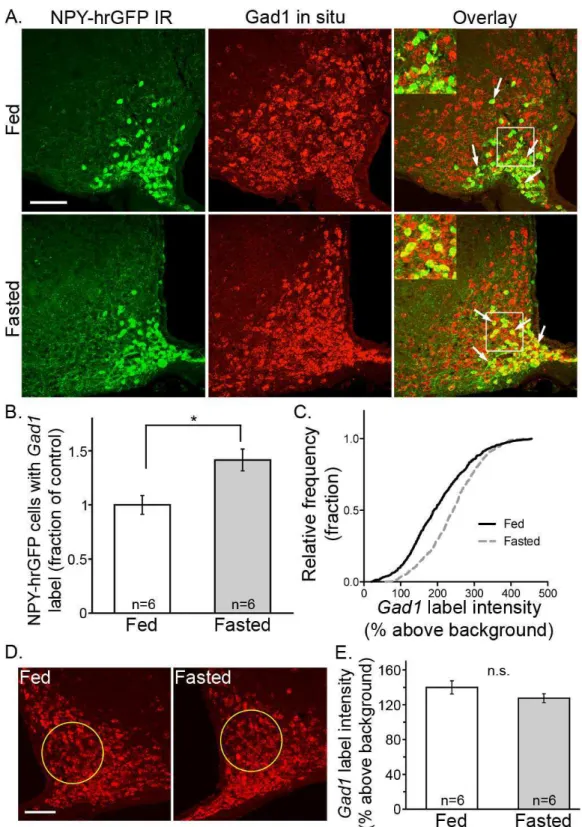
3.1 Gad1 increases in NPY/AgRP cells after an overnight fast ...49
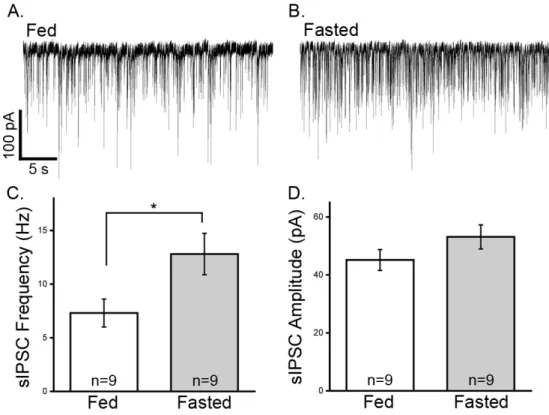
3.2 Spontaneous GABA release onto POMC cells is increased in fasted animals ...51
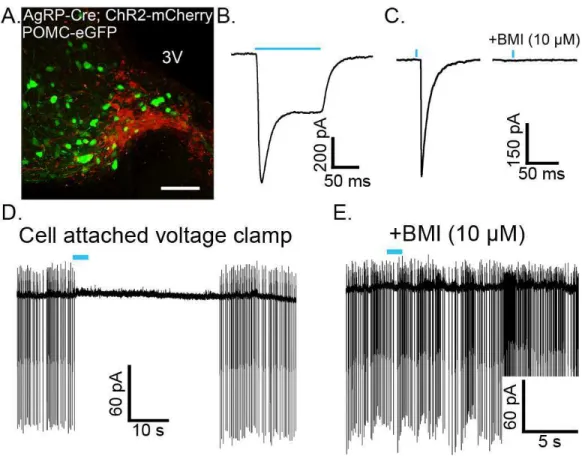
3.3 AgRP cells expressing ChR2 reliably release GABA onto POMC cells when stimulated ...53
3.4 Fasting increases the probability of release from NPY/AgRP cell terminals presynaptic to POMC neurons...55
3.5 Fasting increases the readily releasable pool of GABA in NPY/AgRP cell terminals ...55
3.6 Inhibiting the GAD enzyme reduces autaptic GABA release from NPY/AgRP cells in culture ...58
3.7 Leptin injection decreases Gad1 in NPY/AgRP cells and decreases probability of GABA release ...59
4.2 Spontaneous GABA release onto POMC cells is unaffected by removing the ability of
NPY/AgRP cells to release GABA ...72 4.3 vGlut2 deletion in POMC neurons increases weight gain in males on a high-fat diet ...74 4.4 GABA and glutamate are released by NTS POMC-Cre neurons ...76
1. INTRODUCTION
One of the largest current questions within the science of feeding and energy balance is this: with the multitude of targets discovered and much of the neural circuitry known, why hasn’t a highly effective drug treatment for obesity been developed? More specifically, it has been decades since Jeffrey Friedman’s group discovered the amazing adipogenic satiety peptide hormone they named leptin, so why do we currently have a dearth of pharmaceutical treatments for obesity, and those that do exist are only marginally better than their side-effects (e.g.
glucagon-like peptide-1 receptor agonist Saxenda and 5-HT2C receptor agonist Belviq)? The
simple, as well as lazy, answer is that there is still much unknown in the field, and the search for the magic bullet continues. The more descriptive answer is that our current understanding of feeding, until recently, was based mostly on a simplistic model of yin and yang (signals of hunger and satiety), which lacked the depth of receptor complexity, asymmetric circuitry,
pathway redundancy, and neurotransmitter variety present in a complete model. The field has not yet reached full maturity, but recent advances in technology, especially genetic and imaging tools, have allowed for great strides to be made in the past few years. Pertinent to the primary research in this study, one area largely ignored but now starting to become a topic of interest is amino acid transmitter release from first order feeding neurons. To understand the complex picture of where the knowledge gaps currently lie, where the primary research in this study fits, and where the field should be going next requires background detailing obesity and
hypothalamic control of energy homeostasis, including the current prevailing paradigms and the biological players within them. The purpose of this introductory chapter is to provide this
1.1 Obesity
Weighing too much is a problem individuals are battling worldwide. Obesity is now considered a chronic disease or metabolic syndrome and is defined by excess body fat and is accompanied by various comorbidities. The quantifiable measure for estimating the weight health of a person is by utilizing the body mass index (BMI = weight in kilograms divided by the square of height in meters [kg/m2]). For adults a BMI of 18.5 to 24.9 is considered normal. BMI
greater than 25 is considered as overweight, and a BMI larger than 30 and 40 indicate obesity and morbid obesity respectively (WHO, 2000). While BMI may occasionally be a poor measure of individual health (e.g. body builders or professional athletes), it is a good indicator of
overweight on a population level. Although obesity may be plateauing in the United States, the obesity epidemic remains a public health crisis, with over 1/3 of adults and 16.9% of children being classified as obese in a 2011-2012 survey (Ogden et al., 2014). Worldwide, studies find that the prevalence and severity of obesity is increasing rapidly in children, adolescents, and adults (Wang and Lobstein, 2006; Chan and Woo, 2010).
It is known that obesity is associated with a number of chronic diseases spread across both adults and children including type 2 diabetes, hypertension, dyslipidemia, disturbed glucose tolerance, and some forms of cancer (Kelly et al., 2008; I'Allemand et al., 2008; Mauras et al., 2010). Perhaps unsurprisingly, this leads to a connection between obesity and a shortened lifespan (Biro and Wien, 2010). While inexpensive and seemingly simple life changes early on could prevent negative health outcomes, living with chronic obesity drives significant health care costs in order to treat the disease, its comorbidities, and prevent mortality (Ebbeling et al., 2002; Yach et al., 2006; John, 2010; Muller-Riemenschneider et al., 2008; Finkelstein et al., 2009). Knowing exactly what causes obesity and finding as many appropriate treatments as possible
would obviously be a boon to humanity worldwide, reducing suffering and excess spending. A frantic race in the scientific community is now underway to unravel the mechanisms involved and build potential therapeutic strategies, spurred on by the urge to understand the fundamental determinants of obesity and obesity-related disease.
So what is known about feeding circuitry, the disruption thereof, and how the body controls the homeostatic set point? Whereas some genetic loci have been clearly identified, and extensively studied as monogenic causes for obesity, it is widely accepted that the metabolic syndrome is in essence a multifaceted disease that encircles a complex network of molecular, cellular and physiologic alterations (Kopelman and Hitman, 1998; Kahn and Flier, 2000). Ultimately, the brain must coordinate the activity of peripheral tissue to insure the fate of some nutrients once ingested. The brainstem works at a basic and essential level to provide satiety behaviors (Grill and Norgren, 1978; DiRocco and Grill, 1979), but without a complete neural network, challenges to homeostasis cannot be countered by adjustments in physiology (Seeley et al., 1994; see Grill and Kaplan, 2001 for review). It is understood that the hypothalamus is where the core of much of this complex modulatory activity occurs, but it is conceptually easier to start with food actually entering the body and taking it from there. The following sections will start at the periphery and head into the central nervous system.
1.2 Endocrine and peripheral input into the central nervous system
Much of the regulation of food consumption in the short term is driven by gastrointestinal peptides that are released directly after food is consumed (see Havel, 2001). These hormones will travel through the blood and directly or indirectly (through the vagus nerve up the general
of the brainstem known for forming circuits that contribute to autonomic regulation (see Holzer and Farzi, 2014; Svendsen and Holst, 2015). The NTS can be considered one of the major satiety centers in the CNS, collating and making sense of the peripheral signals coming from the
stomach, liver, and both small and large intestines to regulate satiety. Through the interaction with the NTS, as well as direct interaction with neurons in the arcuate nucleus of the
hypothalamus (ARC), these hormones, with the exception of ghrelin, induce satiety and cessation of food intake. Examples include cholecystokinin (CCK) from the duodenum and jejunum, glucagon-like peptide-1 (GLP-1) from the ileum and colon, gastrin-releasing peptide (GRP) from the stomach, and peptide YY (PYY) from the ileum and colon. The mechanisms by which CCK promotes satiety are through delaying gastric emptying and activating the vagal afferent nerves that innervate the NTS (Schwartz et al., 1999). GLP-1 functions in many ways, including acting as an insulin secretagogue, slowing gastric emptying and forcing food to stay in the stomach for longer periods of time, and binding to receptors on afferent nerves in the liver and GI tract, thereby relaying satiety signals to the NTS (Moran, 2009). GRP promotes satiety mostly through delaying gastric emptying (Merali ey al., 1999). PYY is released in response to a meal and reduces appetite by slowing gastric emptying (Moran, 2009). In contrast to the satiety-inducing (anorexigenic) actions of many gut hormones associated with the regulation of food intake, ghrelin is an octanoylated orexigenic peptide that is produced by the stomach, and to a lesser extent, the intestine and arguably the hypothalamus (Kojima et al., 1999; Havel, 2001). Plasma concentrations of ghrelin peak immediately before a meal and drop off quickly after a meal has been consumed (Cummings et al., 2001), acting on the G-protein coupled ghrelin receptors within the CNS to exert its metabolic effects (Guan et al., 1997; Mitchell et al., 2001; Zigman et al., 2006). In addition to the gastrointestinal peptides, mechanoreceptors in the
stomach and small intestines play a role in the short-term regulation of food intake. These receptors respond to the presence of food in the stomach and small intestines by transmitting signals via the vagal afferents to the hindbrain to initiate meal termination (Page et al., 2002; Carmagnola et al., 2005). Most of these gut signals are thought to act in the short term, while two other feeding-related hormones, insulin and leptin, are seen as longer-term players.
Whereas the short-term satiety signals often act upon the NTS in the brainstem, other circulating factors primarily interact with the various nuclei of the hypothalamus, including the ARC, paraventricular (PVN), ventromedial (VMH), and lateral (LH) nuclei (see Myers et al., 2008). One such factor is the adipogenic hormone, leptin. The idea of a signal from fat
interacting with feeding centers in the hypothalamus goes back over half a century with Kennedy and what became to be known as the lipostatic hypothesis (Kennedy, 1953). It took until 1994, when the leptin gene was first cloned, to find Kennedy’s adipogenic signal (Zhang et al., 1994). Leptin is produced by white adipose tissue, and plasma levels of leptin increase when the body has a surplus of energy available, especially when adipose tissue increases (Halaas et al., 1995; Friedman, 2009). One of the key signaling mechanisms driving the neuroendocrine, metabolic, and behavioral adaptations that promote a decrease in energy expenditure and increase food intake is a fasting-induced decrease in leptin (Ahima et al., 1996; see Myers et al., 2008). The importance of leptin in maintaining energy balance over the long term is highlighted by studies showing that leptin deficiencies or defects in the leptin receptors in the brain can cause
hyperphagia and severe obesity (Montague et al., 1997; Clement et al., 1998; Strobel et al., 1998). Leptin-responsive neurons express the long-form of leptin receptor (LepRb), which is a single-trans-membrane-domain protein of the cytokine receptor family that operates through the JAK-STAT signaling cascade. This specific receptor variant is required for leptin's central
effects and is highly expressed within several CNS sites, including hypothalamic nuclei (Elmquist et al., 1998, 2005; Scott et al., 2009). One interesting aspect of leptin is its opposing role to ghrelin. Many of the same areas of the brain contain receptors for both hormones, leading naturally to a push/pull hypothesis because of the overlap (see Nogueiras et al., 2008). However, both receptors have quite distinct profiles within the CNS, and deletion of the ghrelin receptor does not affect leptin sensitivity, casting doubt on a simple relationship (Perello et al., 2012).
Insulin is another major player in energy homeostasis, but its role in the CNS is not as understood as in the periphery. Insulin is secreted from the beta cells of the pancreas in response to the ingestion of food, which promotes the absorption of glucose from blood to skeletal
muscles and adipose tissue, causes fat to be stored rather than used for energy, and inhibits gluconeogenesis (Sonksen and Sonksen, 2000). Although insulin clearly has satiating effects in the CNS (Woods et al., 1979; Hallschmid et al., 2004; Brown et al., 2006), the physiological significance of these actions remains uncertain. For example, injecting an antisense
oligonucleotide into the third ventricle in order to curtail insulin receptor expression in hypothalamic nuclei caused immediate and significant hyperphagia (Obici et al., 2002), but neural insulin receptor knockout strategies have found little to no phenotype in mice (Brüning et al., 2000; Choudhury et al., 2005). With a base of information on the link between peripheral signals and the CNS covered, this is an appropriate place to transition completely into the CNS, specifically regarding the hypothalamus and surrounding feeding circuitry.
1.3 Hypothalamic regulation of energy balance
Implication of the hypothalamus in feeding and energy balance goes as far back as 1840, when hypothalamic obesity was described by Mohr (1840). He noticed that a woman had
become obese within a year before her death, and upon autopsy of this woman, Mohr found a hypophysial tumor compressing and distorting the base of the brain. There was no attempt to connect the increase in adiposity to a hypophysial or hypothalamic injury, but this report and clinicians making other reports like it set the stage for new understanding of this brain region. Over decades, a controversy developed between those that thought pituitary dysfunction
(Fröhlich, 1901) and those that thought purely neural dysfunction (Erdheim, 1904) was to blame for hyperphagia and increased adiposity in these case studies, and it was not until 1930 that enough empirical evidence was amassed to end the controversy for good (see Aschner, 1912; Smith, 1930 for best examples). Soon after the Horsley-Clarke stereotaxic instrument was adapted for rats in 1939, relatively more refined electrolytic lesion studies were performed to provide the first undeniable evidence that the hypothalamus is the central hub for feeding (Hetherington and Ranson, 1940, 1942). Lesions to the base of the hypothalamus produced such hyperphagia that rats recovering from the surgery were observed to begin eating voraciously even before the anesthesia had worn off, to the extent of dying from asphyxiation because their swallowing reflex had not yet returned (Brobeck et al., 1943). Later, somewhat more
sophisticated, lesion studies would define specific areas of the hypothalamus, especially the ARC, as being responsible for feeding and energy balance (Nemeroff et al., 1978; Penicaud et al., 1983; Sims and Lorden, 1986).
Referring to the peptide hormones discussed in the latter portion of 1.2, ghrelin, leptin, and insulin, what makes the hypothalamus, and specifically the ARC, such an exquisite target for their actions? What makes this area specialized to its job is suggested by the unique anatomy within the region. The ARC is located in the ventral portion of the brain, at the bottom of the third ventricle, directly next to the median eminence (ME), which is one of the circumventricular
organs (CVO). The “leaky” blood-brain barrier at CVOs allows for selective exchange of
substrates between in the blood and cerebrospinal fluid, eventually allowing contact to the neural tissue in the ARC. Regulation of food intake and energy homeostasis depends on the ability for hormones from the periphery to effect change directly at neurons charged with that task. These neurons, termed “first order” feeding neurons integrate signals circulating through the blood and encode energy signals into synaptic transmission that will affect downstream secondary neurons. Unsurprisingly, these downstream neurons have earned the moniker of “second-order” feeding neurons. Tanycytes, from the Greek word tanus, which means elongated, are the specialized hypothalamic glial cells that act as gatekeepers of the blood-brain barrier and allow for exchange across it (Gao et al., 2014). Tanycytes extend from the ependymal surface (thus making them a specialized type of ependymal cell) of the third ventricle to a bed of permeable fenestrated capillaries (Langlet et al., 2013). Energy state-signaling hormones, such as ghrelin and leptin, are able to quickly pass through and relay their relevant actions (Schaeffer et al., 2013; Balland et al., 2014). These features ultimately define why first order feeding neurons are so poised to rapidly adapt, making electrophysiological changes is response to hunger or satiety signals, and continue carrying out their functions.
First order feeding neurons: POMC cells and NPY/AgRP cells
The ARC contains (at least) two major populations of neurons that are crucial for monitoring energy signals and subsequently pushing for the suitable behavioral and metabolic responses to alterations of energy state (see Figure 1.1 for relative location in the brain). The first group of neurons is proopiomelanocortin (POMC) neurons, understood to promote satiety and named after the propeptide these cells produce and utilize (Xu et al., 2011; Myers and Olson,
2012). POMC is cleaved by processing enzymes in a tissue-specific manner, resulting in a handful of bioactive peptides. Outside of the ARC, in the corticotrophs located in the anterior pituitary, POMC is translated and cleaved to make adrenocorticotropic hormone (ACTH), which is released into the blood where it regulates stress hormone production and release from adrenal glands (Wardlaw, 2011). Relevant to feeding, in the mouse ARC, POMC is expressed in a fairly evenly spread group of a few thousand neurons (Cowley, 2001; Jarvie, 2012), where it is
processed into α- and γ-melanocyte stimulating hormone (α-MSH and γ-MSH) and the opioid β-endorphin (Wardlaw, 2011). α-MSH, γ-MSH, and ACTH are all referred to as melanocortins because they agonize melanocortin receptors. All five melanocortin receptors are G-protein coupled receptors (GPCRs). The MC3R and MC4R are the receptors located in the CNS (Cone, 2005; Kim et al., 2014), while the other three carry out quite unrelated activities, such as skin pigmentation and exocrine gland function. The discovery that injection of melanocortins into the CNS inhibited both spontaneous and drug-induced feeding in rats suggested that POMC neurons might be able to sense and respond to indicators of feeding state (Poggioli et al., 1986). Although most of the peptides POMC cells release have an impact on feeding, effects on the suppression of food intake have been primarily attributed to α-MSH signaling (Brown et al., 1998; Thiele et al., 1998). Injections of α-MSH, as well as the α-MSH synthetic analogue melanotan-II (MTII), into the ventricles caused a highly significant decrease in food consumption (Thiele et al., 1998). MTII injection into the PVN also produces reduction in eating, which is prevented by
coadministering an AgRP analogue (Fan et al., 1997).
The second ARC population of first order neurons which are essential for regulation of feeding are the neurons that make neuropeptide Y (NPY) and Agouti-related protein (AgRP) (from here on referred to as NPY/AgRP neurons). NPY was initially discovered in 1982
(Tatemoto et al., 1982), but it wasn’t until a couple years later that one of its functions was characterized as an orexigenic peptide (Clark et al., 1984). NPY agonizes a set of G-protein coupled NPY receptors (Linder et al., 2008). Infusion of NPY into the cerebral ventricles also causes an increase in eating (Clark et al., 1984; Levine and Morley, 1984; Stanley et al., 1985). Targeted infusion of NPY into subregions of the hypothalamus revealed the PVN, VMH, and LH as key areas involved in NPY-regulated eating (Stanley et al., 1985). AgRP was discovered as an
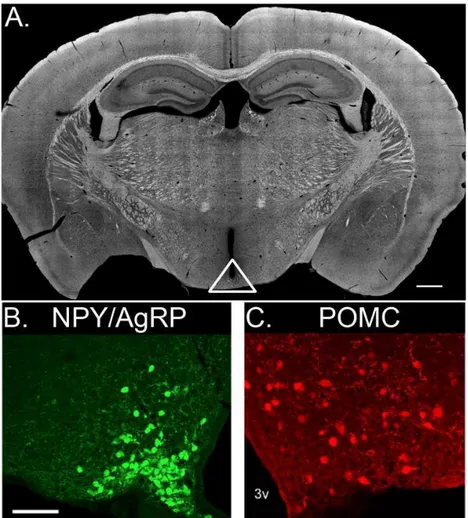
Figure 1.1. Opposing first order feeding neuron populations are located in the arcuate nucleus of the hypothalamus. (A) Coronal section of an adult mouse brain containing the ARC. White triangle encompasses arcuate nuclei and ME. NPY/AgRP cells are densely packed near the ME, visualized using an NPY-hrGFP animal and presented as a confocal Z-stack (B). POMC cells are relatively more spread through the ARC and slightly larger than NPY/AgRP cells, visualized using a POMC-DsRed animal (C). 3v, third ventricle. Scale bar for (A) is 500 µm, while scale bar for (B) is 100 µm.
inverse agonist for the melanocortin receptors (Ollmann et al., 1997; Shutter et al., 1997), which led to the colocalization of the two peptides (Hahn et al., 1998).
Previous work with the agouti gene (different than the AgRP gene) actually led to the hypothesis of opposing feeding neuron populations harnessing the melanocortin system. The agouti gene was cloned in 1992 (Bultman et al., 1992) and was the first obesity gene to be characterized at the molecular level. Hair follicles express agouti, where it leads to the production of yellow and red pigments and inhibits the production of black pigments in melanocytes. The mechanism through which agouti acts on melanocytes is by antagonizing MC1Rs. The lethal yellow (Ay) mutation is one of five known agouti mutations that leads to ectopic agouti expression (Michaud et al., 1994). Heterozygotes (homozygous expression of this spontaneous mutation is lethal), in addition to their yellow hair color, develop obesity within the first few months of life. This is because ectopic expression of agouti in the hypothalamus
functionally outcompetes α-MSH at MC3 and MC4Rs.
Like the effect of constitutively expressed agouti, infusion of AgRP into ventricles causes increases in food intake, which is prevented with simultaneous injection of melanocortin agonists (Hagan et al., 2000). NPY/AgRP cells not only release peptide neurotransmitters, they also release the amino acid transmitter γ-aminobutyric acid (GABA), providing NPY/AgRP neurons with another inhibitory mode of action (Horvath et al., 1997). Recent counts put the number of these neurons at about 10,000 in the mouse brain (Betley et al., 2013).
Satiety and POMC vs. hunger and NPY/AgRP: paradigm of opposition
The classical paradigm for opposing first order feeding neurons continues as the standard model with the decades’ worth of literature behind it. Collectively, POMC and NPY/AgRP
neurons, their projecting fibers, target neurons expressing MC3R or MC4R, and a second small group of POMC-expressing neurons in the brain stem, define the neural melanocortin system (Mountjoy et al., 1994; Zhan et al., 2013). Through a combination of pharmacology experiments, electrophysiology, and knockout mouse models, a model of energy homeostasis was formed (Figure 1.2). Early hypotheses stated that two battling peptides, α-MSH and AgRP, act on the MC3 and MC4 melanocortin receptors throughout the brain to directly regulate food intake and energy balance. α-MSH-induced activation of melanocortin receptors decreases food intake and increases energy expenditure, and AgRP antagonizes these effects (Fan et al., 1997; Hagan et al., 2000). This idea is consistent with the finding that POMC and NPY/AgRP cells share common second order targets in the CNS that are located in the PVN, LH, VMH, and dorsomedial (DMH) nuclei of the hypothalamus, as well as extrahypothalamic regions like the NTS and parabrachial nucleus (PBN) (Bagnol et al., 1999; Wang et al., 2015). POMC-KO and MC4R-KO mice are hyperphagic and obese, and MC3R-KO mice have increased fat mass (Huszar et al., 1997; Yaswen et al., 1999; Butler et al., 2000). AgRP-KO mice have no metabolic phenotype (Qian et al., 2002), however, acute ablation of NPY/AgRP neurons in adulthood using targeted diphtheria toxin receptor causes starvation (Wu et al., 2008). This evidence of the importance of peptide transmitters was used to build and sustain the basic opposing force model.
Circulating hormones directly and indirectly modulate the two pools of first order feeding neurons. A lot of study has been devoted to leptin, which activates POMC neurons and increases transcription of POMC mRNA levels, at the same time inhibiting NPY/AgRP neurons and decreasing AgRP mRNA levels through direct activation of LepRb, which is expressed on both cell types (Schwartz et al., 1997; Mizuno and Mobbs, 1999; Elias et al., 1999; Lam et al., 2015). Electrophysiologically, there is some evidence, although not yet completely convincing, that
Figure 1.2. Classical paradigm of opposing first order feeding neurons. Circulating energy signals reach the median eminence where they are able to cross the weak blood-brain barrier (BBB). POMC and NPY/AgRP cells are excited or inhibited by these signals, which alters the balance between the populations of neurons and allows for appropriate autonomic and behavioral food intake and energy expenditure actions to occur. POMC neurons activate downstream 2nd order feeding neurons by releasing α-MSH onto melanocortin 4 receptors (MC4Rs). NPY/AgRP neurons fight this activation by releasing the MC4R antagonist AgRP, in addition to releasing NPY onto the inhibitory NPY type 1 receptors (Y1Rs). NPY/AgRP cells directly inhibit POMC cells through activation of Y1Rs and putative GABA release onto GABAA receptors, while POMC cells directly inhibit NPY/AgRP cells through putative activation of melanocortin 3 receptors (MC3Rs).
leptin signaling depolarizes POMC neurons via activation of TRPC channels (Qiu et al., 2010), whereas NPY/AgRP neurons are hyperpolarized by activation of the Kv2.1 potassium channel (Baver et al., 2014). Because POMC cells are innervated by NPY/AgRP neurons (Atasoy et al., 2012), leptin is also able to depolarize POMC neurons through reduction of inhibitory tone from AgRP NPY, as well as GABA, release (Cowley et al., 2001). Even though leptin inhibits
NPY/AgRP neuron activity, it is actually required during early life development in order to properly wire. Mice genetically deficient of leptin (ob/ob) or its receptor (db/db) display abnormal projections to the PVN (Bouret et al., 2004; 2012) from ARC feeding neurons,
pointing to a role as a trophic factor in neonates. Ghrelin also acts directly on first order neurons. It was shown to directly increase the firing rate of NPY/AgRP neurons, as well as indirectly inhibit POMC neurons by increasing inhibitory tone from NPY/AgRP cells onto POMC cells (Cowley et al., 2003). The ghrelin receptor is a Gα11/Gq11-coupled GPCR that activates
phospholipase C (PLC). PLC increases the intracellular Ca2+ levels through inositol-3-phosphate
(IP3) and protein kinase C pathways (van der Lely et al., 2004; Ferrini et al., 2009). In addition to
these peptides, POMC and AgRP neurons are now known to also respond to estrogen, glucose and fatty acids in an opposing manner (Ibrahim et al., 2003; Chang et al., 2005; Titolo et al., 2006; Jo et al., 2009; de Souza et al., 2011; Koch and Horvath, 2014).
Using the Cre-lox system with POMC- and NPY/AgRP-Cre animals continues to be a popular method to find out how these two populations of neurons function and interact. However, careful attention must be paid not to overstate results when using these strategies, especially in light of recent findings that POMC is transiently expressed during development in cells fated to become NPY/AgRP or Kisspeptin neurons (Padilla et al., 2010; Sanz et al., 2015). Any meaningful amount of Cre being expressed in unintended neurons will cause permanent
recombination of floxed sites. For examples of work that may warrant alternative interpretation, see Balthasar et al., 2004 and Xu et al., 2008. Some of the most convincing evidence for the basic idea of first order feeding neuron opposition comes from the development of optogenetic tools. Through expression of the light-gated nonselective cation channel, channelrhodopsin-2 (ChR2), it is possible to selectively activate molecularly marked neurons using a specific
wavelength of light (Boyden et al., 2005; Arenkiel et al., 2007). Optogenetic stimulation of even a minority of NPY/AgRP cell bodies in vivo rapidly elicits an insatiable appetite and food consumption in mice, even if they have recently eaten a meal (Aponte et al., 2011). This effect scales with frequency of light stimulation. Conversely, light stimulation of POMC neurons decreases food intake and body weight, although a longer period of stimulation is needed to observe significant effects (Aponte et al., 2011). This difference between neuron types might be attributable to the timescales in which different neurotransmitters act. Interestingly, when Ay mice that are constitutively producing agouti protein, which binds melanocortin receptors and prevents changes in the natural melanocortin system to have any effect, are used, NPY/AgRP stimulation still causes feeding behavior and weight gain, while POMC cell stimulation has no effect on feeding (Aponte et al., 2011). This implies that, at least in that paradigm, melanocortin signaling is much more important for POMC cells than for NPY/AgRP cells, which could be relying on the fast actions of their amino acid transmitter, GABA. This is just one caveat to the simple idea of opposing actions of first order feeding neurons specifically at melanocortin receptors. More new findings and ideas are covered next.
Wrinkles in the classical paradigm
While the dueling melanocortin idea of feeding is still established and accepted, the field is rapidly growing beyond a simple model (for excellent contemporary reviews, see Mountjoy, 2015; Sternson and Atasoy, 2014). Advances in imaging and recording approaches have allowed for the development of in vivo calcium imaging. In line with ex vivo brain slice recordings, NPY/AgRP neurons are active during the fasted state and also respond with elevated calcium events to injections of ghrelin. The surprising and more novel finding, however, is that POMC and AgRP neurons respond rapidly to sensory food cues even before ingestion, and the response varies with nutritional state and depends on the palatability of the food presented (Betley et al., 2015; Chen et al., 2015); the fast response is caused by detection, not consumption. Thus, in addition to long-term integration of nutritional signals and maintenance of energy balance, the melanocortin system is poised to be dynamically regulated by sensory stimuli and may be directly involved in food-seeking behavior.
One conceptually simple finding to keep in mind is that POMC and AgRP neurons often, but not always, project to the same nuclei. This suggests that some areas of the brain utilize independent branches of the first order feeding neuron populations, implicating a possible role for each peptide independent of the other (Wang et al., 2015). It could be possible that there is constitutive activity of the melanocortin receptors in some brain regions, and there is some evidence to suggest that AgRP could act alone on a receptor as an inverse agonist rather than just a competitively binding antagonist (Tao, 2014). One hint at an alternate hypothesis lies with recent investigation into the signaling cascade downstream from the MC4R. Although α-MSH and opposing AgRP action on MC4Rs is transduced though a Gs-coupled pathway (Nickolls et
AgRP acts in a second, Gs-independent manner on the MC4R. Specifically, that there is
coupling of the MC4R to the inward-rectifying potassium channel Kir 7.1 (Ghamari-Langroudi et al., 2015).
As previously discussed, AgRP-KO mice have no metabolic phenotype, while ablation of NPY/AgRP neurons in an adult results in starvation (Wu et al., 2008). This suggests
developmental compensation, but in what manner? Further study revealed that the starvation was melanocortin-independent, and that proper hunger signaling and was mediated at least in part by the amino acid transmitter GABA (Wu et al., 2008; 2009; 2012). In addition, two methods of targeted neural activation (cell-type-specific light- or chemical-mediated activation) show that excitation of AGRP neurons leads to immediate and voracious feeding, also independent of melanocortin signaling (Krashes et al., 2011; 2013). Through additional experiments, it was determined that NPY and GABA released by NPY/AgRP neurons both play a significant role in the short-term feeding behavior, whereas AgRP might be more responsible for feeding on a longer time scale (Krashes et al., 2013).
POMC neurotransmitter release is not restricted to peptides; before beginning the primary research in this study, our lab had previously discovered that POMC cells release both GABA and glutamate in autaptic cultures (Hentges et al., 2009), although it was unknown if that
phenotype held in intact circuitry or what physiological relevance amino acid transmitter release might hold. Further discussion will be found in later chapters, but to summarize, very little is known about the relevance of POMC amino acid transmitters. There is a small amount of evidence that there are two classes of POMC cell neurotransmitter release sites—one that
releases a combination of neurotransmitters and peptides at conventional synapses, and the other being extrasynaptic sites that only release peptides (Atasoy et al., 2014). Clearly, the recent
findings described point toward a more complex feeding and energy homeostasis model that must account for separate mechanisms on separate timescales, redundancy, developmental adaptation, and importance of amino acid transmitters.
Beyond first order neurons
Where do POMC and NPY/AgRP neurons exert their largest effects? One way to answer this is to know in what brain regions melanocortin receptors are most necessary for proper feeding and energy balance. A group using the Mc4rloxTB/loxTB mouse line, a global MC4R knockout that will re-express MC4R if Cre is introduced, along with a Sim1-Cre line, MC4Rs were only expressed in the amygdala, nucleus of the lateral olfactory tract, DMH, and LH (Balthasar et al., 2005). This selective expression drastically diminished the increased body weight phenotype observed in the Mc4rloxTB/loxTB mouse model, but it was not a complete rescue, suggesting at least some relevant melanocortin activity outside of these brain regions. Further targeting of the PVN with a selective knockout Mc4rlox/lox mouse line, in conjunction with the use of the previous selective rescue line and some elegant use of Cre-expressing viral injections, showed that melanocortin activity specifically in the PVN is both necessary and sufficient for the majority of a proper weight phenotype (Shah et al., 2014). This study did a great job in
essentially using a brute-force strategy to determine the relevance of other types of neurons to the melanocortin system. Loss or rescue of MC4Rs in glutamatergic neurons using the vGLUT2 glutamate transporter accounted for a complete loss or rescue of a weight phenotype, whereas re-expression in oxytocin, corticotropin-releasing hormone, arginine vasopressin, or prodynorphin neurons (all expressed within the PVN) had no measured effect. Interestingly, although the PBN is part of a known feeding pathway (Carter et al., 2013), regaining any expression of MC4Rs in
the PBN results in no change in phenotype, suggesting that a melanocortin-dependent role of function is lacking in the region, that GABA release is the relevant first order transmitter released in the pathway, and/or that the pathway is not relevant to feeding outside extreme physiological states e.g. being poisoned or very sick.
The PBN is actually a heavily researched area at this time, as a second group of neurons more lateral to those studied in Carter et al., 2013 is generating interest for being a major efferent target for the effects of MC4R-expressing PVN neurons. ChR2-mediated stimulation of
terminals of MC4R-expressing PVN neurons located in the lateral PBN caused the same
reduction in feeding behavior as activation at the soma level (Garfield et al., 2015). Although the pathway flowing through the glutamatergic PVN neurons is currently being heavily mined for information, there are other groups of relevant second order neurons that are innervated by both POMC and NPY/AgRP cells. However, results between groups have been mixed. Terminal field photostimulation of ChR2-expressing NPY-AgRP neurons in the anterior bed nucleus of the stria terminalis (aBNST) and LH promotes acute food consumption to comparable levels as that observed following NPY/AgRP soma activation (Atasoy et al., 2012; Betley et al., 2013;
Sternson lab), but patch clamp recordings of MC4R-expressing cells in those regions while doing the same photostimulation of NPY/AgRP cells found no evidence for monosynaptic inhibitory connections (Garfield et al., 2015; Lowell lab). These pathways need further clarification. It may be that there is a complex system of interneurons between NPY/AgRP cells and their LH targets, or that the orexigenic nucleus in the LH is mostly under the control of POMC cells, but further work is needed to address these and other possibilities.
1.4 General hypotheses and aims of the study
With obesity being such a significant problem in Western society, there is an obvious need to more fully understand the homeostatic systems within the hypothalamus that drive feeding and energy balance. In reviewing some of the most important feeding literature currently published, context has been given for the primary research in this study. To summarize the ideas and concepts most relevant to the following chapters, NPY/AgRP and POMC neurons located in the ARC have been studied extensively for their opposing regulation of energy homeostasis. NPY/AgRP neurons express increased markers of activation, such as FOS during a fasted or hungry state (Wu et al., 2014). Conversely, POMC neurons show greater markers of FOS during a sated rather than a fasted state (Wu et al., 2014). The responsiveness of these cell types to changes in feeding state clearly points to their role as important players in feeding and energy balance circuits. Because of their exquisite placement next to a CVO and their ability to detect energy state signals in the bloodstream, it is no surprise that these two groups of cells are thought to represent the primary initial node in the feeding model of the mammalian brain.
So far, the majority of study has examined the peptide transmitters that these first order feeding neurons release and are named for, which are clearly important for normal control of feeding and weight. However, only a small portion of obesity can be explained by perturbations or mutations in the first order feeding neuron peptide systems (van Vliet-Ostaptchouk et al., 2009). While these peptides are clearly important for proper maintenance of body weight, classical amino acid transmitters may also play a significant role in POMC cell physiology (van den Pol, 2003; Meister, 2007), and definitely play an important role in NPY/AgRP cells’ ability to modulate feeding behavior (Aponte et al., 2011; Wu et al., 2012; Krashes et al., 2013; Carter et al., 2013). GABA has been long known to affect feeding (Kelly et al., 1977; Tsujii and Bray,
1991), and the GABA receptor continues to be a potential target for eating disorder and obesity treatment (Guardia et al., 2011).
The first aim of this study is to test the hypothesis that both glutamate and GABA are released from POMC cell terminals, and that this release is relevant to the feeding circuit. Chapter 2 addresses release, and while there is still little evidence for relevance, new findings from our lab are discussed in Chapter 4.
The experiments in Chapter 3 test the hypothesis that GABA release from NPY/AgRP cells is regulated based on feeding state, focusing specifically on the non-reciprocated direct synaptic connection of NPY/AgRP cells to POMC cells. Additionally, through in situ
hybridization experiments, glutamate decarboxylase mRNA (Gad) level as a proxy for functional GABA release is discussed as a broadly applicable tool. The importance of inhibitory tone from NPY/AgRP neurons onto POMC neurons is discussed in Chapter 4. Both aims rely heavily on a combination of electrophysiology and optogenetic techniques to obtain pseudo-paired
2. REGULATION OF GABA AND GLUTAMATE RELEASE FROM
PROOPIOMELANOCORTIN NEURON TERMINALS IN INTACT HYPOTHALAMIC NETWORKS1
2.1 Summary
Hypothalamic proopiomelanocortin (POMC) neurons and their peptide products mediate important aspects of energy balance, analgesia, and reward. In addition to peptide products, there is evidence that POMC neurons can also express the amino acid transmitters GABA and
glutamate, suggesting these neurons may acutely inhibit or activate downstream neurons. However, the release of amino acid transmitters from POMC neurons has not been thoroughly investigated in an intact system. In the present study, the light-activated cation channel
channelrhodopsin-2 (ChR2) was used to selectively evoke transmitter release from POMC neurons. Whole-cell electrophysiologic recordings were made in brain slices taken from POMC-Cre transgenic mice that had been injected with a viral vector containing a floxed ChR2
sequence. Brief pulses of blue light depolarized POMC-ChR2 neurons and induced the release of GABA and glutamate onto unidentified neurons within the arcuate nucleus, as well as onto other POMC neurons. To determine if the release of GABA and glutamate from POMC terminals can be readily modulated, opioid and GABAB receptor agonists were applied. Agonists for mu and
kappa, but not delta, opioid receptors inhibited transmitter release from POMC neurons, as did the GABAB receptor agonist baclofen. This regulation indicates that opioids and GABA released
from POMC neurons may act at presynaptic receptors on POMC terminals in an autoregulatory
1 Full article from Dicken MS, Tooker RE, and Hentges ST. (2012) The Journal of Neuroscience, 32:4042-4048. Shane Hentges contributed to experimental design and writing of the manuscript. Ryan Tooker performed initial ChR2 experiments and edited the manuscript. Matthew Dicken performed the majority of the experiments, analyzed collected data, assisted in experimental design, and contributed in writing the manuscript.
manner to limit continued transmission. The results show that in addition to the relatively slow and long-lasting actions of peptides, POMC neurons can rapidly affect the activity of
downstream neurons via GABA and glutamate release.
2.2 Introduction
Hypothalamic proopiomelanocortin (POMC) neurons are thought to exert their effects on energy balance, motivation, pain and reward mainly through release of the mature POMC
cleavage products α-melanocyte-stimulating hormone (α-MSH) and β-endorphin (Coll, 2007; Bertolini et al. 2009; Hegadoren et al., 2009). While these peptides are clearly important for proper function, classical amino acid (AA) transmitters may also play a significant role in POMC cell physiology (van den Pol, 2003; Meister, 2007). Previous reports have shown both GABA and glutamate release from POMC cells that have formed recurrent synapses in primary culture (Hentges et al., 2004, 2009). In addition, electron micrograph data has shown that POMC terminals make both symmetric and asymmetric synapses, suggesting both GABAergic and glutamatergic POMC terminals, respectively (Wang et al., 2001; Reyes et al., 2006). However, glutamate release from POMC neurons in an intact circuit has not been demonstrated and some studies have failed to detect GABAergic markers in POMC neurons using immunohistochemical or transgenic approaches (Ovesjö et al., 2001; Vong et al., 2011). A complete understanding of how POMC neurons affect the larger circuitry and behavior requires knowing the amino acid phenotype of these neurons. Thus, the present study was designed to determine whether POMC neurons release GABA and/or glutamate to affect neuronal activity in intact hypothalamic networks.
To examine transmitter release from POMC neuron terminals in an intact system, a combined optogenetics-electrophysiology approach was used. This approach is similar to that proposed for circuit mapping and functional studies (Petreanu et al., 2007; Atasoy et al., 2008; Kohl et al., 2011). Cell type-specific expression of the light-gated ion channel channelrhodopsin-2 (ChRchannelrhodopsin-2) in POMC cells was used to excite POMC neurons as a population with light while recording from downstream neurons in slice preparations. With this method, amino acid (AA) transmitter release could be observed through native connections. The results show that both GABA and glutamate are released from POMC neurons onto downstream cells within the
arcuate nucleus (ARC), indicating not only the phenotype of AA transmitter release, but also that POMC cells can terminate within the ARC. In addition, evoked transmitter currents could be dynamically modulated through G-coupled protein receptor (GPCR) activation, suggesting physiological regulation of GABA and glutamate release from POMC neurons may be another regulatory component of the POMC neuron system.
2.3 Materials and Methods Animals
Male and female transgenic mice expressing Cre recombinase specifically in POMC cells (POMC-Cre) were used for all experiments. Transgenic animals were produced by standard techniques (see Xu et al., 2005) and backcrossed >12 generations onto the C57Bl/6 strain. Animals were 10-12-weeks-old when electrophysiological experiments were conducted. Mice were housed under controlled temperature (22-24°C) and a constant 12 hr light/dark cycle. Mice were fed standard rodent chow and tap water ad libitum. All experiments met United States
Public Health Service guidelines with the approval of the Colorado State University Institutional Animal Care and Use Committee.
Viral gene transfer in vivo
POMC-Cre transgenic mice (eight-weeks-old) were anesthetized with isoflurane and placed in a stereotaxic frame (Kopf Instruments). A viral vector containing a floxed sequence for ChR2 with an mCherry tag (AAV2/9.EF1.dflox.hChR2(H134R)–mCherry.WPRE.hGH;
obtained from the Penn Vector Core at the University of Pennsylvania School of Medicine, Philadelphia, Pennsylvania) was unilaterally injected into the ARC of POMC-Cre mice. For each animal, a 300 nl injection (3.52E+12 GC/ml) was made using a Hamilton syringe and the
following coordinates from bregma: X, -0.27 mm; Y, -1.35 mm; Z, -6.14 mm. After
microinjection, the wound was sutured and animals were left to recover for a minimum of 14, but no longer than 28 days before experiments to ensure a high level of ChR2 expression.
Immunofluorescence
18 days post-AAV injection, mice were anesthetized, perfused transcardially with 4% paraformaldehyde, and brains were removed and post-fixed as described previously (Hentges et al., 2009). Sagittal brain slices (50 µm) containing the ARC were prepared on a vibratome and were subsequently incubated in phosphate-buffered saline (PBS) with 3% normal goat serum and 0.3% Triton-X-100. The POMC peptide adrenocorticotropin (ACTH) was detected using a rabbit anti-ratACTH primary antibody (National Hormone and Peptide Program; 1:10,000, overnight at 4°C). Tissue was then washed in PBS and incubated with an Alexa Fluor 647-conjugated donkey anti-rabbit secondary antibody (Invitrogen; 1:400). ACTH-immunoreactivity was visualized
using a Zeiss-510-Meta laser-scanning confocal microscope based on the far-red fluor (633 nm excitation and 650 nm emission wavelengths) and ChR2-mCherry was visualized using 580 nm excitation and 600 nm emission filters. Colocalization of ACTH immunoreactivity and ChR2-mCherry expression was determined by counting the labeled cells in sections from 2 brains. Two investigators made independent counts of labeled cells in each brain to verify the results.
Electrophysiology
Sagittal brain slices containing the ARC were prepared as previously described (Pennock and Hentges, 2011). Whole-cell voltage clamp recordings were made at a temperature of 37°C with an internal recording solution containing the following (in mM): 57.5 KCl, 57.5 K-methyl sulfate, 20 NaCl, 1.5 MgCl2, 5 Hepes, 0.1 EGTA, 2 ATP, 0.5 GTP, 10 phosphocreatine, pH 7.3. Recording pipettes had a tip resistance of 1.5-2.2 MΩ when filled with internal solution. Slices were maintained in artificial cerebrospinal fluid (aCSF) containing the following (in mM): 126 NaCl, 2.5 KCl, 1.2 MgCl2, 2.4 CaCl2, 1.2 NaH2PO4, 21.4 NaHCO3, and 11.1 glucose (saturated
with 95% O2 and 5% CO2). Whole-cell recordings were conducted through the use of an
Axopatch 200B amplifier (Molecular Devices, Sunnyvale, CA) and data was collected using AxographX software (Axograph, Sydney, Australia) running on a Mac OS X operating system. POMC neurons expressing ChR2 were identified by the mCherry fluorophore expressed as a fusion protein on the channel. Cells were held at -60 mV for recording light-evoked postsynaptic currents (PSCs). When recording from unidentified cells within the ARC, the patched cells were within ~100 μm of POMC-ChR2 expressing cells. Cells were excluded if the access resistance increased significantly from the initial access (6.04 ± 1.17 MΩ for unidentified cells, 4.6 ± 0.75 MΩ for ChR2-expressing POMC neurons, and 4.9 ± 0.71 MΩ for POMC neurons without
ChR2). Postsynaptic currents were evoked using either a 25 or 100 ms blue light pulse delivered every 20 s to the slice from a mercury light source with a rapid shutter system (Lumen Pro 200, Prior). The light was adjusted to the minimum intensity required to evoke a consistent PSC, which was generally between 5-11 mW/mm2. PSCs were evoked for at least 5 min under
baseline conditions to ensure a steady recording. PSCs were collected at 10kHz and digitally filtered at 1kHz. Data were analyzed by comparing an average of 3 min of baseline to an average of 2 min of steady-state response to drug. Excitatory and inhibitory PSCs were identified
pharmacologically by blocking GABAA-mediated currents with bicuculline methiodide (BMI, 10
µM; Tocris) or AMPA- and NMDA-mediated currents with 6,7-dinitroquinoxaline-2,3(1H,4H) (DNQX, 10µM; Sigma) and (+)-MK-801 (15 µM;Sigma). Representative recordings were plotted by minute, averaging the peak amplitude of 3 sweeps spaced 20 seconds apart.
Drugs
Stock solutions of DNQX, (+)-MK-801, and
(+)-(5α,7α,8β)-N-methyl-N-[7-(1-pyrrolidinyl)-1-oxaspiro[4.5]dec-8-yl]-benzeneacetamide (U69593; Biomol International) were prepared with DMSO at least 10,000x more concentrated than the final solution. Stock solutions of [D-Ala2, N-Me-Phe4, Gly5-ol]-enkephalin (DAMGO; Sigma), D-Phe-Cys-Tyr-D-Trp-Arg-Thr-Pen-Thr-NH2 (CTAP; Tocris Bioscience), nor-binaltorphimine (nor-BNI; Sigma),
[D-Pen2,5]enkephalin (DPDPE; Bachem), bicuculline (Tocris Bioscience), [Met
5]enkephalin
(Sigma), baclofen (Sigma), dynorphin A (Tocris Bioscience), naloxone (Sigma), (2S)-3-[[(1S)-1-(3,4-Dichlorophenyl)ethyl]amino-2-hydroxypropyl](phenylmethyl)phosphinic acid (CGP 55845; Tocris Bioscience), and BMI were prepared with distilled water. All drugs were diluted to
working concentrations in aCSF and applied via bath perfusion except (+)-MK-801, which was applied to the collected slices prior to being moved to the recording chamber.
Data Analysis
All data are presented as mean ± SEM. Comparisons between groups were compared using t-tests. P < 0.05 was considered a significant difference.
2.4 Results
Functional expression of ChR2 in POMC cells
The selective expression of ChR2 in POMC neurons was verified in slices prepared from POMC-Cre mice that had been injected with the viral vector containing the floxed
ChR2-mCherry ≥2 weeks earlier. Approximately 88% of cells expressing ChR2-mCherry also displayed ACTH-immunoreactivity (ACTH-IR). Cells expressing mCherry without detectable ACTH-IR most likely represent POMC neurons with low ACTH expression. Injection of the viral vector into the ARC of wild-type C57Bl/6 mice yielded no detectable mCherry
fluorescence (data not shown), indicating that expression is limited to cells that express Cre recombinase. Approximately 79% of ACTH-IR cells in the injected side of the ARC expressed mCherry (Figure 2.1A). ChR2-mCherry was notable throughout the membranes of cell body and neuronal projections, indicating strong expression and widespread trafficking of the channel. These findings indicate specific targeting of strong ChR2 expression to POMC neurons.
Individual cells expressing high amounts of ChR2-mCherry were easily detected in live brain slices prepared from injected mice (Figure 2.1B). POMC cells with ChR2 had similar basal whole-cell properties as POMC neurons that do not express ChR2. The input resistance was
Figure 2.1. POMC cell-specific expression of functional ChR2. (A) Confocal z-stack image of a brain slice containing cells expressing ChR2-mCherry 18 days after AAV injection (left panel) and cells immunoreactive for ACTH (center panel). A high degree of colocalization can been seen in the merged image (right panel). (B) Images of the hypothalamus in a live brain slice from an AAV injected mouse shown in DIC (top panel) and fluorescence (bottom panel). Arrow indicates a neuron with a high level of ChR2 expression within the focal plane. (C) Whole cell currents from a ChR2-expressing neuron elicited by pulses of blue light at increasing intensities (0 at top trace; 28 mW/mm2 elicited the largest current, bottom-most trace). (D) Light-induced depolarization of a ChR2-expressing neuron caused action potential firing in current clamp recordings.
1.3 ± 0.1 GΩ in ChR2 positive cells versus 1.6 ± 0.2 GΩ in ChR2 negative POMC neurons (n = 9, p = 0.31). Whole-cell capacitance was also not different between ChR2 expressing and non-expressing POMC neurons (29 ± 2.6 pF and 25.5 ± 1.4 pF, respectively; n = 9, p = 0.24). Whole-cell voltage clamp recordings made in POMC-ChR2 neurons indicate that ChR2 mediates an inward current in response to blue light (~ 470 nm, Figure 2.1C). Peak and steady-state current responses were stereotypical of currents mediated by ChR2(H134R) (Lin et al., 2009). In current clamp, blue light depolarized POMC-ChR2 neurons and caused action potential firing (Figure 2.1D).
GABA and glutamate release from POMC neurons
Activation of POMC neurons via ChR2 was used to determine if POMC cells release the AA transmitters glutamate and/or GABA in an intact neuronal network. Whole-cell voltage clamp recordings were made in unidentified cells (not expressing detectable mCherry) in the ARC near POMC neurons. The unidentified cells had basal properties similar to POMC neurons (input resistance, 1.1 ± 0.15 GΩ, capacitance, 23.3 ± 1.54 pF; n = 15, p > 0.05 for both properties compared to POMC neurons with or without ChR2). The likelihood that a pulse of light evoked neurotransmitter release from POMC-ChR2 cells varied from 50% to 8.33% (e.g. 1 out of 12 cells patched) depending on the accuracy of the injection and thus, the number of ChR2-expressing neurons. When light pulses evoked transmitter release from POMC terminals, the currents in the postsynaptic cell were mediated by both GABAA and AMPA receptors, indicating
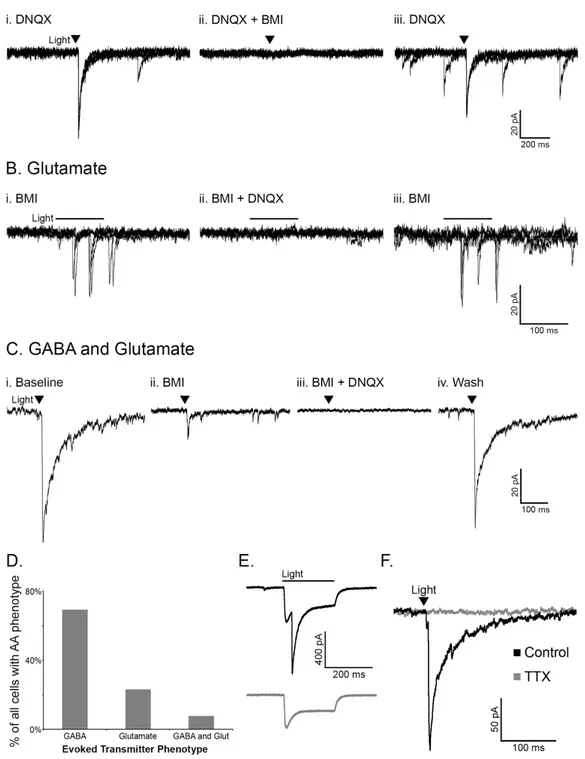
GABA and glutamate release from POMC neurons. Light-evoked inhibitory postsynaptic currents (IPSCs) were recorded in the presence of the AMPA receptor blocker DNQX (10 μM, Figure 2.2Ai) and were completely inhibited by the GABAA receptor antagonist BMI (10 μM,
Figure 2.2Aii). Upon washout of BMI, the current returned (Figure 2.2Aiii). Reversing the order of antagonist application showed the glutamatergic nature of some light-evoked currents.
Currents evoked in the presence of BMI (Figure 2.2Bi) were blocked by the addition of DNQX to the bath (Figure 2.2Bii) and returned upon washout of DNQX (Figure 2.2Biii). In the presence of BMI, the onset of evoked currents was often substantially delayed from the initial light
stimulus (as seen in Figure 2.2B), which may indicate a polysynaptic response. However, direct innervation was indicated in some instances, including where a brief light pulse evoked PSCs that were abolished only when both GABAA and AMPA receptors were blocked (Figure
2.2Ci-iv). Altogether, when a light-evoked PSC was detected in a non-POMC cell, it was most often GABAergic in nature (27/39 cells showed GABA-mediated PSCs, Figure 2.2D). Glutamate-mediated PSCs accounted for 23% of the PSCs observed (9/39 PSCs), and 3 cells appeared to receive input from both GABAergic and glutamatergic POMC cells (Figure 2.2D), although the possibility that individual terminals may release both GABA and glutamate cannot be ruled out based on the present experiments.
The majority of light-evoked PSC recordings were made in non-POMC neurons, since the direct inward current carried through ChR2 can obscure the current induced by GABA or glutamate release. However, some POMC cells expressing ChR2 displayed both a direct ChR2-mediated inward current and a slightly delayed light-evoked GABA-ChR2-mediated IPSC (n = 4, Figure 2.2E). This result indicates that POMC neurons can innervate one another.
All light-evoked currents in cells downstream of POMC neurons could be completely blocked by BMI and/or DNQX indicating that GABA and glutamate were the only transmitters being released in response to the acute depolarization of POMC neurons. The light-evoked release of transmitter from POMC neurons appears to be dependent on action potential
Figure 2.2. POMC neurons release GABA and glutamate onto cells within the arcuate nucleus. Light-evoked IPSCs observed in the presence of DNQX (10 μM, Ai) were abolished with the addition of BMI (10 μM, Aii). Light evoked EPSCs observed in the presence of BMI (Bi) were abolished with the addition of DNQX (Bii). (C) An example of a cell with light-evoked IPSCs and EPSCs. Upon washout of DNQX and/or BMI evoked currents returned (Aiii, Biii, Civ). Panels in A and B consist of three overlayed sweeps, whereas panels in C are each an average of three sweeps. The transmitter(s) mediating evoked currents was determined in all cases where a PSC was observed and is presented in (D). (E) A light-evoked IPSC in a POMC cell which also displays a direct ChR2 current (top trace). The evoked IPSC is ablated by BMI (bottom trace). (F) Currents evoked onto an unidentified cell are completely inhibited by treatment with TTX (1 µM).
propagation and not direct stimulation of terminal release based on the observation that the addition of tetrodotoxin (TTX, 1 µM) completely abolished light-evoked PSCs (98.68 ± 0.94% reduction, n = 4, p < 0.001; Figure 2.2F).
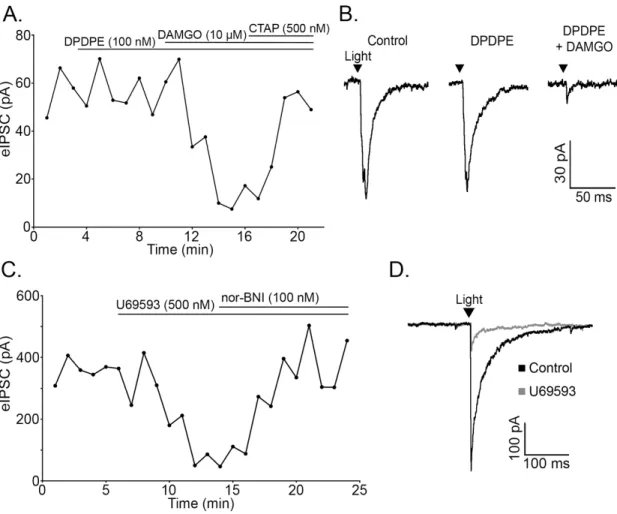
Opioids inhibit neurotransmitter release from POMC terminals via mu and kappa receptors The ability of opioid receptor agonists to modulate the release of GABA and glutamate from POMC terminals was evaluated, since opioids reliably inhibit AA transmitter release from unidentified terminals within the ARC (Emmerson and Miller, 1999; Pennock and Hentges, 2011). The mu (MOR) and delta opioid receptor (DOR) agonist ME (10 µM) caused a dramatic decrease in light-evoked IPSCs (72.46 ± 4.00% reduction, n = 9, p < 0.001; Figure 2.3A-B) and EPSCs (72.45 ± 4.64% reduction, n = 4, p < 0.001; Figure 2.3C-D). This reduction in current was readily reversed by washing out of drug (103.73 ± 10.03% of baseline, n = 5, p = 0.73; Figure 2.3C) or by co-applying the MOR-selective antagonist, CTAP (500 nM, 97.22 ± 9.42% of baseline, n = 8, p = 0.74; Figure 2.3A).
The DOR selective agonist DPDPE (100 nM) had no effect on PSC amplitude in any cell tested (100.12 ± 3.41% of baseline, n = 4, p = 0.49), whereas the MOR selective agonist
DAMGO (10 µM) reliably inhibited IPSC amplitude (72.70 ± 7.80% reduction, n = 4, p = 0.001; Figure 2.4A,B). The inhibition was reversed by CTAP (500 nM, 88.65 ± 5.95% of baseline, n = 4, p = 0.15; Figure 2.4A). Thus, mu but not delta receptor agonists can inhibit AA transmitter release from POMC neurons. Kappa opioid receptor (KOR) agonists inhibit IPSCs regulating POMC neurons (Pennock and Hentges, 2011). Although POMC neurons are not directly hyperpolarized by KOR activation (Pennock and Hentges, 2011), the possibility that POMC neurons express KORs presynaptically to inhibit transmitter release was examined. The KOR
selective agonist U69593 (500 nM) inhibited light-evoked IPSCs in unidentified downstream neurons (63.39 ± 8.33% reduction, n = 6, p < 0.001) and the KOR antagonist Nor-BNI (100 nM) reversed the inhibition (95.68 ± 8.57% of baseline, n = 6, p = 0.64; Figure 2.4C-D). Thus, KORs expressed in POMC neurons inhibit AA release from POMC neurons even though they do not mediate a detectable outward postsynaptic current in POMC neurons.
Figure 2.3. Light-evoked IPSCs and EPSCs are inhibited by opioid receptor activation. (A) Plot of light-evoked IPSC amplitudes over time shows an inhibition of light-evoked IPSCs by the nonspecific opioid agonist ME (10 μM). The IPSC inhibition is reversed by application of the MOR-selective antagonist, CTAP (500 nM). (B) Representative traces of IPSCs in control conditions and in the presence of ME. (C) ME inhibits light-evoked EPSC amplitude and EPSC amplitude returns to baseline upon washout of ME. (D) Representative traces of EPSCs in control conditions and in the presence of ME. The arrowheads in B and D indicate the timing of the light pulse.
GABAB receptor activation inhibits transmitter release from POMC cells
In addition to opioid receptors, GABAB receptors can inhibit transmitter release from
unidentified terminals in the ARC. To determine if GABAB receptors could modulate transmitter
release from POMC neuron terminals in particular, light-evoked release was monitored in the presence of the GABAB receptor agonist baclofen. Baclofen (30 µM) caused a significant
inhibition of light-evoked IPSCs in neurons downstream of POMC-ChR2 neurons (89.04 ± Figure 2.4. Mu and kappa opioid receptors mediate inhibition of evoked release from POMC terminals. (A) Plot of light-evoked IPSC amplitudes over time shows no effect of the DOR-selective agonist, DPDPE (100 nM) and inhibition of IPSC amplitude by the MOR-selective agonist, DAMGO (10 μM). The DAMGO-induced inhibition is reversed by application of the MOR-specific antagonist, CTAP (500 nM). (B) Representative traces taken during control and agonist treatment. (C) The specific KOR agonist U69593 (500 nM) inhibited evoked IPSC amplitude and was reversed by the addition of nor-BNI (100 nM). (D) Representative traces taken during control conditions and during U69593 treatment.
ablated the light-evoked IPSC. Baclofen-induced inhibition of the IPSC was fully reversed by washout or by co-applying the GABAB receptor antagonist CGP 55845 (1
µM, 92.44 ± 4.19% of baseline, n = 6, p = 0.13). This result indicates that POMC neurons express GABAB receptors, and
these receptors can inhibit presynaptic GABA release from POMC terminals.
2.5 Discussion
The results of the present study show that POMC neurons are not only peptidergic, but release the classical amino acid transmitters GABA and glutamate. Considerable release of these transmitters occurs within the ARC and can be modulated dynamically by agents such as opioids and GABA. Although GABAergic and glutamatergic phenotypes had previously been suggested for POMC neurons based on immunolabeling and studies of transmitter release from cultured POMC neurons (Hentges et al., 2004, 2009; Meister, 2007), the finding that GABA and
Figure 2.5. GABA-B receptor activation inhibits GABA release from POMC terminals. (A) Light-evoked IPSC amplitudes are inhibited by baclofen (30 μM). The inhibition is reversed by washout of drug. (B) Representative traces taken during control conditions and during baclofen treatment.