Faculty of Technology and Society Computer Science
Bachelor Thesis 15 Credits, Basic Level
Attention Guidance for Immersive Virtual
Environments
(Uppmärksamhetsledning för uppslukande virtuella miljöer)
Szilveszter Dezsi
Benjamin Sejdic
Degree: Bachelor of Science in Engineering Subject Area: Computer Science
Final seminar date: 2019-05-26
Examiner: Dario Salvi
Supervisor: Prof. Thomas Pederson
Abstract
The current push from the industry for Head-Mounted Display-based wearable computers to the masses for everyday use suggests that academia’s goals of a tight human and computer integration is achievable. Although promising, many interaction challenges remain to achieve a deep integration. Primarily that of active cognitive support in the form of focusing user attention. This thesis investigates to what degree a system can unobtrusively, perhaps even subliminally, guide attention of a user by directing their gaze from a current point to a selected point in a virtual environment. A subjective evaluation is made regarding the characteristics of visual sensory stimuli in order to possibly achieve an unobtrusive (or even subliminal) gaze guidance. The attention guidance system developed is deployed in a controlled experiment with 30 participants. Participants are asked to fire a longbow at targets in a virtual reality environment while their point of gaze is monitored with an eye-tracker. The experiment produced interesting results, but no conclusive evidence that the system was able actively guide a user’s attention nor influence their choice could be observed. The conclusion of this thesis is that further development is needed towards a system that is capable of objectively calibrating the stimuli characteristics for each individual participant.
Keywords: Virtual Reality, Attention Guidance, Gaze Guidance, Head-Mounted Display, Eye Tracking, Controlled Experiment
Acknowledgements
We would like to express our gratitude to Thomas Pederson for his guidance and feedback during our work on this thesis.
We would like to thank Diederick Niehorster, Marcus Nyström and Mattias Wallergård for giving us the opportunity to perform parts of this thesis at the Humanities Lab at Lund University, and for providing us with the facilities and crucial hardware needed to complete our work.
We would like to thank Magnus Krampell for all the support and encouragement during our three years of studies at Malmö University.
Finally, we would like to thank friends, family and loved ones for supporting and encour-aging us to finish this thesis.
Table of Contents
Abstract i
Acknowledgements ii
Abbreviations and Definitions vi
1 Introduction 1
1.1 Research Aim and Hypothesis . . . 2
1.2 Research Questions . . . 2
1.3 Scope and Limiting Factors . . . 2
2 Technology and Theory 3 2.1 Hardware and Software . . . 3
2.1.1 HTC Vive Head-Mounted Display . . . 4
2.1.2 Tobii VR Eye Tracking . . . 4
2.1.3 SteamVR Tracking System . . . 5
2.1.4 Unity Game Engine . . . 5
2.2 The Visual System . . . 6
2.2.1 The Human Eye . . . 6
2.2.2 Eye Movements . . . 7
2.2.3 Visual Perception . . . 7
2.2.4 Visual Attention . . . 7
2.3 Human-Computer Interaction . . . 8
2.3.1 Modelling Perception, Cognition and Action . . . 8
2.3.2 Explicit and Implicit Interaction . . . 9
2.3.3 Peripheral Interaction and Designing Active Cognitive Support . . . 10
3 Related Work 11 3.1 Subtle Gaze Guidance for Desktop Environments . . . 11
3.2 Subtle Gaze Guidance for Immersive Environments . . . 12
3.3 Comparison of Five Different Gaze Guidance Techniques in an Immersive Dome Environment . . . 13
3.4 Influence of Subliminal Cueing on Visual Search Tasks . . . 14
4 Methodology 15 4.1 System Development . . . 15
4.1.1 Conceptual Framework Construction . . . 15
4.1.2 System Architecture Development . . . 16
4.1.3 System Analysis and Design . . . 16
4.1.4 Prototype Construction . . . 17
4.1.5 Prototype Observation and Evaluation . . . 17
4.2 Controlled Experiment . . . 17
5 Results and Analysis 18 5.1 Attention Guidance System (AttentionCompass) . . . 18
5.1.2 Configuration . . . 19
5.1.3 Movement and Positioning . . . 20
5.1.4 Transparency (Alpha) . . . 21
5.1.5 Pulse Oscillator . . . 22
5.1.6 Eye-Tracker Integration . . . 23
5.1.7 Observation and Evaluation . . . 24
5.2 Controlled Experiment . . . 25 5.2.1 Experimental Task . . . 25 5.2.2 Participants . . . 27 5.2.3 Finite-State Machine . . . 28 5.2.4 Data Recording . . . 29 5.2.5 Data Visualization . . . 30
5.3 Analysis of the Experimental Data . . . 30
5.3.1 Quantification of Cued Target Hits . . . 31
5.3.2 Quantification of Cued Target Observations . . . 32
5.3.3 Quantification of Hit Intent . . . 33
6 Discussion 35 6.1 Attention Guidance System . . . 35
6.2 Controlled Experiment . . . 36 6.3 Threats to Validity . . . 37 6.4 Related Work . . . 38 6.5 Methodology . . . 39 6.6 Ethics . . . 39 7 Conclusion 40 7.1 Hypothesis and Research Questions . . . 40
7.2 Future Work . . . 41 References 42 A Experiment Charts 44 A.1 Experiment 1 . . . 44 A.2 Experiment 2 . . . 44 A.3 Experiment 3 . . . 44 A.4 Experiment 4 . . . 44 A.5 Experiment 5 . . . 45 A.6 Experiment 6 . . . 45 A.7 Experiment 7 . . . 45 A.8 Experiment 8 . . . 45 A.9 Experiment 9 . . . 46 A.10 Experiment 10 . . . 46 A.11 Experiment 11 . . . 46 A.12 Experiment 12 . . . 46 A.13 Experiment 13 . . . 47
A.17 Experiment 17 . . . 48 A.18 Experiment 18 . . . 48 A.19 Experiment 19 . . . 48 A.20 Experiment 20 . . . 48 A.21 Experiment 21 . . . 49 A.22 Experiment 22 . . . 49 A.23 Experiment 23 . . . 49 A.24 Experiment 24 . . . 49 A.25 Experiment 25 . . . 50 A.26 Experiment 26 . . . 50 A.27 Experiment 27 . . . 50 A.28 Experiment 28 . . . 50 A.29 Experiment 29 . . . 51 A.30 Experiment 30 . . . 51
B Experiment Consent Form 52 B.1 Experiment Consent Form . . . 52
Abbreviations and Definitions
XR: Extended Reality. Umbrella term for VR, AR, MR etc. [1]. VR: Virtual Reality. Fully computer-generated simulation of a realistic
experience that blocks out reality [1].
AR: Augmented Reality. Computer-generated content is added onto reality so both can be experienced together [1].
MR: Mixed Reality. Encompasses elements of both VR and AR [1]. HMD: Head-Mounted Display (headset) (see section 2.1.1).
HTC Vive: VR headset (HMD), hand controllers and base stations (see section 2.1.1). Tobii: VR eye-tracking technology (see section 2.1.2).
PCCP: Pupil Centre Corneal Reflection, used by Tobii (see section 2.1.2). SteamVR: Tracking system for HTC Vive VR hardware (see section 2.1.3). Unity: Unity Game Engine (see section 2.1.4).
FoV: Field of view (visual field) (see section 2.2.1).
Fovea: Focused area of vision and center of attention (see section 2.2.1). Saccade: Rapid eye movement from one point to another (see section 2.2.2). Fixation: Duration of time the eye registers detail (see section 2.2.2).
HCI: Human-Computer Interaction (see section 2.3). OGD: Overt Gaze Guidance (see section 2.3.3). SGD: Subtle Gaze Guidance (see section 2.3.3). MAU: Malmö University.
DVMT: Dept. of Computer Science and Media Technology at Malmö University. EI: Egocentric Interaction research group at Malmö University.
IoTaP: Internet of Things and People research center at Malmö University. LU: Lund University.
HumLab: Humanities Lab at Lund University. LTH: Faculty of Engineering at Lund University.
1
Introduction
Predictions from turn of the millennium speculated that in the coming decades an over-whelming majority of the population would be carrying or wearing computing and commu-nications devices, also known as pervasive wearable computers [2]. Though, the definition of what constitutes a truly pervasive wearable computer varies widely depending on who you ask. Smart phones and fit trackers are marketed as having pervasive qualities, but the academic definition of an ideal such device states it should be a “continuously worn, intel-ligent assistant that augments memory, intellect, creativity, communication, and physical senses and abilities” [3].
Academia is concerned with the pursuit of a tight human-computer interaction (HCI) interface than its manifestation in hardware. It would not be uncommon for early research in the field to be constrained by heavy, bulky and wired hardware worn in belts or harnesses on the body or even with the need to be suspended from the ceiling in the pursuit of these goals.
However, recent advances in computational power and miniaturization of electronics points to that a convergence of ideals may be on the horizon. The current push from industry for Head-Mounted Display-based wearable computers to the masses for everyday use suggests that academia’s goals of a tight human and computer integration is achievable [4].
Modern HMDs cover a wide range of interrelated technologies that fall under the umbrella of Extended Reality (XR) [1]. The term XR refers to all real-and-virtual combined envi-ronments and encompasses representative forms such as Virtual Reality (VR), Augmented Reality (AR) and Mixed Reality (MR).
Although promising, many interaction challenges remain to achieve a deep integration. Primarily that of active cognitive support in the form of focusing user attention [5]. Ad-ditionally, research in the field of cognitive psychology of attention remains a major area of debate and investigation and is still reliant on metaphors to describe and identify phe-nomena [6].
Broadbent was the first to describe the human information processing system using an information processing metaphor that likened human attention to a bottleneck where in-formation is filtered for early processing [7]. In this model, Broadbent proposed that humans have a limited capacity for processing information and utilize an early selective view of attention.
m arg
in
Figure 1.1: "Spotlight". The spotlight metaphor is a simplified model frequently used
to describe visual attention. The term "spotlight" was in-spired by the work of William James, who described atten-tion as having a focus, a margin and a fringe [8]. The focus, geometric center of where attention is directed, is the area where visual information is extracted with high resolution. Surrounding the focus is the fringe where information of a much lower quality is extracted. The fringe extends to the periphery in the field of view and is cut of at the margin of where no visual information can be extracted.
1.1 Research Aim and Hypothesis
The aim of this thesis is to investigate to what degree a system could unobtrusively, perhaps even subliminally, guide attention of user by directing their gaze from the current point to a selected point in the environment. By utilizing the brain’s built-in selective attention filtering the goal is to alleviate cognitive stress in information heavy environments. Visual sensory stimuli that bypasses the filter for early visual information processing (con-scious cognitive perception) is applied and positioned at the peripheral threshold in the field of view where minimal visual information is registered.
The hypothesis is that this will result in an unobtrusive, perhaps even sublim-inal, guidance of attention within an environment.
1.2 Research Questions
The research questions are formulated to clarify the method of achieving the research aim and testing the hypothesis but also to limit the scope of the research to a reasonable width.
RQ1: What is the type and intensity of visual sensory stimuli required to bypass the filter for early visual information processing (conscious cognitive perception)?
RQ2: What are the peripheral threshold margins in the field of view where visual infor-mation can be registered?
RQ3: What method can be used to measure a user’s point of gaze (geometric center focus of attention) in an environment?
RQ4: What test scenario(s) can be used to determine if there is a measurable effect of the visual sensory stimuli?
1.3 Scope and Limiting Factors
The thesis will be limited to a controlled experiment conducted using test scenarios de-signed and implemented in a fully immersive VR environment. The choice of VR is made to eliminate and control all external variables and parameters that would otherwise be present if the environment would consist of a combination of virtual and real world such as in AR or MR. A blinded-experiment will compare user behaviour with and without attention guiding visual sensory stimuli deployed.
HMD used for interfacing with the VR environment is limited to the HTC Vive (Pro) headset and accompanying SteamVR Tracking System for tracking head and hand con-troller movements (see sections 2.1.1 and 2.1.3). Eye tracking hardware used to measure a user’s point of gaze (geometric center focus of attention) is limited to Tobii VR (see section 2.1.2). The VR environment used for development and conducting test and experiments
2
Technology and Theory
This section presents a brief overview of the technical and theoretical topics related to this thesis. The purpose is to allow the reader basic understanding of the upcoming sections. Only relevant information to this work is considered and explained.
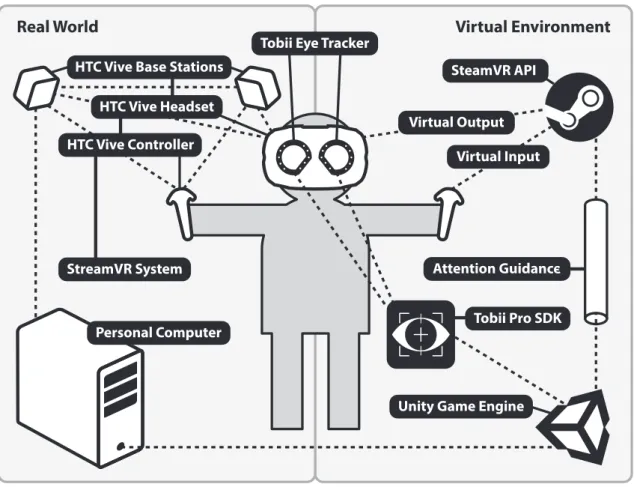
2.1 Hardware and Software
Real World Virtual Environment
StreamVR System HTC Vive Headset
Tobii Eye Tracker
Unity Game Engine HTC Vive Controller
HTC Vive Base Stations
Virtual Input Personal Computer SteamVR API Virtual Output Attention Guidance Tobii Pro SDK
Figure 2.1: An example of a conceptual system architecture model.
Hardware Software
A HMD for virtual reality from HTC Vive and Valve Corporation. A pair of hand-held controllers to enable object interac-tion in the virtual test scenario. Two base stations to reflect real-life motion in the virtual environment.
Unity to build and develop the virtual en-vironment for the test scenario.
The SteamVR interface to setup and cal-ibrate the room to reflect real-life motion in the virtual environment
Tobii Pro eye tracker (integrated with the HMD) to provide insight into how the user processes the stimuli.
Tobii Pro SDK to extract the data from the eye tracker.
2.1.1 HTC Vive Head-Mounted Display
HMD for VR utilizes active immersion by presenting stereoscopic images or visuals across the field of view [9, p. 44]. The stereoscopic image is created by showing two slightly different images on each lens for each eye, resulting in a clearer perception of the three dimensional space and the relative distances between objects [10].
The horizontal field of view in majority of HMDs is about 100◦ (the FoV in HTC Vive is 110◦) while a humans horizontal field of view is about 210◦ [11]. Furthermore, the perceived resolutions of the displays are smaller than the resolution in desktops because of the shorter distance from eye to screen and therefore more challenging to perceive details [9, p. 60]. The HTC Vive HMD has a resolution of 1080 x 1200 per eye, for a combined resolution of 2160 x 1200 [12]. Furthermore, the HMD viewport screen has a refresh rate of 90 Hz [12].
2.1.2 Tobii VR Eye Tracking
The HTC Vive Headset has an integrated eye-tracker from Tobii, it is using an improved version of the technique called "pupil centre corneal reflection" (PCCP) to track a user’s gaze [13]. The concept behind it is to illuminate near-infrared light on the eye and use image sensors to capture the reflection on the cornea and the pupil [14].
An advanced algorithm is then used to process the reflections and other relevant visual data to calculate the gaze direction [14]. Accessing the data output for each eye is done through the Tobii Pro SDK interface, either live or for post analysis. For this thesis the relevant data output is:
• Timestamp • Gaze origin • Gaze direction
Furthermore, the eye-tracker outputs data at a rate of 120 Hz and it takes approximately 10 milliseconds (latency) for it to be available for analysis after the mid exposure [14]. It utilizes "advanced slippage compensation" to avoid performance loss while the user is exploring the environment and moving the headset [14]. The accuracy or the difference between gaze position and stimuli is 0.5◦ [14].
2.1.3 SteamVR Tracking System
The SteamVR is a virtual reality system that utilizes the room-scale technology by tracking the HTC Vive Headset and the HTC Vive Controller in real time to reflect real-world motions in the virtual environment [15]. The headset and the controllers are tracked by two infrared tracking base stations located in opposite corners of the room (see figure 2.1). These base stations send out sync pulses and laser beams. [15].
A number of diodes are positioned on the headset and the controllers to reflect off the incoming laser beams back to the base stations. The orientation and the position of the user relatively to the calibrated room is then calculated [9, p. 87-88]. There are 32 diodes on each tracked device to capture a 360◦area and the location of each device can be located with millimeter precision using trigonometry [15].
2.1.4 Unity Game Engine
The Unity Game Engine offers the possibility to create two-dimensional and three-dimensional games for 24 different platforms, including the HTC Vive [16]. The development and ren-dering of the virtual environment to the HTC Vive Headset is made possible through the engine. Furthermore, C# is the primary programming language for implementing the logic to various drag-and-drop objects and the Unity interface allows importing different assets or files created outside of Unity, for example:
Asset type Description
Add-on Adds extra feature to the program, an
ex-ample is the SteamVR plugin which han-dles the implementation of the hand-held controllers in the virtual environment.
3D Adds vehicles, characters, props,
2.2 The Visual System
The visual system interprets information from visible light to construct a three dimensional representation from a two dimensional projection of the world.
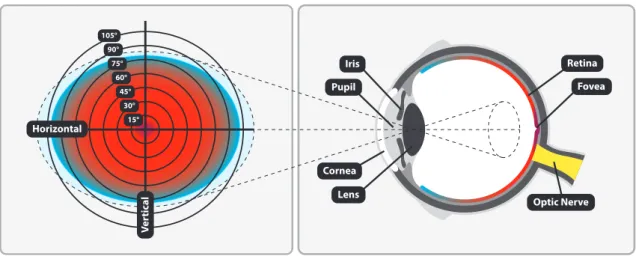
Retina Fovea Optic Nerve Lens Cornea Pupil Iris Horizontal V er ti c al 15° 30° 45° 60° 75° 105° 90°
Figure 2.2: Approximate binocular human visual field and cross-sectional view of the human eye. The purple region is covered by the fovea, where visual information of high acuity is registered. Red shifting to blue region (parafoveal and peripheral areas) is where visual information of gradually poorer acuity is registered. In the blue region and beyond, minimal to no visual information is registered.
2.2.1 The Human Eye
Light emitted or reflected from an object or a scene enters our eyes through the cornea, pupil and lens [17, p 20]. The cornea and the lens cooperate to focus light on to the retina [17, p 28], a photosensitive layer of cells at the back of the eye.
The amount of light that reaches the retina is regulated by the size of the pupil, the opening between the cornea and the lens called the iris [17, p 23]. The retina is responsible for translating the differences in light wavelength (color), contrast and luminance into a biological signal. This signal is transmitted through the optic nerve and neuronal pathways to the visual processing areas of the brain, known as the visual cortex [17, p 37].
The binocular human visual field spans approximately 210◦ horizontally and 150◦ vertically [11], see figure 2.2. However, the level of detail is not distributed evenly across the visual field. The quality of visual information that can be extracted depends on where it falls on the retina [17, p 34].
The focused area of vision, the geometric center of where attention is directed, is covered by the fovea [17, p 34]. It has a slightly irregular shape and is about half a millimeter in diameter. Visual information óf high acuity is registered in this area due to its high density of photosensitive cells [17, p 30]. The parafoveal and peripheral areas make up the
2.2.2 Eye Movements
The sampling ability of the human eye limits how visual information is registered in an environment. Due to acuity decreasing rapidly past the narrow foveal region at the center of our visual field, the human eye possesses a range of movements to direct focus to target locations of interest [17, p 347].
The movement of realigning the fovea from on point of interest to another is called a saccade and is rapid [17, p 347]. During a saccade visual processing is suppressed, as the rapid speed produces blurred and useless visual information [17, p 350]. Following a saccade there is a period of fixation where the fovea is kept aligned with the target for a certain duration of time, allowing for details to be processed [17, p 349].
Saccade Fixation
Average Duration 30-40 ms 200-300 ms
Average Latency 200 ms n/a
There are other types of eye movements (pursuit movements) used to keep the fovea aligned when the head and body are moving, tracking moving objects or both [17, p 347].
2.2.3 Visual Perception
Visual perception is guided by alternating between sequences of fixations and saccades. We primarily register visual information through the foveal region which constitutes less than 1% of the visual field. Even though this represents only a small part of our field of vision, the information registered through the foveal region constitutes about 10% of what is sent to the brain through our optic nerve [18].
This means that the brain receives the highest possible image resolution and maximum information registered by the eye of the interesting area to process. However, this does not mean that the brain has consciously registered any changes, only that the eye has registered a change. In addition to needing time to register an image, the eye also requires time for the image to disappear from the retina [19].
2.2.4 Visual Attention
A basic definition of attention is the process by which the brain selects information for further processing. Psychologists distinguish between two types of perception that interact, both competitively and cooperatively [20, 21]:
Bottom-Up Processing Top-Down Processing
Fast data-driven processing is carried out in one direction from the retina to the vi-sual cortex. With each succession a more complex analysis of the input is made.
Slower processing that makes use of con-textual information in pattern recognition. Implements long-term cognitive strategies based in prior knowledge and experience.
2.3 Human-Computer Interaction
Human-computer interaction (HCI) is a practice that emerged in the early 1980s, initially as a specialty area in computer science embracing cognitive science and human factors engineering [22].
As a field of research, HCI is situated at the intersection of several different areas of research such as computer science and engineering, psychology, neuroscience, cognitive neuroscience and neuropsychology.
HCI is centered around the design and use of computer technology, with focus on the interfaces between people (users) and computers. Researchers in the field of HCI both observe the ways in which humans interact with computers and design technologies that let humans interact with computers in novel ways.
2.3.1 Modelling Perception, Cognition and Action
The Model Human Processor (MHP) [23] is a early cognitive engineering method used to calculate how long it takes to perform a certain task.
It was intended to assist developers apply principles from cognitive psychology when mak-ing engineermak-ing calculations of human performance. The method likens the human body and mind to a set of processors (perception, cognition and action), memory storage and their set of interconnections.
Broadbent was the first to describe the human information processing system using an information processing metaphor that likened human attention to a bottleneck where in-formation is filtered for early processing [7]. In this model, Broadbent proposed that humans have a limited capacity for processing information and utilize an early selective view of attention.
The body-and-mind-centric model by S. Jalaliniya and T. Pederson [5] is a simplified representation of the information flow that occurs when a human acts in its surrounding environment. The model describes the concept of a perception-cognition-action loop in order to illustrate where perception, cognition and action overlap in the mind.
Furthermore, body-and-mind-centric model highlights the divide between conscious and unconscious cognitive processing. This divide can be viewed as the bottleneck with limited information processing capacity that utilizes a filtered view of attention and cognitive perception (or attention filter) as described by Broadbent [7].
See figure 2.3 for a condensed and modified version of this model as it relates to visual information and the scope of this thesis.
The purpose of these models are not to provide a completely accurate representation but rather a good-enough account of the processes involved and allow for the design of inter-active systems.
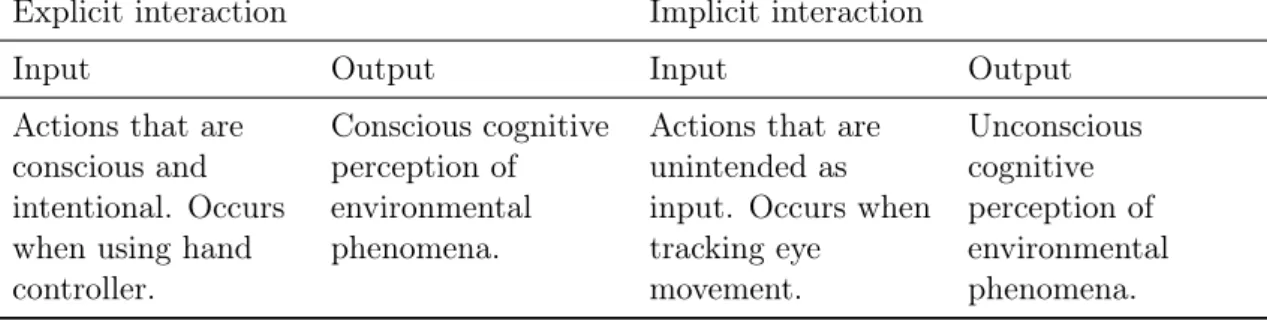
2.3.2 Explicit and Implicit Interaction
One of the cornerstones of HCI is the concept of implicit and explicit interaction, see red and blue pathways in figure 2.3. Interaction is further broken down into input (action) and output (perception) [24].
Explicit interaction Implicit interaction
Input Output Input Output
Actions that are conscious and intentional. Occurs when using hand controller.
Conscious cognitive perception of environmental phenomena.
Actions that are unintended as input. Occurs when tracking eye movement. Unconscious cognitive perception of environmental phenomena. Perception (Output) Action (Input) Unconscious Cognitive Processing Conscious Cognitive Processing Body Sensors (Vision) Body Actuators (Muscles) Virtual Environment Phenomena Attention Guidance Stimuli
Human Body & Mind Virtual Environment Attention Filter Explicit Pathway Implicit Pathway Cognition
Figure 2.3: A condensed and modified version of the body-and-mind-centric model and perception-cognition-action loop concept by S. Jalaliniya and T. Pederson [5] as it relates to visual information and the scope of this thesis. The explicit and implicit pathways in red and blue illustrate conscious and intentional as well as unconscious and unintentional interaction (perception and action), respectively.
2.3.3 Peripheral Interaction and Designing Active Cognitive Support
Peripheral interaction aims to make use of human capabilities and senses like divided attention, spatial memory and the sense of the internal state of the body to support interaction with digital devices in the periphery of the attention, consequently semi-parallel to another primary task [25, 26].
To assist in directing or guiding attention in virtual environments, eye-tracking cameras are fitted to the latest consumer HMDs or headsets and used to measure the point of where the user is looking in the 360◦ environment.
A wide range of methods and techniques have been explored to boost visual importance for a selected point in a scene. This relatively new area of HCI research is commonly referred to as "Gaze Direction” [27]. Gaze Direction, sometimes also called "Gaze Guidance" [28], can be split into two distinct categories: overt and subtle:
Overt Gaze Direction Subtle Gaze Direction
Overt Gaze Direction methods involve rec-ognizable image transformations to pro-voke and trigger adjustments in users’ point of view. Some of the discrete tech-niques make use of blur, highlighting, or saliency adjustments. Other more intru-sive methods involve clearly visible arrows, lines or funnels pointing towards the tar-get. Most extreme is an autopilot tech-nique that rotates the view automatically. Even though these methods have proved to yield high success rates, they greatly dis-turb the user experience.
Subtle Gaze Direction aims to keep the vis-ibility of the guidance stimuli to a bare minimum. Such visual cues tend to be a bit more abstract and are designed to only be perceivable in the periphery of the visual field and usually disappear when directly observed. These types of stimuli often use high frequency flicker and are basically un-noticeable, thus enabling the direction of attention without interrupting the visual experience.
See section 3 (Related Work) for a deeper review of previous research into several tech-niques and methods developed for guiding and directing gaze and attention in virtual environments.
3
Related Work
In this section, articles relevant to the thesis are reviewed. At the end of each subsection, comments on how the paper relates to this thesis are presented.
3.1 Subtle Gaze Guidance for Desktop Environments
Bailey et al. [27] developed a technique called Subtle Gaze Direction (SGD) to unobtru-sively draw attention to a selected target on a computer screen.
Two types of stimuli were utilized:
Luminance modulation Warm-cool modulation
A circular region (1 cm in diameter) was being alternated with a black and white colour at a rate of 10 Hz.
A circular region (1 cm in diameter) was being alternated with a warm (red) and cool (blue) colour at a rate of 10 Hz. The stimuli were switched off as soon as the gaze was within a threshold off less than 10◦ towards the target location. An eye-tracker was used to keep track of the user’s gaze. Additionally, the switching was performed during a saccade movement to take advantage of saccadic masking and to increase unobtrusiveness. The intensity of the stimuli was determined in a pilot study were the participants were given the instructions to look at the center of the screen and to adjust the intensity variable with the keyboard buttons (+/-) until it was observed in the peripheral. The average result from the pilot study was then used in the main experiment to evaluate the impact of the gaze guidance technique. In the main experiment, the stimuli was presented on a 20-inch monitor, operating at 75 Hz with a resolution of 1280 x 1024. Furthermore, the images had the same resolution and the stimuli was only being present in the peripheral view.
The participants were seated 75 cm in front of the computer screen. At this distance the area of high acuity corresponded to a circular region of 5 cm in diameter on the screen. The stimuli was manually placed by the authors at a region with low contrast, low detail, low color saturation and uninteresting objects.
Furthermore, the eye-tracker was polled before a new upcoming modulation to ensure that the current gaze point was not in the immediate vicinity of the stimuli. To minimize the occurrence, the authors selected target locations spread across the image.
The authors concluded that their method drew attention to their selected target without distraction or confusion. However, subjective evaluations of the modulated image quality were lower than the static image quality. Furthermore, since the stimuli were switched off before a user could fixate on them, their gaze did not always reach the target location. Comments
The paper is relevant to this paper since it provides an unobtrusive gaze guidance tech-nique.
3.2 Subtle Gaze Guidance for Immersive Environments
Grogorick et al. [28] extended Bailey’s et al. gaze guidance technique for desktop en-vironments [27] with two functions to optimize it for immersive enen-vironments. The first function, dynamic stimulus shape adaption, adjusted the shape of the stimuli in the far peripheral of the user’s sight. The second function, dynamic stimulus positioning, enabled guidance outside of the user’ field of view.
An eye-tracker was used to locate the current gaze of the user and to control the state of the stimuli. The authors used a maximum deviation threshold of 10◦ to switch off the stimuli during a saccade movement towards the target location.
Furthermore, the authors explored visibility thresholds, 45◦vertically and 45◦ horizontally, by estimating the stimuli size across the available range of eccentricities in the HMD. Both static and dynamic scenes were considered, and the result was used to implement dynamic stimulus positioning and dynamic stimulus shape adaption.
In the static scene, 19 floating spheres had a fixed position and were placed along a horizon-tal line. The adjacent spheres were placed every 5◦ visual angle apart until reaching 45◦. The participants were instructed to stare at a fixed sphere in the center and to increase the stimuli size with the up and down arrow keys on a keyboard until it became noticeable. The experiment was finished when the stimuli size for each sphere was set.
In the dynamic case, 4 shape objects with a virtual size of 20 x 20 x 20 were duplicated 200 times and surrounded the participant in an almost full circle (270◦). A fifth shape object, a sphere, was added to the cluster only once and the participant were assigned the task to find it amongst the other shape objects. They were also assigned the task to press the space bar on the keyboard if they perceived the stimuli in the peripheral vision. It was increasing in size until the participant pressed the space bar. The offset was set to 5◦ in the beginning of the experiment, but it was gradually increasing until reaching 40◦. The authors produced a linear equation that described the eccentricity–dependent stimuli size for dynamic and static scenes. The dynamic linear equation was utilized in a user study that consisted of an experiment, similar to the dynamic scene. However, the participants could not change the stimuli size. The result from the user study showed that the search task for hidden objects can be improved.
Comments
This paper is relevant for this thesis since it provides optimization’s for gaze guidance in a virtual environment. Furthermore, both this thesis and the article consists of test scenarios for evaluating the impact of the gaze guidance technique. Thus, the experiment in the study can be used as a guideline when designing our experiments.
3.3 Comparison of Five Different Gaze Guidance Techniques in an Im-mersive Dome Environment
Grogorick et al. [29] measured success rate and unobtrusiveness of five different gaze guid-ance techniques in a custom-built high-resolution immersive dome environment. The dome had a diameter of 5m and used six real-time video projection system’s with a resolution of 2560 x 1600 and a frequency of 120 Hz.
Six different real-world 360◦panoramas scenes were shown together with a randomly chosen gaze guidance technique. The target location for attracting the gaze was manually placed by the authors in the "not most salient but not completely featureless and single-colored region" either. Furthermore, the success rate and the detection of a saccadic movement was analyzed and measured with the help of an eye-tracker. The detection of a saccadic movement provided a threshold for when to switch off the stimuli.
Technique Description
ColorDot A small red dot was shown for 120ms to take advantage of saccadic mask-ing and thus increase unobtrusiveness. Additionally, the stimuli was pre-sented repeatedly every 2s to let the participants explore the surround-ings while eventually achieve a successful guidance. Furthermore, an eccentricity-based scaling was applied because of the strong acuity degra-dation in the human vision.
SGD Applied luminance modulation to vary the brightness at the target loca-tion.
ZoomRect A rectangular magnification was applied to the target location. The pre-sentation time was set to 120ms and an eccentricity-based scaling was applied as in the ColorDot technique.
ZoomCircle A circular magnification was applied to the target location. The presen-tation time was set to 500ms because the authors stated that the effect of the increased presentation time would result in a slower magnification process and thus be perceived as if it was moving towards the viewer. SpatialBlur "Used a spatial filtering to reduce details in non-target regions."
The result from the experiment showed that it took a longer time to react to a stimuli the more eccentric it was. All techniques increased the attention to the target location but only the first second of gaze data was analyzed after the stimuli onset because of the different duration times. Furthermore, ColorDot, ZoomCircle and ZoomRectangle induced saccades within 1s towards the target area for approximately 70% of the participants. However, the number was reduced to 40% when the repetition of the stimulus was turned off. SpatialBlur was the only technique that induced saccades for approximately 20% of the participants.
Comments
This paper is relevant for this thesis since it measures success rate and unobtrusiveness of different gaze guidance techniques.
3.4 Influence of Subliminal Cueing on Visual Search Tasks
Pfleging et al. [30] conducted an experiment in a desktop environment to evaluate the impact of subliminal no-blinking visual modulations on gaze behaviour.
The participants were seated 70 cm from the computer screen and were instructed to follow the re-locations of a 4.27◦ x 3.47◦ red ellipse in a grid as fast as possible. The ellipse was completely visible for 2s before becoming invisible and showing its "ghost image" (stimuli) at the next location in the grid. By doing so, the authors wanted to draw the attention to the target location before the appearance of the red ellipse. Additionally, the stimuli had intensity levels ranging from invisible to subliminal and clearly visible and a dynamic translucency was applied to account for the various distances between the current gaze position and the target location. Furthermore, the participants were told that the purpose behind the experiment was to study the reactions since the authors did not want an active search of the stimuli.
The result from the experiment showed that no measurable effect could be seen on the gaze arrival times when using the subliminal stimulus. There were no improvements compared to the control condition (no stimuli). However, the visible stimulus showed improvements on the gaze arrival times.
Comments
This paper is relevant to this thesis since it is using a blinded-experiment for evaluating the stimuli impact on the user gaze behavior with and without the stimuli.
4
Methodology
This section outlines the research process and methodologies used to answer the research questions in order to test the hypothesis of this thesis, see section 1.2.
The research process is carried out in two phases using a combination of research meth-ods. Development and verification of a system prototype is followed by deployment of the prototype in experimental test scenarios. Empirical data to be analysed quantitatively is generated and obtained by conducting an experiment under controlled conditions.
4.1 System Development
The first phase of the research process is to develop and verify a system prototype. Systems Development in Information Systems Research by Nunamaker et al. [31] is used to provide the main research methodology.
This methodology is set up to develop a system as scientific research and describes a systematic approach to constructing and evaluating a system prototype. The approach consists of five stages that are emphasized to be carried out in order. However, if new insight is gained to improve the system, revision and reiteration of earlier stages is encouraged, see figure 4.1. Conceptual Framework Construction System Architecture Development System Analysis and Design Prototype Construction Prototype Observation and Evaluation
Figure 4.1: Five stages of the Systems Development Research Methodology [31].
4.1.1 Conceptual Framework Construction
The initial stage of the method by Nunamaker et al. [31] is to clearly define an aim for the research along with a hypothesis as well as formulate research questions that provide focus for the development moving forward.
In order to gain knowledge about the problem domain, a literature study is carried out. The study is focused on hardware and software functionality and requirements, the principles of human-computer interaction (HCI) and previous related work within the area of research of gaze/attention guidance/direction.
In addition, brainstorming sessions and meetings are held with representatives from the Dept. of Computer Science and Media Technology (DVMT) and Egocentric Interaction re-search group at Malmö University as well as the Humanities Lab at Lund University. The material resulting from the literature study as well as brainstorming sessions and meetings provide the foundation for section 2 (Technology and Theory) and section 3 (Related Work).
4.1.2 System Architecture Development
The second development stage is dedicated to specifying the individual components of the system, their purpose and defining the interrelationships between them. Using the conceptual framework as a basis a system specification and list of requirements is written. Most of the requirements are defined during brainstorming sessions.
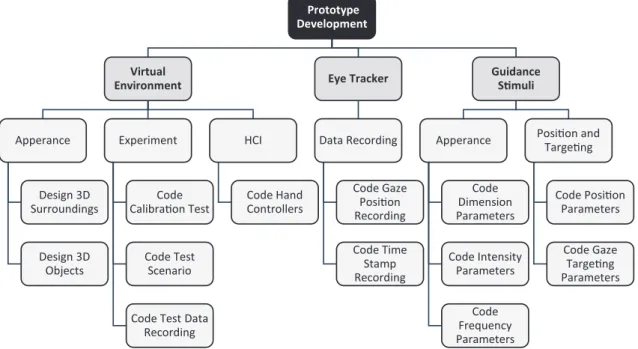
A rough system is proposed and broken down into subsystems, further requirements are then specified for each subsystem (see figure 4.2). Ways to validate the system against the requirements are also discussed. However, focus is concentrated on developing a working system architecture, not on optimization.
A conceptual system architecture model is seen in figure 2.1.
Prototype Development Virtual Environment Apperance Design 3D Surroundings Design 3D Objects Experiment Code Calibra!on Test Code Test Scenario
Code Test Data Recording HCI Code Hand Controllers Eye Tracker Data Recording Code Gaze Posi!on Recording Code Time Stamp Recording Guidance S!muli Apperance Code Dimension Parameters Code Intensity Parameters Code Frequency Parameters Posi!on and Targe!ng Code Posi!on Parameters Code Gaze Targe!ng Parameters
Figure 4.2: An example of system broken down into subsystems.
4.1.3 System Analysis and Design
The third development stage is dedicated to the design and analysis of the system and subsystems. At this stage, each subsystem requirement is clearly defined, and solutions are proposed. Each solution proposal is then analyzed and verified against its predefined requirements.
This stage also involves and encourages the creation of multiple design alternatives and ultimately choosing one of the design specifications as the blueprint for the implementation of the final system.
4.1.4 Prototype Construction
The fourth development stage is the process of implementing the system design specifi-cations resulting from previous stages. A working prototype provides knowledge of the advantages or disadvantages and demonstrates the feasibility of the design and the use-fulness of the functionality. The accumulated experiences and knowledge provides insight helpful when reshaping the system. Empirical studies of functionality and usefulness can only be carried out after the prototype has been built and is ready.
4.1.5 Prototype Observation and Evaluation
The final development stage tests performance and usefulness as well as evaluates function-ality. The results of testing are interpreted and evaluated on the basis of the conceptual framework and system requirements defined in previous stages. After the completion of this stage the prototype is ready to be deployed in the controlled experimental settings of the next phase of the research process.
4.2 Controlled Experiment
The second phase of the research process is the deployment of the prototype in experimental test scenarios. Empirical data to be analysed quantitatively is generated and obtained by conducting an experiment under controlled conditions.
A blinded-experiment will compare user behaviour with and without attention guiding visual sensory stimuli deployed. Information about the test is masked from the participant until after a trial outcome is known to reduce or eliminate bias. It is understood that bias may be intentional or subconscious, thus no dishonesty is implied by blinding.
5
Results and Analysis
In this section the results of the work to answer the research questions are presented.
5.1 Attention Guidance System (AttentionCompass)
The system developed to guide an individuals attention in a virtual environment consists of an abstract visual stimuli that is positioned in the direction of a selected target and in periphery of the users field of view. However, depending on the distance from the user to a selected cued target as well as the orientation of the individual’s body, head and point of gaze, the stimuli is configurable with a range of characteristics.
5.1.1 Directional Targeting
In order to accurately position the stimuli in the direction of a selected target the 3-dimensional virtual world coordinates (X, Y, Z) of the target are projected on to the 2-dimensional plane (x, y) of the HMD’s viewport screen. Figure 5.1 shows the projection of coordinates but for illustration purposes the screen is represented as experienced by the user. In reality it is split down the middle and renders the separate images needed for each eye to enable depth perception in the virtual world.
x y X Y Z x y Target at (X, Y, Z) Target at (x, y) HMD Viewport (0, 0) w v n Virtual Environment
The target distance vector w is calculated by measuring the distance from position of the HMD to the selected target in 3-dimensional space. This vector can also be expressed in relation the normal vector n formed by the direction of the HMD and in extension the direction of the individual’s body and head as follows:
w = w⊥n+ wkn where w⊥n = v and wkn =
w · n
|n|2 n (1)
The projection is completed by reordering the formula to solve for v:
v = w − w · n
|n|2 n (2)
The x- and y-coordinates obtained by v are used to correctly position the stimuli in the plane formed by the viewport of the HMD screen.
5.1.2 Configuration
The characteristics of the stimuli are configured using the following parameters:
Parameter Value Description
stimuliColor RGBA Red, green, blue and alpha (transparency) color space channels of the stimuli.
stimuliScale (X, Y, Z) 3-dimensional size of the stimuli.
stimuliCenterOf f set 0-100% Center offset to position the stimuli at the periph-eral threshold in the field of view.
alphaM in 0-100% Minimum alpha (transparency) of the stimuli. Any setting above 0 will prevent the stimuli from ever becoming completely transparent.
alphaM ax 0-100% Maximum alpha (transparency) of the stimuli. Any setting below 100 will prevent the stimuli from ever becoming completely opaque.
alphaN earF ade 0-100% Distance threshold where alpha (transparency) of the stimuli stops fading out towards the alphaM in value.
alphaF arF ade 0-100% Distance threshold where alpha (transparency) of the stimuli starts fading out away from the alphaM ax value.
pulseOscillator true/false If the stimuli should pulse oscillate or "flicker". pulseF requency Hz Pulse frequency (Hz) of the stimuli.
pulseDutyCycle 0-100% Duty cycle width of the pulse oscillator. oscillatorF requency Hz Oscillator frequency (Hz) of the stimuli.
5.1.3 Movement and Positioning
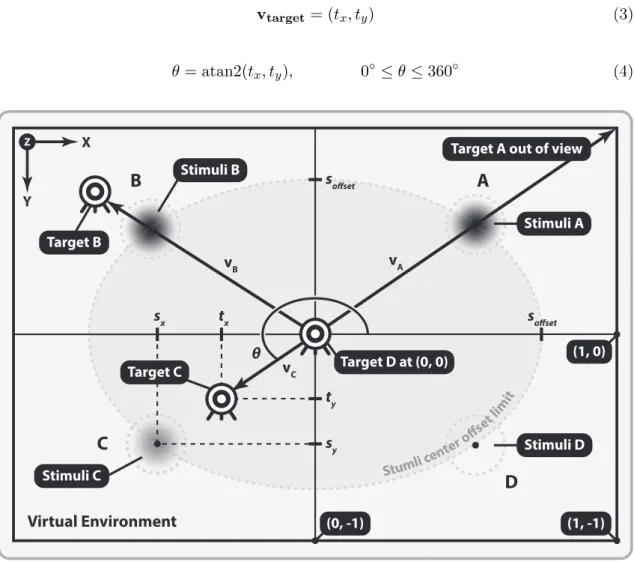
In order to enable the positioning the stimuli in the periphery of the user’s field of view in the HMD viewport the directional target coordinates tx and ty of vtarget (see section
5.1.1) are extracted and the directional angle θ of the target is calculated as follows:
vtarget= (tx, ty) (3) θ = atan2(tx, ty), 0◦≤ θ ≤ 360◦ (4) X Y Z (0, -1) (1, -1) (1, 0) Stimuli A Stimuli C
A
B
C
Stimuli B θ sx sy soffset soffset ty tx Target C Target BD
Stimuli D Target D at (0, 0) vA vBTarget A out of view
Stumli ce nter o ffset lim it vC Virtual Environment
Figure 5.2: Movement and position of the stimuli based on four target scenarios (A-D).
Having obtained the directional angle θ the stimuli position coordinates sx and sy are calculated using the sof f set parameter (stimuliCenterOf f set):
sx = sof f setsin θ, −1 ≤ sx≤ 1 (5)
Illustrated in figure 5.2 are four scenarios (A-D) of the selected target being located at different distances and directions from the user’s center of view.
In scenario A target A is out of view and the stimuli is positioned at the center offset limit in the direction the user’s attention/gaze should be moved/turned to position the target in the center of view.
In scenario B target B is in view but it has not yet passed inside the center offset limit and the stimuli is still positioned in the direction which attention/gaze should be moved/turned to position the target in the center of view.
In scenario C target C is in view and inside the center offset limit and the stimuli alpha (transparency) has begun to fade out from the value of the alphaM ax and alphaF arF ade parameter values. The stimuli is now positioned in the opposite direction of the target to indicate that a correction/movement of attention/gaze is needed in the corresponding direction to finally position the target in the center of view.
In scenario D target D is in the center view and the stimuli alpha (transparency) has completely faded out to the value of the alphaM in and alphaN earF ade parameters as to indicate that no further user corrections are needed and the guidance is effectively disabled as the user’s attention/gaze is positioned on the center of the selected target.
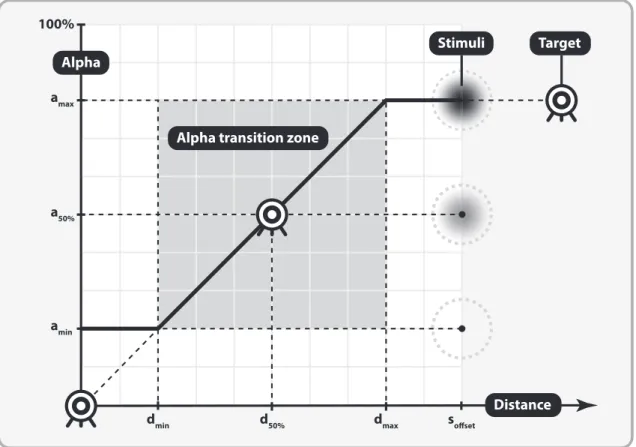
5.1.4 Transparency (Alpha)
The transparency (alpha) of the stimuli is based on the distance from the selected target to the center of the user’s view. If the target is out of view the alpha is set to the value of alphaM ax and is the target is in the center of view is is set to the value of alphaM in. Alpha transition (fade) starts when the selected target has passed the limit set by the
sof f set(stimuliCenterOf f set) as well as dmax(alphaF arF ade) parameters. End of alpha
transtion occurs when the target has passed the limit set by dmin (alphaN earF ade).
Target distance dtarget is calculated using target coordinates tx and ty from equation 3 in
the following formula:
dtarget =
q t2
x+ t2y, 0 ≤ dtarget≤ sof f set (7)
If dt is < sof f set the value is re-scaled to account for the settings of the dmin and dmax
parameters:
dscale=
dt− dmin
dmax− dmin
, 0 ≤ dscale≤ 1 (8)
To calculate the final alpha (transparency) value another re-scale occurs based on the dscale value and the amin and amax parameter settings:
a = dscale(amax− amin) + amin, amin ≤ a ≤ amax (9)
Figure 5.3 further illustrates details on how transparency (alpha) of the stimuli relates to the distance to the selected target from the center of view.
amin soffset dmin d50% dmax amax 100% a50% Alpha Distance Alpha transition zone
Stimuli Target
Figure 5.3: Transparency (alpha) in relation to target distance from center of view.
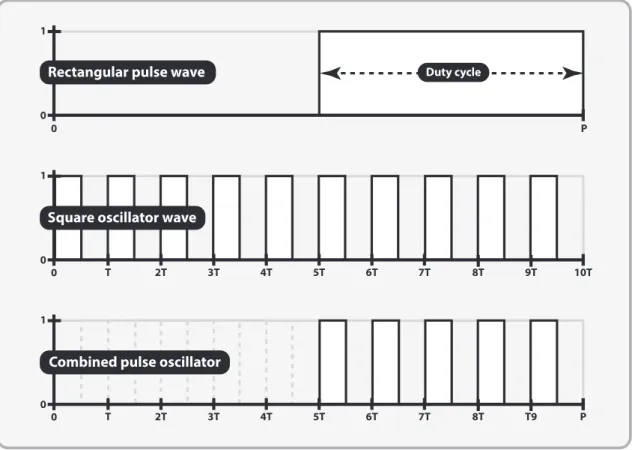
5.1.5 Pulse Oscillator
The purpose of the pulse oscillator is to turn the visibility of the stimuli on and off at a high rate of "flicker" in order to enable an unobtrusive property of the stimuli and perhaps make it unnoticed or at the least less noticeable to the user.
Since the update frequency of the HMD screen is 90 Hz (see section 2.1.1) it was sum-marized that the maximum oscillation frequency of the stimuli was limited to 45 Hz as it needed to be turned on and off within one period. The rendering rate of the Unity Game Engine was also configured to target a rate of 90 FPS (frames per second) in order to aid in the aim of a smooth oscillation without dropping any frames.
The pulse oscillator consists of two signal components that are combined and applied to the alpha (transparency) value of the stimuli. The first signal is the rectangular pulse wave component which determines when the oscillation is active and the length of the pulse (frequency) is configured using the pulseF requency parameter. The active period length of the pulse is configured using the pulseDutyCycle parameter. The second signal is the square oscillator wave component and is used to control the rate of flicker by setting the oscillatorF requency parameter.
0 1 P T 2T 3T 4T 5T 6T 7T 8T T9 0 0 1 10T T 2T 3T 4T 5T 6T 7T 8T 9T 0 0 1 0 P Duty cycle
Combined pulse oscillator Square oscillator wave Rectangular pulse wave
Figure 5.4: Pulse oscillator parameters.
5.1.6 Eye-Tracker Integration
The Tobii eye-tracker (see section 2.1.2) is integrated to correct for the fact that the center of the HMD viewport is not always correlated with where the user’s point of gaze is directed in the virtual environment. If the center of the HMD viewport is positioned at the target but the point of gaze of the user is directed elsewhere the stimuli needs to be adjusted accordingly.
If the stimuli can be directly observed and its positioning in the periphery can not be guaranteed its elusive properties which attention guidance is based on are lost. The stim-uli should disappear when directly observed or when the user is observing the selected target.
To fully integrate of the point of gaze position with the movement, positioning and alpha (transparency) properties of the stimuli from figures 5.2 and 5.3 a new distance vector vgaze from the point of gaze to the stimuli needs to be taken into account.
This means, if the target is in view (dtarget within sof f set) and vtargetis closer than vgaze
in equation 3 then coordinates tx and ty of vtarget are used to set alpha in equation 7.
Otherwise the target is out of view and alpha is always set using coordinates gx and gy of vgaze in equation 7.
5.1.7 Observation and Evaluation
Prior to deployment of the visual sensory stimuli in the controlled experiment a final configuration of its parameters are locked in. The stimuli parameters are evaluated on the hypothesis that its characteristics should result in an unobtrusive, perhaps even subliminal, guidance of attention within an environment.
Research questions RQ1 and RQ2 (see section 1.2) are taken into account during the observation and evaluation of the stimuli characteristics.
The general appearance of the stimuli can be any sprite (bitmap image). In order to achieve a high level of visual abstraction of the stimuli (maintain bottom-up processing, see section 2.2.4) and minimize triggering complex visual analysis (top-down processing, see section 2.2.4) a simple monochrome gradient dot is used as the main appearance of the stimuli, see figures 5.2 and 5.3.
The evaluation of parameters are based on the subjective observations of the researchers as well as a handful of volunteers with preexisting knowledge of the desired characteristics. Following a random start, parameters are gradually adjusted through trail and error until a subjective threshold for unobtrusiveness is experienced.
The final configuration parameters to be deployed in the controlled experiment:
Parameter Value Description
stimuliColor 0,0,0,* Black tint was judged to be less obtrusive than white or any other color. Alpha is distance dependent. stimuliScale 5x5% Corresponds to approximately 5x5 cm (2-dimensional)
size. Smaller or larger sizes are judged to be more easily ignored.
stimuliCenterOf f set 70% Closer than a 70% offset was judged to increase ob-trusiveness. Farther was judged to be easily ignored. alphaM in 0% Complete transparency was judged more effective
than always slightly visible.
alphaM ax 80% 20% below maximum visibility was judged to increase unobtrusiveness.
alphaN earF ade 20% Allowing a center of view tolerance of 20% for when alphaM in is reached increased unobtrusiveness. alphaF arF ade 80% Allowing a target distance tolerance of 80% of
stimuliCenterOf f set for when fade from alphaM ax begins increased unobtrusiveness.
pulseOscillator true Pulsing was judged to increase unobtrusiveness. pulseF requency 1 Hz Pulse length of 1 second was judged to suffice.
5.2 Controlled Experiment
The experiment was conducted to evaluate the stimuli impact on human attention. Specif-ically, evaluate if the attention guidance system as described in section 5.1 could guide the participants gaze to a desired location and influence their choice within the virtual environment. During the experiment, the same hardware and software as described in sec-tion 2.1 was used and a room size of at least 2x1.5m was utilized to allow the participant to freely walk around the environment. Furthermore, the SDK package from Tobii [32] was imported to Unity. It contained several scripts for the eye-tracking component such as retrieving the gaze vector and performing an eye-calibration. With that being said, the third research question, RQ3 (see section 1.2), was taken into consideration. A more detailed explanation of the experimental task is described in section 5.2.1. Also, relevant information regarding the participation is described in section 5.2.2.
5.2.1 Experimental Task
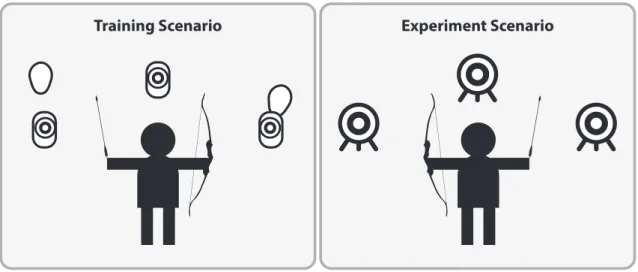
Research question RQ4 (see section 1.2) was taken into account during the implementation of the experimental task. The task consisted of shooting a longbow at three static targets as shown in figure 5.5 (both the longbow and the targets were imported from the SteamVR package). The targets were placed at an equal distance from the participant and were visible without the need of turning the body “too” much. An assumption was made that no target would be favored considering the distance between them. Additionally, they were placed at such a distance from the participant as to indicate some level of difficulty. The measurable effect that was expected from this experiment was that each participant would be guided to the target that was being cued and to fire an arrow at it.
The experiment finished automatically after the participant had fired the 24tharrow.
Experiment Scenario Training Scenario
(a) Start of training scenario. (b) During training scenario.
(c) During experiment scenario.
(d) Experiment scenario. Stimuli (black gradient dot) visible to the left.
5.2.2 Participants
The participants were recruited at Malmö University and volunteered to take part in the experiment - 16 male and 14 female, six of them were wearing glasses during the experiment. The other participants were not asked if they were wearing glasses or lenses.
Each participant was exposed to the same predefined sequence of target cueing. That way the participant would not be able to figure out which upcoming target was going to be cued since it switched between the three targets accordingly.
Left Target Center Target Right Target X X X X X X X X X X X X
Furthermore, the participants were placed with their back facing the targets to ensure that their current gaze point was not in the immediate vicinity of the cued target. However, this orientation of the participant was only adjusted once at the start of the experiment. During the first 21 experiments, the stimuli settings was configured as shown in section 5.1.7. After these experiments, the stimuli settings was configured to be more visually invasive. Specifically, for experiment 22-26, the stimuli scale was increased to X = 0.1 Y = 0.1 Z = 0, the pulse frequency was increased to 10 Hz and the pulse duty cycle was increased to 50% . A further change was made to make the stimuli even more invasive by changing the off-center to 65% for experiment 27-30.
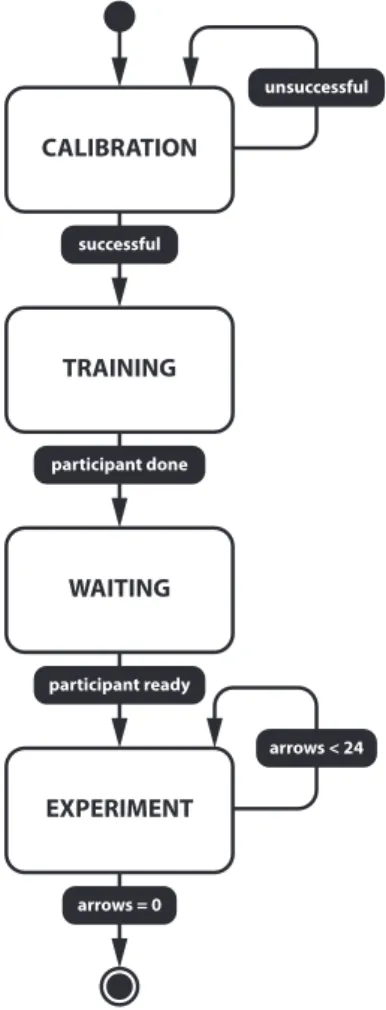
5.2.3 Finite-State Machine
Only one Unity scene is used throughout the participation. Having said that, one has to, among other things, teleport the player object to another location and hide/show game objects in the scene depending on what the task is in a given moment. Thus, a finite state machine is created with the following states:
CALIBRATION TRAINING EXPERIMENT WAITING unsuccessful successful participant done participant ready arrows < 24 arrows = 0
Figure 5.7: State machine. Calibration. The gaze point calculation is adjusted for
every participant since the eye characteristics are not the same for everyone. They are instructed to look on a red dot (calibration dot) which decreases in size. The dot eventu-ally disappears but only to return to its original size and to appear at a different location in front of the participant. A total of five calibration dots are shown. Following a suc-cessfully completed calibration the participant is taken to the training state.
Training. During the training phase, the participants get to know how to shoot the longbow to familiarize them to the virtual environment and to get them all to a base-line where they can perform the experiment “equally well”. When the participant feel comfortable and ready to con-tinue, the space-bar on the keyboard is pressed which takes them to the waiting room.
Waiting. The participants receives a briefing from the re-searchers on the experiment task while being in a completely grey colored room with no objects. The space-bar on the keyboard is once again pressed down to take them to the ex-periment state if the they feel ready to start the exex-periment after the briefing.
Experiment. The participant is teleported back to the archery scene. However, new and bigger static targets are displayed while the smaller targets used for the training are removed. All of the participants were exposed to the same conditions (without and with stimuli). Odd order of
experiments (1, 3, 5 etc.) are run without enabling the stimuli until the 12th arrow is
fired. Similarly, even order of experiments (2, 4, 6 etc.) are run with the stimuli being enabled from the start of the experiment until the 12th arrow is fired. The experiment is finished after the 24th arrow has been fired and the relevant data is saved.
5.2.4 Data Recording
Relevant data from each experiment is saved and stored in a XML (Extensible Markup Lan-guage) file to evaluate the stimuli impact on the participants. A script (DataRecorder.cs), which handles the data recording, is attached to the state machine. This script stores a list of serializable "DataPoint"-classes which in turn contain relevant data variables that act as elements in the XML file.
Data Variables Description
ID is used to identify what kind of observation is currently being recorded: • the target (1, 2 or 3) that is observed
• the arrow (1-24) that is fired
• the target that is hit (1, 2 or 3) or if it is a miss (0) • the target that is being cued (1, 2 or 3)
Series is used for the data visualization
StartTime is used to indicate the start of an observation in seconds since the start of the program.
EndTime is used to indicate the end of an observation in seconds since the start of the program.
Duration is used to show how long the stimuli is active on each target as well as how long the participant observes a target for a given moment. In other words, these data variables provide a:
• timestamp for when attention guidance is enabled/disabled and which target is being cued and for how long.
• timestamp of when a target starts/stops being observed and for how long it is being observed.
• timestamp for when an arrow is fired.
• timestamp for when a target is hit or when a target is missed.
All of the timestamps are synchronized since they are retrieved with the same clock in Unity throughout the data recording.
Furthermore, the data is stored automatically in a separate XML file in the “Data” folder within the project root folder when the experiment is finished. In order to make the file labeling a bit easier, an additional XML file was created to keep track of the number of experiments that had been conducted. The current experiment number was then appended to the string experiment_, thus each XML file was autonomously labeled after the current experiment number and was stored anonymously, for example “experiment_1.xml”.
5.2.5 Data Visualization
The data that is gathered during each experiment is visualized in a horizontal bar chart to simplify the process of analyzing the participants behaviour with and without the stimuli (see appendix A). The horizontal axis represents the time in seconds since the start of the experiment and the vertical axis represents the different categories of data.
Category Description
Left/Center/Right Target Each target is represented as a separate category in order to visualize how long each target is being cued for (represented with a grey bar) and how long the participant observes each target (represented with a red bar). Also, a target hit is represented with a black asterix symbol (*) indicating that the participant fired an arrow.
Arrows The Arrows category shows whenever an arrow is being fired (represented with a triangle) and whenever an arrow miss one of the targets (represented with a black circle).
The time in the horizontal axis does not start from the zero count. This is due to the fact that each timestamp is retrieved in seconds since the start of the scene. However, the data is still valid since the data is only gathered during the experiment state.
In order to extract the data from an experiment and plot the corresponding chart (as seen in appendix A), it is required to manually type the file name of the data file in a MatLab script, for example experimentAnalysis("experiment_1.xml").
5.3 Analysis of the Experimental Data
The aim of this thesis is to investigate to what degree a system could unobtrusively, perhaps even subliminally, guide attention of a user by directing their gaze from the current point to a selected point in the environment.
In order to objectively investigate if the aim could have been achieved the empirical data generated and obtained by experiments conducted under controlled conditions is analysed quantitatively.
Hits and non-hits/misses as well as the observation or ignore of targets cued are quantified by examining the data recorded and visualized in the experimental charts (see appendix A).
5.3.1 Quantification of Cued Target Hits
The number of times a cued target is hit is quantified by examining the data recorded and visualized in the experimental charts (see appendix A). A cued target is counted as hit if there is a correlation between target cued (grey bar) and target hit (black *), otherwise it is counted as a non-hit or miss. The total hit and non-hit/miss counts as well as cued target hit-rate percentages are presented in the table and chart (see figure 5.8) below.
Cued Target Hit Non-hit or Miss Cue Hit-rate
Cue 1 10 20 33.33% Cue 2 8 22 26.67% Cue 3 12 18 40.00% Cue 4 6 24 20.00% Cue 5 11 19 36.67% Cue 6 9 21 30.00% Cue 7 12 18 40.00% Cue 8 9 21 30.00% Cue 9 9 21 30.00% Cue 10 11 19 36.67% Cue 11 6 24 20.00% Cue 12 11 19 36.67% Totals 114 246 31.67% average
Stacked bar graph over hit and non-hit/missed target cues quantified for all 30 experiments
9.50 33.33% 31.67% 26.67% 40.00% 20.00% 36.67% 30.00% 40.00% 30.00% 30.00% 36.67% 20.00% 36.67% 10 8 12 6 11 9 12 9 9 11 6 11 1 2 3 4 5 6 7 8 9 10 11 12 Target cues 0 5 10 15 20 25 30 Ex periment s
Hit rate for cued target Non-hits or misses Hit average
Figure 5.8: Stacked bar graph over hit and non-hit/missed target cues quantified for all 30 experiments.
5.3.2 Quantification of Cued Target Observations
The number of times a cued target is observed is quantified by examining the data recorded and visualized in the experimental charts (see appendix A). A cued target is counted as observed if there is a correlation between target cued (grey bar) and target observed (red bar), otherwise it is counted as ignored. The total observed and ignore counts as well as cued target observe-rate percentages are presented in the table and chart (see figure 5.9) below.
Target Observed Target Ignored Observe Rate
Cue 1 10 20 33.33% Cue 2 5 25 16.67% Cue 3 11 19 36.67% Cue 4 5 25 16.67% Cue 5 9 21 30.00% Cue 6 6 24 20.00% Cue 7 10 20 33.33% Cue 8 7 23 23.33% Cue 9 8 22 26.67% Cue 10 5 25 16.67% Cue 11 4 26 13.33% Cue 12 10 20 33.33% Totals 114 246 25.00% average
Stacked bar graph over observed and ignored target cues quantified for all 30 experiments
7.50 25.00% 33.33% 16.67% 36.67% 16.67% 30.00% 20.00% 33.33% 23.33% 26.67% 16.67% 13.33% 33.33% 10 5 11 5 9 6 10 7 8 5 4 10 1 2 3 4 5 6 7 8 9 10 11 12 Target cues 0 5 10 15 20 25 30 Ex periment s
Observe rate for cued target Cued target ignored Observe average
Figure 5.9: Stacked bar graph over observed and ignored target cues quantified for all 30 experiments.
5.3.3 Quantification of Hit Intent
An observed hit (intended hit) is counted if there is a correlation between target observed (red bar) and target hit (black *) in the experimental charts (see appendix A), otherwise it is counted as an unobserved hit or miss (black +). The total hit counts as well as observed target hit-rate percentages are presented in the table and chart (see figure 5.10) below.
Observed hit Unobserved hit Missed Obs. hit-rate
Arrow 1 25 1 4 83.33% Arrow 2 28 - 2 93.33% Arrow 3 29 - 1 96.67% Arrow 4 26 2 2 86.67% Arrow 5 28 2 - 93.33% Arrow 6 26 2 2 86.67% Arrow 7 27 2 1 90.00% Arrow 8 28 1 1 93.33% Arrow 9 28 - 2 93.33% Arrow 10 29 1 - 96.67% Arrow 11 29 1 - 96.67% Arrow 12 28 1 1 93.33% Arrow 13 27 2 1 90.00% Arrow 14 27 3 - 90.00% Arrow 15 29 1 - 96.67% Arrow 16 30 - - 100.00% Arrow 17 27 3 - 90.00% Arrow 18 26 4 - 86.67% Arrow 19 24 6 - 0.00% Arrow 20 24 6 - 0.00% Arrow 21 27 3 - 90.00% Arrow 22 24 6 - 80.00% Arrow 23 24 6 - 80.00% Arrow 24 25 5 - 83.33% Totals 645 58 17 89.58% average
Stacked bar graph over arrows fired quantified for all 30 experiments 26.88 89.58% 83.33% 93.33% 96.67% 86.67% 93.33% 86.67% 90.00% 93.33% 93.33% 96.67% 96.67% 93.33% 90.00% 90.00% 96.67% 100.00% 90.00% 86.67% 80.00% 80.00% 90.00% 80.00% 80.00% 83.33% 25 28 29 26 28 26 27 28 28 29 29 28 27 27 29 30 27 26 24 24 27 24 24 25 1 2 3 4 5 6 7 8 9 10 11 12 13 14 15 16 17 18 19 20 21 22 23 24 Arrows fired 0 5 10 15 20 25 30 Ex periment s
Observed target hit rate Unobserved target hit rate Missed target rate Observed target hit average:
![Figure 4.1: Five stages of the Systems Development Research Methodology [31].](https://thumb-eu.123doks.com/thumbv2/5dokorg/3994984.79639/22.892.122.773.593.691/figure-stages-systems-development-research-methodology.webp)