LEON BARKHO
Nordic Television at
the Turn of the Century
An Overview of Broadcasters and Audiences
JIBS
Working Paper Series
No. 2005-1
NORDIC TELEVISION AT
THE TURN OF THE CENTURY:
An Overview of Broadcasters and Audiences
Leon Barkho
Media Management and Transformation Centre
Jönköping International Business School
Jönköping International Business School P.O. Box 1026
SE-551 11 Jönköping, Sweden Phone: +46 36 15 77 00 www.jibs.se
CONTENTS
FOREWORD... v
1. The Nordic Region ... 7
2. Researching Television Markets ... 9
2.1 Typology... 9
2.2 Geographical Coverage... 10
2.3 Transmission ... 13
2.4 Status... 16
3. The Nordic Television Broadcasting Market... 18
4. Market Shares of Major National Channels... 21
5. Equipment... 24
6. Television Viewing... 27
7. Digitalization... 30
8. Conclusions ... 33
FOREWORD
This working paper explores the basic contexts and structures of television markets in the Nordic nations. It is part of several related projects being undertaken by research fellows and associates that are investigating television policy, market developments, and effects at the Media Management and Transformation Centre, Jönköping International Business School, Jönköping University, Sweden.
This paper has been written by Leon Barkho, a research assistant at the centre, and was made possible through the financial support of the Carl-Olof and Jenz Hamrin Foundation to the Media Management and Transformation Centre.
This report provides an overview of the types, number, and location of domestic and foreign television channels in the region, means of channel distribution including data on cable and satellite use, channel availability, revenues of broadcasters, audience shares, viewing data and other relevant information that will help readers understand the contemporary environment of Nordic television.
Robert G. Picard Hamrin Professor of Media Economics Director, Media Management and Transformation Centre
1. The Nordic Region
The Nordic television involves that of 5 states: Finland, Denmark, Norway, Sweden and Iceland. Geographically, the area stretches from Inari in Finland—one of the world’s most northern and geographically remote countries—to continental Europe, via Denmark’s 68-km-long boundary with Germany. Lying somewhere in between are Norway and Sweden, occupying the western and eastern halves of the Scandinavian Peninsula. Between the Greenland Sea and the North Atlantic Ocean is the island of Iceland.
The area is 1,257,309 sq km, with Sweden being the largest of the five (449,964 sq km) and Denmark the smallest (43,094 sq km). It is slightly less than 2.5 times the size of California and slightly more than the size of Columbia in the United States. It is more than twice the size of Spain, more than three times the size of Germany, and about four times that of the United Kingdom.
On this massive land live only 24,468,248 people, with 8,986,400 in Sweden, 279,384 in Iceland and the rest almost evenly distributed among the other three countries. The number of the inhabitants is two-thirds that of California—the most populous state in the U.S.—and less than one third of the population of the United Kingdom.
The five countries are internationally known for their prosperity, enviable living standards and extensive welfare benefits. In their drive to sustain economic affluence, they continuously struggle to maintain and improve a competitive edge for their heavily export-oriented economies.
As a result their GDP per capita is among the highest in the world. In 2003 and at purchasing power parity it averaged $28,200 with Norway ($37,700) ranking the third in the world after Luxembourg and the United States, Denmark the eighth, Finland the 22nd and Sweden the 25th (The World Factbook, 2004). Their 2003 GDP amounted to $725.95
billion, approximately one third of that of France or the United Kingdom, almost twice that of the Netherlands, and nearly double that of Spain.
The countries communications systems are modern in all respects. They possess one of the most advanced telecommunications networks in the world and are home to some of the world’s finest telecommunications companies, including Ericsson and Nokia.
But the countries have pursued different paths to economic superiority. While Denmark, Finland and Iceland have largely free market economies, Sweden and Norway feature a combination of free and mixed market activity.
The countries have followed a cautious attitude towards European integration. Norway and Iceland are still outside the European Union and of the three Nordic EU members only Finland has opted to switch its national currency to the euro (€). Despite modern technological advances, particularly in transport and communication, they cannot be said to have fully integrated into the European mainstream.
The features bringing these countries together are more easily discernible than those that may separate them. The homogeneity is perhaps more apparent at cultural, linguistic and ethnic levels. Historically, each country was once either wholly or partially part of the other and three of them (Sweden, Norway and Denmark) share a common Viking legacy. However, the countries do not share the same correspondence when it comes to their audiovisual markets, notably television broadcasting. As we shall see, the television landscape in the five Nordic states is varied and lacks uniformity. Their response to new media regarding television is not compatible with living standards or economic prosperity. Perhaps this explains why foreign media giants whether in Europe or America have hitherto shunned the Nordic broadcasting markets which otherwise have been very attractive to other foreign economic activities. The Nordic region is rich in industries featuring high on the world rank order, but its audiovisual market, dominated by the public service sector, lacks companies with the same stature. No Nordic firm makes it into the world’s rank order of top 50 leading audiovisual firms (European Audiovisual Observatory Yearbook 2003, hereafter referred to as OBS).
2. Researching Television Markets
2.1 Typology
The literature on television and related activities is voluminous. There are several bodies, both public and private, which provide statistics on various aspects of television: viewing, ownership, transmission, genres, etc (see for example, OBS, OECD, Carat Crystal, European Commission, EPRA, and Persky among others). But, strangely enough, “no accurate statistics on the supply of channels or programming in the European Union are available” (Picard, 2001) and that absence extends to the Nordic states.
One reason for the lack of a reliable count regarding the number and type of television channels available in any particular country stems mainly from the fact that various countries have their own definitions of the television sector and a number of organizations use different counts and models of analysis.
Of the audiovisual market, and “statistically speaking, the television sector is the most difficult to define,” (OBS, 1995). The absence of standard definitions has led to differences in the way various sources count the number of television channels and stations available. For example what is considered a local channel in one country might be regarded as a regional one in another.
The advent of digital technology has multiplied the number of television channels available and has already forced the European Audiovisual Observatory, which provides one of the world’s largest and most reliable television-related statistics, to drop the publication of its annual and rather comprehensive lists of television channels by country in 2002.
The counts provided here should not be viewed as thorough and void of any inaccuracies. Though mainly drawn from the OBS (1995-2003), they also rely on counts Persky (2004), Carat (2003) and Harrie (2003) provide. The increasingly competitive nature of the television systems in Europe, particularly with the advance of digital technology, makes it hard for one single body to present a comprehensive picture of the television landscape even when the matter concerns what is supposed to be a simple count of the number and type of channels within a restricted region like the Nordic countries.
A reliable count must be careful to take into consideration the differences between channels and stations, broadcasting companies and channels, packages and program services. Other points to consider include how to categorize the channels available in a country from a geographical point of view amid a continuously changing situation with regard to the number of companies, broadcasting facilities, transmissions and other related activities.
Tables 1 through 4 present a count of the number of television channels in Nordic countries. They cover the channels that originate in these countries along with foreign services geared to meet the specific needs of their viewers. The categorization used in compiling them follows that of the OBS (2002: 10–11). A record of the number of channels
available may hinge on the aspects of television market possibilities and geographical location: national, regional, local, technological, regulatory, financial, programs, audience, viewing, turnover, advertising, genre, etc. Of these, this study focuses on the number and type of channels in the light of geographical location and gives a brief account of television viewing, ownership, market share, genres, transmission and new technology.
One might think that the number of channels in a country should remain constant over at least a few years and it should be easy to know how many channels exist in one particular country over a particular period of time. If that was possible over a decade ago, it is increasingly becoming more and more difficult on the threshold of the twenty-first century.
Today channels change names, ownership, means of transmission, location, address or country from which they beam. They easily change status, programming, shareholders, and legal status or simply disappear. The television landscape is extremely heterogeneous and complex. For example, the OBS had to forego the publication of the names of satellite channels available to European viewers simply because it became almost impossible to keep a track of them.
2.2 Geographical Coverage
The television sector in a country can be divided into national channels, regional channels and local channels. The categorization is purely geographical and has nothing to do with the number of viewers. A regional channel in a country may have more viewers than those watching a national channel in another.
But the categorization is not as simple as it looks, particularly when it comes to the distinction between a local and regional channel. In Nordic countries many regional channels are windows of their national counterparts. Many local channels are also windows or stations of national or regional ones. In this paper local stations and channels are grouped together.
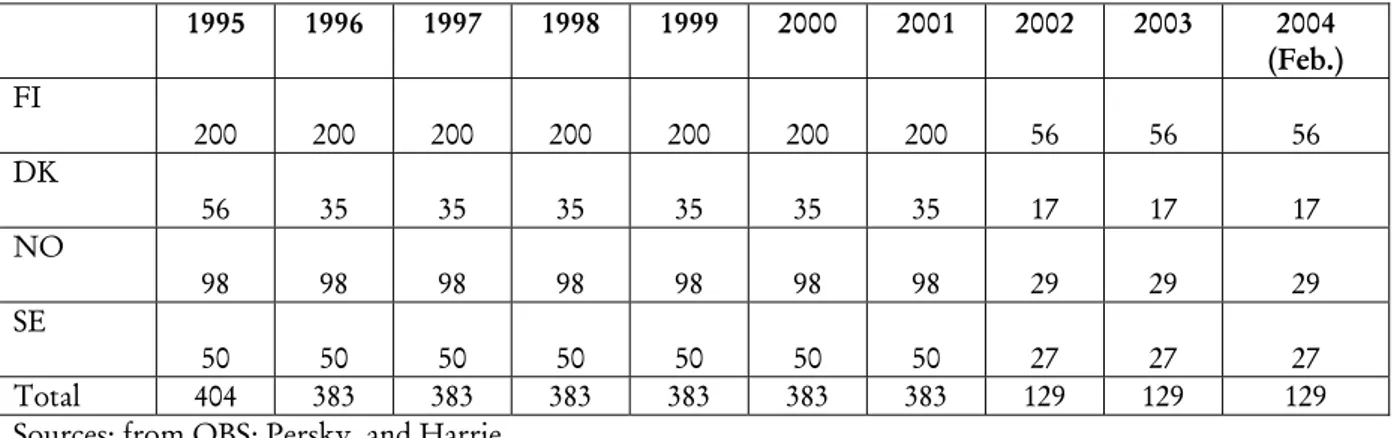
As Table 1 indicates the countries enter the twenty-first century with 129 local channels and stations. Finland, with a population less than that of Sweden and Norway, has the largest number. Finland’s local television landscape was apparently restructured with the number of local channels slipping to 56 in 2002 from nearly 200. Iceland, the smallest Nordic state reports no local channel. A 2002 count reveals a drastic decline in local channel numbers in the other four countries: Sweden’s fall to 27 from about 50, Norway’s to 29 from 98 and Denmark’s to 17 from 35. It is hard to account for the sharp fall in the number of local stations in the years following 2001. It may be due to a change in counting procedures but most probably it is the result of large-scale restructuring of local television landscape with many local cable stations closing down for lack of resources.
Table 1. Number of Local Television Stations and Channels in Nordic States 1995 1996 1997 1998 1999 2000 2001 2002 2003 2004 (Feb.) FI 200 200 200 200 200 200 200 56 56 56 DK 56 35 35 35 35 35 35 17 17 17 NO 98 98 98 98 98 98 98 29 29 29 SE 50 50 50 50 50 50 50 27 27 27 Total 404 383 383 383 383 383 383 129 129 129 Sources: from OBS; Persky, and Harrie
However, and despite the slash in numbers, when taken together, the countries still have more local channels and stations than the United Kingdom (24 in 2003) and France (111 in 2003). The Nordic region is Europe’s fifth in the number of local channels after Spain (897 in 2004), Italy (250), the Netherlands (200), Russia (843) and Germany (149) (c.f. OBS, 1995-2003, and Persky, 2004). The figures and ranking indicate that local channel and station numbers usually do not correspond to the size of a country’s population or area. While the number of channels and stations available locally in the four countries plunges, there is a marked increase in the number of channels available nationwide (Table 2). At the turn of the century, the number of national channels increases to 55 from 45, and to 64 in February 2004, a rise of 42%. Together the region ranks the fifth in Europe in the number of nationwide channels available in 2004. It has more national channels than Poland (33) and Portugal (23) put together. The surge in nation-wide channels in Nordic countries, particularly Sweden can be attributed to the profusion of cable television and television packages delivered digitally in these countries.
Table 2. Number of National Television Channels in Nordic Countries
1995 1996 1997 1998 1999 2000 2001 2002 2003 2004 (Feb.) FI 5 5 5 9 10 10 8 13 11 11 DK 2 5 6 8 9 8 9 11 10 10 NO 5 5 6 8 9 9 9 7 9 9 SE 12 15 15 13 13 24 25 22 29 29 IS 2 3 3 3 4 4 4 5 5 5 Total 26 33 35 41 45 55 55 58 64 64 Sources: OBS, Persky, and Harrie
Sweden sees the largest profusion of nationwide channels which climb to 24 in 2000 from 13 earlier. The country boosts the 84% growth it achieves in 2000 to 123% in 2004 with the number of nationwide channels hitting 29. Sweden accounts for nearly half of the national channels available in the Nordic region. The number of national channels also climbs in the other countries albeit at lower rates. In Finland, the number increases to 10 in 2000 from 5 in 1995; to 11 from 2 in Denmark; to 9 from 5 in Norway and to 5 from 2 in Iceland.
Table 3 shows that the Nordic market, though dominated by national public television, attracts many foreign channels with programs and services meant to meet the needs of Nordic viewers. In fact there are more foreign channels targeting the Nordic market than national ones. Currently, Nordic viewers can have access to 63 foreign channels with programs dubbed or subtitled in Nordic languages while they can only tune to 59 national channels. The table illustrates that the number of foreign channels targeting a country does not correspond to the number of people in that country. Sweden, with the largest population is targeted by 10 foreign channels, while Denmark is the target of 25.
Table 3. Foreign Channels Targeting Nordic Markets
1995 1996 1997 1998 1999 2000 2001 2002 2003 2004 (Feb) FI 1 7 1 1 1 1 3 10 11 11 DK 2 5 7 3 3 4 4 19 23 25 NO 8 5 3 6 6 6 14 17 17 SE 1 4 5 10 11 9 7 11 10 10 Total 4 24 18 17 21 20 20 54 61 63 Sources: OBS and Persky
Within a European perspective, there are currently more foreign channels targeting the Nordic region than any other country in Europe. Most of the channels being beamed to these countries are carried via satellite and/or cable with programs and commercials prepared to meet Nordic viewers’ needs. The percentage of Nordic households connected to cable is among the highest in Europe (Table 5). Meanwhile, the contribution of subscription fees in these countries—which often are collected as part of rent - to total television revenue has been growing very fast (OECD, 2001). Moreover, the fees—at about $20 (U.S.) per month—are easily affordable by households in a region reputed for its affluence. Perhaps this partly explains why so many foreign channels are targeting these countries.
While the Nordic viewers are targeted by 63 foreign channels, the countries, apart from Sweden, have very little to offer viewers outside the region. According to Perksy (2004), Sweden currently beams 38 channels to the outside world. Most of these channels are privately owned and are geared to meet the needs of viewers in Nordic countries and a few European states like Russia and Poland. Norway has nothing on its foreign market
television menu and each of Finland, Denmark and Iceland has one channel whose programs are specifically made to meet needs of foreign audiences.
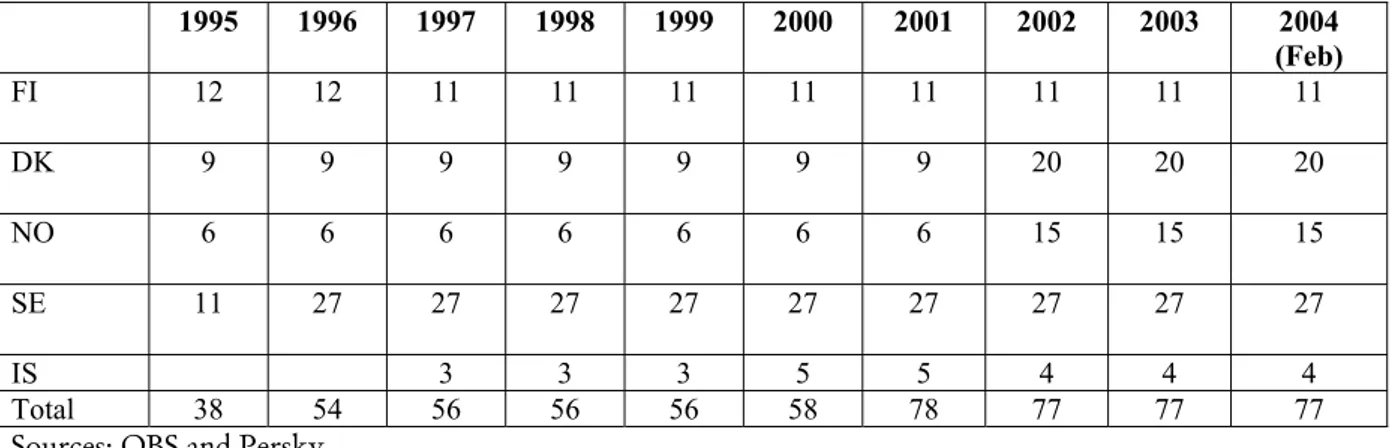
The number of regional channels in the Nordic countries almost doubles between 1995 and 2004 (Table 4). Of the 77 regional channels available in the region in early 2004, 27 of them are in Sweden, 20 in Denmark, 15 in Norway, 11 in Finland and 4 in Iceland. Taken together, the countries have more regional channels than any other country in Europe (c.f. OBS, 2003).
Table 4. Number of Regional Channels (Mainly Windows on National Television Channels) in Nordic States 1995 1996 1997 1998 1999 2000 2001 2002 2003 2004 (Feb) FI 12 12 11 11 11 11 11 11 11 11 DK 9 9 9 9 9 9 9 20 20 20 NO 6 6 6 6 6 6 6 15 15 15 SE 11 27 27 27 27 27 27 27 27 27 IS 3 3 3 5 5 4 4 4 Total 38 54 56 56 56 58 78 77 77 77 Sources: OBS and Persky
Despite their openness and liberal tendencies, the countries have very little to offer their migrant populations. Sweden, with a sizeable foreign community of 1.67 per 1,000 population has nothing for them on its television menu. There is also nothing for the foreign community of Norway, with a net emigration rate slightly higher than Sweden (1.74 per 1,000 population), and Finland, with the lowest rate (0.95% per 1,000 population). Denmark, with the largest migrant community in proportion to population (2.48% per 1,000) has only one commercial satellite channel geared to serve the exiled Kurds in Europe. Denmark is also the only Nordic state with two autonomous territory and community television channels, one for Färoe Islands and the other for Greenland.
2.3 Transmission
Another basic way of categorizing television channels is by classifying them according to how they broadcast their programs. There are different ways in which channels can deliver or diffuse their programs: cable (C), terrestrial (T), satellite (S) or digital (D).
Previously, and perhaps until the mid 1980s, it was easy to track the means of transmission a channel used. However, it is now increasingly difficult to provide a reliable statistical synthesis of the way of broadcasting as it has become more commonplace for a channel to employ two or more of the broadcasting methods mentioned above.
Satellite and cable transmission were perhaps the most significant new media phenomenon in the history of television after the emergence of the VCR in the 1980s. But while the Nordic states, excluding Iceland, have made big leaps in utilizing cable, the percentage of
houses with direct satellite transmission is still low in comparison (Tables 5, 6 and 7). While the number of households connected to cable soars to nearly 50% at the turn of the century, the percentage of households with direct satellite transmission stands at about 23%. But within a European perspective, the Nordic region comes high in the rank order of states with the largest percentages of cable and satellite television.
But as Tables 5, 6, and 7 indicate there is large variation among the region’s countries. For example, while only 13% of households in Finland had access to direct satellite television in 2002, the percentage surges to 30 in Denmark, 26 in Norway and 25 in Sweden. There is also variation regarding cable connection. In 1997, Sweden had the largest number of cable connected households (5.5%), followed by Denmark (42.5%), Norway (39.2%) and Finland (37.5%). But Denmark superseded Sweden in 2002 with about five percentage points and Finland exceeded Norway with one point.
Iceland has the lowest percentages of houses connected to cable. Only 5% of households in the country had access to cable in 2001 although more than 35% of them were passed by it in the same year.
Table 5. Households Connected to Cable, in %
1997 1998 1999 2000 2001 2002 DK 42.5 57.9 57.7 58.4 59.2 60.4 FI 37.5 40.1 40.63 41.2 44.0 45.3 NO 39.2 42.1 42.4 43.8 44.2 43.8 SE 50.4 51.0 53.0 52.0 53.2 55.8 IS 2.3 3.5 5.1 5.0 Source: OBS
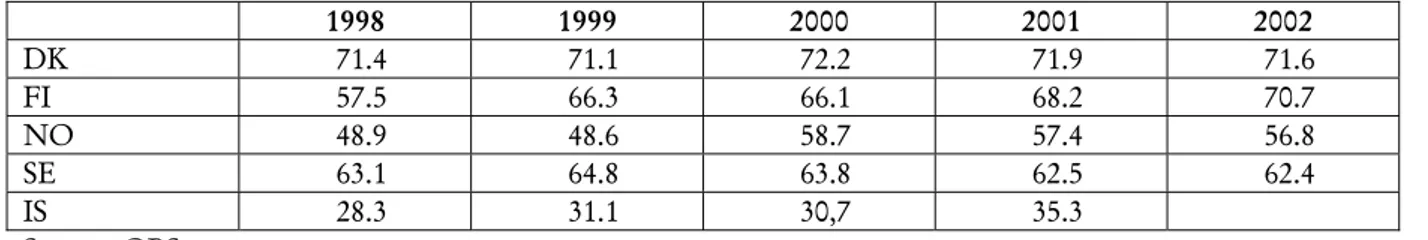
Table 6. Households Passed by Cable, in %
1998 1999 2000 2001 2002 DK 71.4 71.1 72.2 71.9 71.6 FI 57.5 66.3 66.1 68.2 70.7 NO 48.9 48.6 58.7 57.4 56.8 SE 63.1 64.8 63.8 62.5 62.4 IS 28.3 31.1 30,7 35.3 Source: OBS
Table 7. Number of Satellite Television Households, in Thousands
1998 1999 2000 2001 2002 DK 550 621 614 671 727 FI 170 222 214 310 314 NO 380 463 418 461 504 SE 690 925 819 951 1 083 Source: OBS
However, the connection to cable, unlike satellite, does not mean the households have access to as many channels as possible. Nordic viewers’ cable television menu, for example, had an average of 13 channels in 2001. When the domestic cable channels are excluded, there would be a few foreign channels available to viewers with cable television.
Nordic viewers’ counterparts in many other European countries have a far higher average of channels on their cable television menu. In the Netherlands and Belgium the average number of channels available to viewers with cable television is 30. The average is 18 in the U.K. and 20 in France. It is to be noted that Norwegian cable viewers have a much wider range of programs than their Nordic counterparts. The average number of channels carried by cable in Norway was 18 in 2001. Sweden had 10, Finland 11 and Denmark 12 in the same year (Table 8).
In the meantime, Table 6 indicates that Nordic countries have in place the infrastructure to hike their current rates of households connected to cable television.
The countries report a much higher rate of houses passed by cable than those connected. An average of more than 65% of households in the Nordic countries, excluding Iceland, is passed by cable. The percentage is way below that of the U.S., Belgium and the Netherlands where connection is available to more than 98% of households, but it is still more than that reported by the U.K. (48.5%), Germany (59.3%) and France (38%) (OBS, 2003).
Table: 8. Average Number of Channels Carried via Cable
1995 1996 1997 1998 1999 2000 2001 FI 18 18 18 11 11 11 11 DK 20 20 20 20 15 15 12 NO 18 18 18 18 18 18 18 SE 11 11 11 11 11 11 10 Source: OBS
Despite having some of the world’s most advanced telecommunications networks and companies, the countries (apart from Sweden) failed to catch up with the digital revolution by the turn of the century. As Table 9 shows, national television stations in Norway, Denmark and Finland heavily relied on traditional means of transmission (S, T and C) for broadcasting in 1999. Sweden was among the first European states to introduce digital transmission and is the region’s most advanced in digital infrastructure (EPRA, 2004). Meantime, the OBS data shows that by the turn of the century Iceland was the only Nordic state to have three of its nation-wide channels distributed via the so-called Multichannel Multipoint Distribution Service or MMDS in connection with either TC or T only. The other nationally televised channel, included in Table 9 was broadcast terrestrially and through cable in 200 (OBS, 2003: 35)
Table 9. Delivery and Diffusion Landscape of National Channels in Nordic States at the Turn of the Century 1995 2000 SC TSC S TC TS C SC TSC S TC TS C n.a. TDTTC DTT DTTSC TDTTSC DK 2 3 1 3 1 FI 4 1 3 1 2 4 NO 2 2 1 2 3 4 SE 5 3 1 3 2 1 3 1 2 1 6 7 2 IS 2 1
T: terrestrial C: cable DTT: Digital Terrestrial Television Source: OBS
2.4 Status
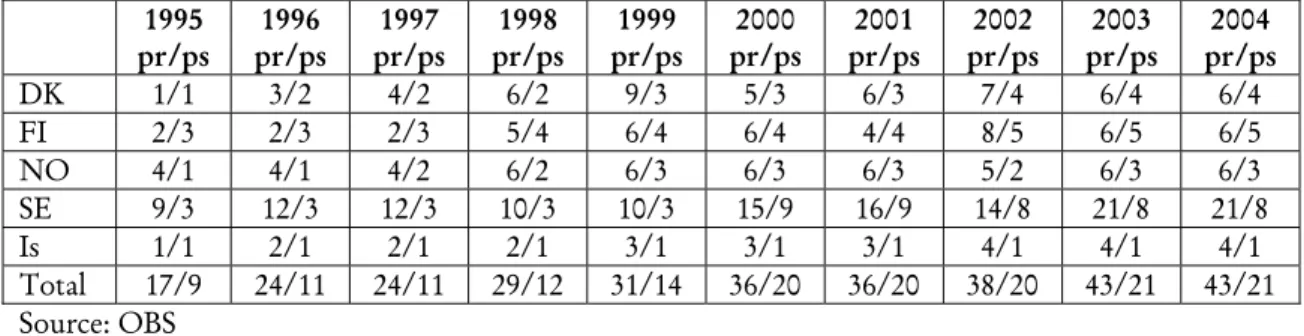
The final categorization in this study is whether a channel is run as public (Ps) or private (Pr) service. Table 2 shows that the countries see a dramatic growth in the number of nationwide channels. But it has to be noted that the expansion is confined to private rather than public service television. For example, the number of national private channels in Denmark climbs to 6 in 2004 from one in 1995. Finland’s national private channels increase to 6 from 2 in the same period. Iceland’s national private channels rise to 4 from 1 in 1995. In Sweden which traditionally has had more national private channels than its other Nordic counterparts, the number shoots to 21 from 9. Sweden’s private market growth can be attributed to its early attempts at digitalization. However, while private television entrepreneurs in Nordic countries succeed in increasing the number of their channels, they fail to claw their way out from their persistently low market share rate, which sees little change as we enter the 21st century (Table 10).
The number of public service channels in the Nordic region is extremely high by European standards. By early 2004, the region had 21 public service channels. The United Kingdom with a population nearly three times that of the region had a similar number of public service channels while Italy had 18, Germany 14 and France only 8, as many as Sweden. We almost have an opposite picture when viewing and comparing nationwide private channel landscape. While the Nordic region had 43 national private channels in early 2004, there were 87 such channels in Germany, 119 in France, 205 in the United Kingdom, and 102 in Italy.
The countries view their public television sector as part of the national heritage and a barrier to fend off the onslaught of private foreign television where many of the Nordic taboos with regard to broadcasting and advertising are broken. As part of national cultural defense, they have been reluctant to break up the monopoly of their public service broadcasting. Denmark was the first and only Nordic country to open up its public television sector, albeit with conditions, in the late 1980s. But the government’s decision to break up DR’s monopoly was taken “to protect Danes from foreign cultural influence” and in response to the emergence of Rupert Murdoch’s Sky television which did not only shock the Danes but also their politicians (Kelly et al., 2000).
Table 10. Status of National Channels in Nordic Countries (Pr: private, Ps: public). 1995 pr/ps pr/ps 1996 pr/ps 1997 pr/ps 1998 pr/ps 1999 pr/ps 2000 pr/ps 2001 pr/ps 2002 pr/ps 2003 pr/ps 2004 DK 1/1 3/2 4/2 6/2 9/3 5/3 6/3 7/4 6/4 6/4 FI 2/3 2/3 2/3 5/4 6/4 6/4 4/4 8/5 6/5 6/5 NO 4/1 4/1 4/2 6/2 6/3 6/3 6/3 5/2 6/3 6/3 SE 9/3 12/3 12/3 10/3 10/3 15/9 16/9 14/8 21/8 21/8 Is 1/1 2/1 2/1 2/1 3/1 3/1 3/1 4/1 4/1 4/1 Total 17/9 24/11 24/11 29/12 31/14 36/20 36/20 38/20 43/21 43/21 Source: OBS
3. The Nordic Television Broadcasting Market
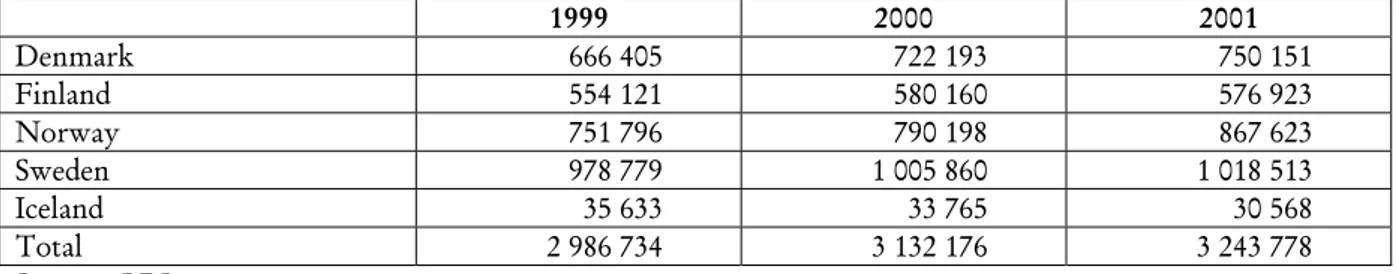
The Nordic television broadcasting market generated revenue of more than 3 billion euros in 2001 (Table 11). The market’s annual growth rate over the three years since 1999 has been about 4%. It is less than the 5.4% reported for the Organization of Economic Cooperation and Development, of which the four states are members (OECD, 2001).
Table 11. Operating Revenue of Principal Television Companies in Nordic States, €thousand
1999 2000 2001 Denmark 666 405 722 193 750 151 Finland 554 121 580 160 576 923 Norway 751 796 790 198 867 623 Sweden 978 779 1 005 860 1 018 513 Iceland 35 633 33 765 30 568 Total 2 986 734 3 132 176 3 243 778 Source: OBS
The revenue earned by Sweden accounts for almost one third of what the Nordic television broadcasting market earned in 2001. Generally the companies increase their market share between 1999 and 2001. Only Iceland reports a drop in the operating revenues of its public service RUV-Rikisutvarpid.1 But when comparing revenue between 2000 and 2001, only
three countries manage to achieve a modest increase while Finland and Iceland see a slight reduction in revenue.
Total public income, mainly license fees, remains a major source of revenue for public service television. For Sweden’s SVT, it accounts for more than 90% over the three years since 2000. Public income contributes about 88% of revenue for the YLE Group in Finland, and about 95% for Norway’s NRK over three years since 1999.
Denmark is a special case as it is the first Nordic state to partially liberalize its public television sector. While the public funding contributes about 90% of the state-run DR, it only accounts for about 33% for the mixed-sector TV2. It is worth noting that while DR’s public funding increases slightly over the three years to 2001, TV2’s advertising income slips to 62.6% from 67.
The financial performance of private television companies financed by advertising varies in the region. While the companies register a remarkable 28% rise in revenues in Denmark between 2000 and 2001, they report a staggering slump of 17% in Sweden and 10% in Finland (OBS, 2003).
1The statistics at the author’s disposal do not provide the operating revenue of Iceland’s other major private
television channel, Islenska Utvarpsfelagid HF as it enters the twenty-first century. But anyway they would be too small to affect the Nordic television financial landscape. The channel was reported to have generated
While advertising is still one of the main sources of revenue for the television industry in the United States and several European countries, it is of much less importance as a source of income in the Nordic states. Sweden’s private television firms’ total revenue from advertising was €207.8 million in 2001 while public funding amounted to 382.8 million. Denmark’s television advertising revenue of private television firms was €28.6 million
vis-à-vis €436.5 million from license fees. Finland’s total public income was €346.3 million
compared to €194.8 million from private television advertising (OBS, 2003). While advertising contributed 55% of total revenue generated by OECD member states in 1999, its contribution was 27.36%, 38.80%, 28.63% and 35.43% for Denmark, Finland, Norway and Sweden respectively (OECD, 2001)
Despite the growing competition among the broadcasters and the increasing number of national television channels available to Nordic viewers, advertising fails to increase its share in the industry’s total revenue. To boost the share of advertising in the industry’s revenue, Nordic countries will have to liberalize their public broadcasting service which still seizes the attention of the majority of viewers (Table 12).
The new nationwide commercial channels, despite their aggressive launch, have not been able to chip away at the power of public service broadcasters. The increase in the number of channels and the greater choice of programs households have access to today have apparently failed to dent Nordic public broadcast services. One would have thought that the increase in the number of channels and programs would increase the attraction of television to advertising. But it seems it is hard to influence Nordic viewing habits and as Table 2 shows the surge in channels and programs does not necessarily lead to an increase in the amount of time Nordic viewers spend watching television.
As it stands, Nordic television industry is not poised to increase the share of advertising revenue due to a number of factors. Since all households in Nordic countries have at least one television set, it is difficult to foresee a marked switch in audience market share from the current levels (Table 22). The Nordic EU members—Finland, Sweden and Denmark— have to abide by the EC Television Without Frontiers Directive, effectively limiting growth in amount of advertising and allowing only the prices to increase on the advertising time limit that is reached. Globally, television viewing is under attack from new media particularly the Internet and the Nordic states top the world rank list of Internet hosts and Internet users. It remains to be seen whether the launch of digital television, with its projected surge in the number of channels, broadcast hours and wide convergence of the transmission network, will alter viewing levels and advertising revenues.
Even in the United States, where it is hard to imagine life without the commercial break, advertising is reported to have reached “a tipping point” with consumers becoming the most important source of income and “increasingly willing to pay for information and entertainment to match specific interests” (Financial Times, 2004: 12). The paper, quoting Veronis Suhler Stevenson, a media merchant bank, says U.S. consumers now prefer to use media services without being distracted by advertising. As evidence of the new trend, the paper mentions the rising popularity of digital video recorders with the ability to skip past commercial breaks.
According to OECD (2001: 120), subscription fees from pay television and cable are becoming “the fastest growing source of revenue.” Within the OECD, they accounted for almost one-third of revenue, more than double the contribution of public funding, including license fees. In Sweden, they rose to 32.86% of total market revenue in 1999 from 19.91% in 1997. In Denmark they climbed to 26.08% from 24.44% and to 14.26% from 12.15% in Finland over the same period.
At the turn of the century, Nordic public service broadcasters continued to retain a domineering position in the industry and that role is unlikely to be challenged in the foreseeable future. But it should be noted that public broadcasters no longer hold the same position in many European countries where their role as monopoly broadcasters was challenged as early as the mid 1980s. But in the Nordic countries they continue to seize a sizeable share of viewing in a highly competitive market.
4. Market Shares of Major National Channels
Market share is a central issue for the television industry since it directly affects advertising revenue for commercial broadcasters and is taken as the basic indicator for the success of their public service counterparts. Together, major public and private nationwide channels have the lion’s share of the Nordic television market, leaving a paltry 10% or even less for their foreign rivals. Satellite and digital technology has brought an infinite number of television broadcasts within reach of Nordic viewers, but they have failed to make a dent in the sizeable portion these national channels have carved up for themselves (Tables 12 and 13).
Table 12. Daily and Prime Time Audience Market Shares of Public Service Television
Daily share Prime Time
1998 1999 2000 2001 2002 1998 1999 2000 2001 2002 DK 69 66.8 67.9 65.6 67.3 78 75.1 75.6 76.4 75.6 FI 46 43 42.3 43.3 45.3 47 45 44.3 44.3 44.7 NO 40.5 39.8 40.5 41 42.4 48.1 44 44.9 46.2 49.5 SE 48.2 47.2 43.8 41.9 42.9 56.3 54.5 52.1 50 50 IS - 43 42 42 42 - - - Source: OBS
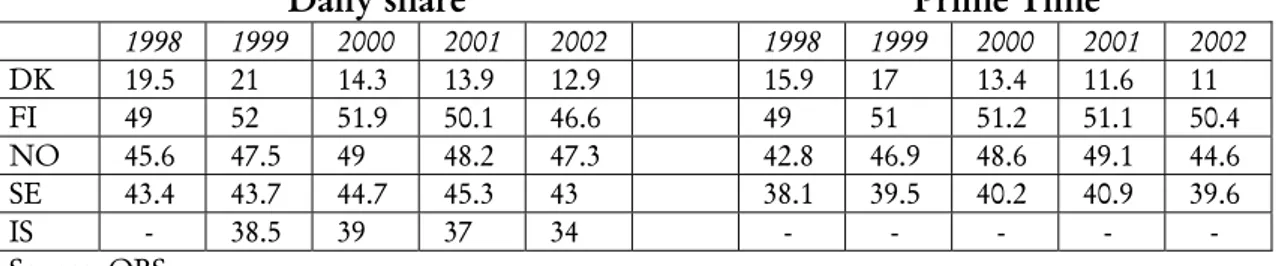
Table 13. Daily and Prime Time Audience Market Shares of Major Private Channels
Daily share Prime Time
1998 1999 2000 2001 2002 1998 1999 2000 2001 2002 DK 19.5 21 14.3 13.9 12.9 15.9 17 13.4 11.6 11 FI 49 52 51.9 50.1 46.6 49 51 51.2 51.1 50.4 NO 45.6 47.5 49 48.2 47.3 42.8 46.9 48.6 49.1 44.6 SE 43.4 43.7 44.7 45.3 43 38.1 39.5 40.2 40.9 39.6 IS - 38.5 39 37 34 - - - Source: OBS
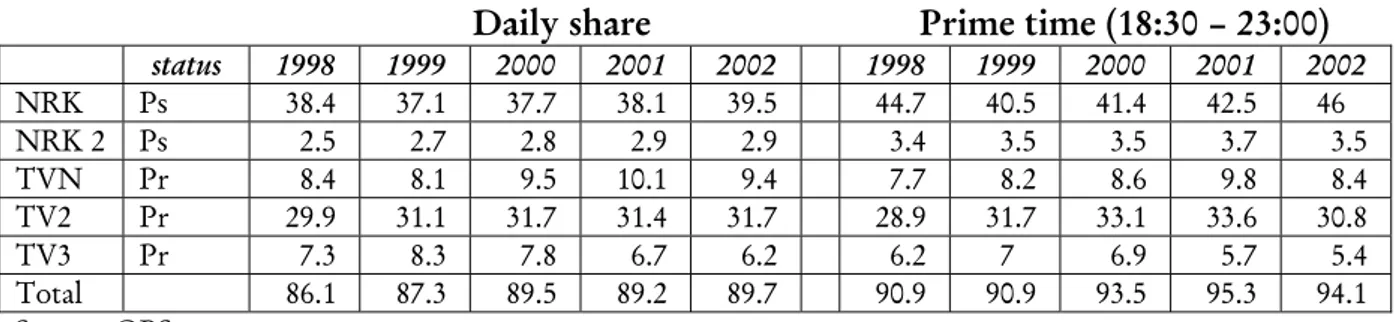
However, the market share these channels have is not constant across the Nordic region. At prime time, the most expensive and coveted period for advertising, both Denmark and Sweden report a loss of about 8% and 5% when comparing 1998 with 2002. In Finland these channels almost maintain their sway over the market for the same period but they strengthen their grip in Norway by seizing additional 2.8%. A rather similar pattern emerges when viewing these channels’ daily share. It drops by nearly 10% for Denmark and 6% for Sweden but registers a 4% rise in Norway and a slight drop in Finland. In Iceland while the daily share of the country’s only public service channel remains constant in the three years to 2002, major private broadcasters lose more than 4% over the same period.
Examining the tables closely, it appears that major national channels in each of Denmark, Finland and Sweden have been gradually losing part of their prime time market share albeit at varying degrees while Norway is gaining. An almost similar trend prevails regarding
daily market share. Denmark, Finland and Sweden appear to be giving away part of their share while Norway is winning.
Focusing on channel status (Tables 12 and 13), Nordic public service channels appear to be slightly loosening their hold on the television broadcast market. Sweden’s public broadcasters’ prime time market share registers a steady and gradual drop in the five years since 1998. It drops to 54.9 in 2002 from 57.3, a slide of more than 12%. The prime time share of public channels in both Denmark and Finland also sees a gradual decline albeit at a lower pace than Sweden’s. Iceland’s remains constant and only Norway’s service broadcasters manage to slightly increase their market share at prime time.
Nordic public broadcasters show rather similar trends regarding their daily market share. Sweden’s public service channels again shed more than 12% of their share from 48.2 in 1988 to 42.9 in 2002. Gradual but lower loss of market share is reported by both Denmark and Finland. Norway again is the only winner (Tables 14, 15, 16, and 17).
Table 14. Market Shares of Major National Channels in Denmark, in %. 4 years +
Daily share Prime time (18:30 – 23:00)
Channel status 1998 1999 2000 2001 2002 1998 1999 2000 2001 2002 DR TV1 Ps 29.4 28.1 28.9 27.6 28.4 34.5 34 34.4 35.5 33.9 DR TV2 Ps 1.6 2.6 2.9 3.3 2.1 3.1 3.4 3.7 4.1 TV2 Ps 38.0 36.1 36.1 34.7 35.2 41.4 38.5 37.8 37.2 37.6 TV Danmark Pr 7.4 7.7 1.9 2.3 2.2 5.1 5.4 2.3 1.9 1.7 TV3 Pr 10.4 10.6 9.1 8.0 7.2 9.1 9.3 8.4 7.1 6.5 TV3+ Pr 1.7 2.7 3.3 3.6 3.5 1.7 2.3 2.7 2.6 2.8 Total 88.5 87.8 82.2 79.5 80.2 93.9 92.1 89 88 86.6 Source: OBS
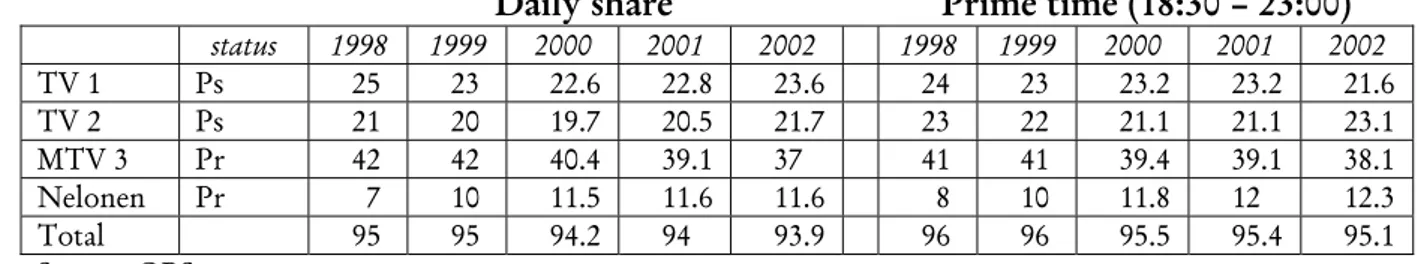
Table 15. Market Shares of Major National Stations in Finland, in %. 10 years +
Daily share Prime time (18:30 – 23:00)
status 1998 1999 2000 2001 2002 1998 1999 2000 2001 2002 TV 1 Ps 25 23 22.6 22.8 23.6 24 23 23.2 23.2 21.6 TV 2 Ps 21 20 19.7 20.5 21.7 23 22 21.1 21.1 23.1 MTV 3 Pr 42 42 40.4 39.1 37 41 41 39.4 39.1 38.1 Nelonen Pr 7 10 11.5 11.6 11.6 8 10 11.8 12 12.3 Total 95 95 94.2 94 93.9 96 96 95.5 95.4 95.1 Source: OBS
Table 16. Market Shares of Major National Television Channels in Norway, in %. 12 years +
Daily share Prime time (18:30 – 23:00)
status 1998 1999 2000 2001 2002 1998 1999 2000 2001 2002 NRK Ps 38.4 37.1 37.7 38.1 39.5 44.7 40.5 41.4 42.5 46 NRK 2 Ps 2.5 2.7 2.8 2.9 2.9 3.4 3.5 3.5 3.7 3.5 TVN Pr 8.4 8.1 9.5 10.1 9.4 7.7 8.2 8.6 9.8 8.4 TV2 Pr 29.9 31.1 31.7 31.4 31.7 28.9 31.7 33.1 33.6 30.8 TV3 Pr 7.3 8.3 7.8 6.7 6.2 6.2 7 6.9 5.7 5.4 Total 86.1 87.3 89.5 89.2 89.7 90.9 90.9 93.5 95.3 94.1 Source: OBS
Table 17. Market Audience Share of Major National Television Channels in Sweden, in %. 3 years +
Daily share Prime time (18:30 – 23:00)
status 1998 1999 2000 2001 2002 1998 1999 2000 2001 2002 SVT-1 Ps 22.2 21.4 19.9 25 26.5 23.6 22.9 21.2 29.6 32.3 SVT-2 Ps 26 25.8 23.9 16.9 16.4 32.7 31.6 30.9 20.4 17.7 TV3 Pr 9.9 10.8 11.4 11.3 9.9 7.6 8.3 8.9 8.9 8.7 TV4 Pr 27 27 27 27.5 25.3 25.3 26.5 26 26.5 24.2 Femman/ Kanal 5 Pr 6.5 5.9 6.3 6.5 7.8 5.2 4.7 5.3 5.1 6.7 Total 91.6 90.9 88.5 87.2 85.9 94.4 94 92.3 90.9 89.6 Source: OBS
Where does the loss of market share by Sweden, Denmark and Finland go? The loss is too large for the nationwide commercial channels to have to accommodate. In fact these channels lose some of their daily market share in Sweden, Finland and Denmark and only make a slight gain in Norway. They slightly boost their share of prime time in Sweden, Norway and Finland but at rates far lower than that given away by national public broadcasters.
There is no question that the Nordic countries have so far succeeded in preserving their public broadcasting landscape despite the massive exposure to foreign channels. But foreign broadcasters seem to be vying for the Nordic market—evident the growth in foreign channels targeting these countries—and at the same time gain a slice of it. It is worth noting that these broadcasters primarily use English, a language spoken fluently by the majority of Nordic population, and some subtitle their broadcast in the vernaculars.
Research has shown that language barrier is the main reason for shunning a foreign channel and that once this barrier is removed viewers are bound to change preferences dramatically (Becker & Schoenbach, 1989). This has not yet happened on a large scale in the Nordic countries. Perhaps the advance of digitalization will hasten the advent of major changes in the contours of the current market share trends.
5. Equipment
Television as a device receiving off-air broadcasts has long reached its industrial maturity in developed countries, and Nordic states’ penetration rates are among the highest in the world. Therefore statistics on the percentage of television set per household are no longer as significant and relevant as they used to be, particularly in advanced countries where it is taken for granted that almost every household has at least one television. In the Nordic states, penetration rates of two television sets or more per household were reported to have reached about 40% as early as 1995 (OBS, 2003).
It is currently of more interest to know whether households, though saturated, continue to spend on television sets. There has been no let-up in electronics industry’s push to continue manufacturing the device and at the same time, Nordic households, with saturation levels achieved in the early 1980s, have not stopped buying. Households dump old sets for new ones, featuring better quality regarding sound, picture, screen, reception, use of remote control, adaptation to new media devices, etc.
In fact there is a steady growth in household expenditure on television sets in the Nordic states (Table 18). Norwegian households, for example, buy euros 240 million worth of television sets in 2002, up from €163 million in 1993 and €220 million in 1999. Television sets worth €328 million were bought in Sweden in 2002 compared with €139 million in 1993 and €273 million in 1999. Finnish television household expenditure surges to €188 million in 2002 from €93 in 1993 and €172 million in 1999.
Table 18. Household Expenditure on Television Sets, in Current € Millions
1993 1994 1995 1996 1997 1998 1999 2000 2001 2002 DK 165 185 197 241 218 220 220 237 185 240 FI 93 109 132 169 160 172 172 185 145 188 NO 106 134 124 142 147 148 SE 239 253 233 274 267 252 273 323 253 328 Source: OBS
The small screen is no longer used for “off-air” broadcasts. It has become a multi-purpose media object which owners are happy to see it work not only as a means of mass communication but also a device that can be put to a variety of uses. Two of the industry’s most successful and thrilling products—the VCR and the DVD—work in connection with television sets. As sales of DVDs are mushrooming and slowly outpacing those of VCRs, the set is expected to retain its enviable position as among the living room’s most prized items.
Nordic households have one of the world’s highest penetrations of video cassette recorder or VCRs. They were on the way to hit saturation point when the high quality video, the DVD (digital versatile disc/digital video disc) was launched in the United States. In 2002, as Table 19 indicates, more than 80% of Nordic households contained video recorders. Denmark’s VCR penetration rate was 83% of households in 2002, compared with 62.5% in 1993 and 76% in 1999. Norwegians had more VCRs than each of Sweden and Finland with
households contained VCRs compared with 62.8% in 1993. Finland had the lowest penetration with 75.9 of houses having VCRs in 2002. Icelanders’ had the largest penetration among the Nordic states with 93.6 of households having a VCR in 2002 compared to 72.2 in 1993.
Table 19. VCR Penetration of Television Households, in % of Television Households
1993 1994 1995 1996 1997 1998 1999 2000 2001 2002 DK 62.5 66.1 69.8 71.0 73.0 75.0 76.5 78.0 81.0 83.0 FI 60.0 63.0 65.0 67.8 70.0 74.7 74.5 73.3 74.6 75.9 NO 48.1 53.5 56.8 60.6 65.3 70.4 75.9 80.9 85.0 87.0 SE 62.8 65.8 69.8 73.1 72.8 74.3 76.4 79.2 81.0 84.2 IS 72.2 73.6 77.3 79.3 82.1 84.4 87.2 91.0 92.3 93.6 Source: OBS
It is unlikely that VCRs’ penetration will increase any further from the current levels as at least one Nordic country, Sweden, has reported a slash of 58% in VCR retail sales value between 2000 and 2002. A similar plunge in sales is also registered when comparing 2001 retail sales with those of 2002.
As VCR sales and penetration either decline or hover at almost the same levels, DVDs have seen an explosion in growth. The DVD penetration in the Nordic states skyrocketed to more than 18% of households in 2002 from 0.3% in 1998. Iceland had the largest number of DVD households in 2002 (29.8%). It was followed by Norway (22.2%), Denmark (18.0%), Sweden (14.8%) and Finland (8.9%). For example, while Norway’s VCR penetration growth was 2.3% in 2002, its DVD household penetration rocketed to 113% (Table 20).
Table 20. DVD Penetration of Television Households, in % of Television Households
1998 1999 2000 2001 2002 DK 0.4 1.3 4.3 10.2 18.9 FI 0.1 0.6 2.0 4.2 8.9 NO 0.7 1.8 4.7 10.4 22.2 SE 0.1 1.3 3.0 7.1 14.8 IS 0.0 1.1 9.0 19.8 29.8 Source: OBS
The Nordic region has also seen an almost comparable growth in DVD rental and retail turnover. The countries see some of the highest growth in turnover in Europe between 2000 and 2001(Table 21). Norway’s turnover surges 189%, Denmark’s 151%, Sweden’s 128% and Finland’s 130%. The growth subsides in Sweden and Norway and drops slightly in Denmark and Finland between 2001 and 2002. However, the rates are still among the highest in Europe.
Table 21. DVD Rental and Retail Turnover, € million 1999 2000 2001 2002 DK 5.4 19.1 47.9 119.3 FI 13.1 30.2 49.5 NO 4.5 16.5 47.5 108.1 SE 7.5 28.4 64.6 108.7 Source: OBS
As the DVD gains ground, transformations far bigger than those the introduction of the VCR caused are bound to happen. If the VCR changed our ways of television viewing (c.f. Carlsson et al., 2001; de Bens et al., 1987; Johnsson-Smaragi & Roe, 1986; and Roe, 1981 and 1983 ), the DVD, with its amazing array of electronic advantages, is proving to be an ideal vehicle for distributing video content from the movie industry. With its high quality of video and audio, the DVD has not only flooded the VCR market, but is replacing it for pre-recorded titles. Statistically, the DVD market “is growing faster than any other consumer electronics format in the U.S. and Europe” (www.disctrtonics.co.uk).
It will be interesting to see the influence the DVD is going to have on the cinema, film industry revenues and our concept of the television screen. With its capacity to store a full-length movie of high quality video on a disc the same size as a CD, Hollywood distributors are now mulling releasing their theater and DVD versions at the same time. Film industry’s turnover from DVD releases is soaring despite the plunge in prices. Some DVD films, issued shortly after their theater release, are currently being offered at rates comparable to the average ticket price in the four Nordic countries, where a visit to the cinema is dearer than anywhere in Europe.
An example of how the DVD is transforming the industry was the current online offer of Chalino Sacnchez’s Una Viva De Peligros whose DVD release scheduled for September 7 came shortly after its theater release. But more interesting was its price tag at $10.47, or €8.5, close to the average Swedish ticket price of €7.7. The DVD form of Mel Gibson’s blockbuster, The Passion of the Christ, appeared on retail shops five months after its spectacular theater release with a price tag of $17.99, higher than the average Nordic ticket price, but it is expected to fall the longer it remains on the shelf.
Perhaps television viewing and cinema attendance are two of the most important issues to monitor in the few coming years. The literature is rampant with studies detailing the impact of television on the cinema (Gunter & Svennevig, 1987; Rogers & Balle, 1985) but it is important to watch closely how cinema-related activities and television viewing are going to fare in the face of the new digital discs and screens vying to deliver consumers better audio and video quality.
6. Television Viewing
In the preceding sections, several aspects of Nordic television were reviewed. Among other things, they have highlighted the increase in the number of channels available nationwide, whether originating in the countries themselves or targeting them. They have also dealt with Nordic television market, audience market share, VCRs and the onslaught of the new television products particularly the DVDs. The following section treats television viewing in these countries and the major genres tackled by their public broadcasters.
Although Table 2 showed a surge in the number of channels Nordic viewers are currently able to receive, there has not been a dramatic change in the amount of time they spend watching television (Table 22). The average time they spent watching television was 155 minutes in 1999 and remained almost the same in 2002. Given the private nature of life in these Nordic states and their exceptionally long winter months, one would have thought that their inhabitants would be more attached to their silver screens than other Europeans.
Table 22. Average Television Viewing per Person per Day, in Minutes
Age 1993 1994 1995 1996 1997 1998 1999 2000 2001 2002 DK 4 + 147 154 158,9 159,6 156 162 158 151 152 156 FI 10 + -- 149 154 161 150 151 162 168 167 171 NO 12 + 136 140 143 149 144 142 157 163 158 147 SE 3 + 125 139 135 140,4 141 144 143 150 148 147 Source: OBS
On the contrary, Nordic viewers spend less time before their television sets than most of their counterparts in Western Europe. Even when viewed within a pan-European perspective, the Nordic countries would occupy the bottom of any rank list on average television viewing per person. According to OBS (2003: 59), only the Austrians watch less television on average (153 minutes) than viewers in the Nordic states. Nordic viewers see less television than Slovenians (175 minutes), for example, and are far behind viewers in countries like Germany (201 minutes), the U.K. (214) and Italy (230).
Nonetheless, Table 22 shows that the average viewing time for the Nordic states increases about 9% from mid-1990s to the turn of the century—from 145 minutes in 1994 to 158 in 2000 and 156 and 155 in 2001 and 2002 respectively. When the duration of viewing in the same table is closely examined, the Finns are seen to be fonder of their television than their Nordic counterparts—they spend 171 minutes per day viewing television compared to 156 for Denmark, and 147 for each of Sweden and Norway.
Why do Nordic viewers spend less time watching television than the inhabitants of other European states? The low viewing rate can probably be attributed to the little attention their public broadcasters give to entertainment. The viewers, who have generally remained loyal to their public service television, see less entertainment than any of the other major genres they concentrate on (Tables 23-26). The Nordic public service channels’ menu is dominated by “serious” programs, featuring mainly fiction, information and the News.
Nordic public broadcasters devote less time to entertainment than many of their European counterparts. For example, entertainment constituted 18% of Italy’s RAI television output in 2002. It made up 23% of UK’s Channel 4 television in the same year and 17% of BBC program output. Only Norway reports double-digit percentage (13%) for the share of entertainment in its public service program output for 2002. Sweden’s share is 7%, Finland’s 4.1% and Denmark’s 4.7% (Yearbook 2003).
However, the duration of television viewing is not likely to change in these countries even in the event of a change in the breakdown of major genres. The attention Nordic audiences pay to new electronic media, particularly the Internet, has apparently stalled any growth in television viewing duration. With the advent of the DVD, predictions are that the average of television viewing time per person in these countries will probably fall in the coming years.
Television viewing is also under attack from a new form of electronic media, the video game. The literature on television viewing has largely ignored the impact the game industry is having on the living room carpet battlefield. In the absence of reliable statistics, it is hard to guess the duration of time the television screen is used for gaming and not television viewing. But the industry is witnessing an arms race to up the quality and vie with Hollywood. A blockbuster video game currently rivals Hollywood releases in revenues (Waters, 2004). The paper mentions that Rockstar Games, a small development studio from Scotland, has sold 30 million copies of its Grand Theft Auto series.
Even an increase in foreign programming will most probably fall short of changing the contours of current television viewing rates. Indeed the countries’ television output is already dominated by foreign programs. And as mentioned earlier, broadcasters, whether domestic or foreign, have no language barrier to overcome as the majority of Nordic residents understand English fairly well and almost all foreign programs are either subtitled or dubbed in the vernaculars.
Providing a count of the number of the first-time release of feature films is usually taken as a measure to weigh the role of both the domestic and foreign markets in a country’s audiovisual landscape. On average, only 14 new domestic feature films were released in these countries in 1995 compared to 173 foreign ones. The number of domestic feature films released for the first time climbs to 18 in 2000 (a 28% rise) but still out of 179 foreign feature films released (OBS, 1995 and 2003).
A closer look at the program output of Nordic public broadcasters reveals that fiction— series and serials, sitcoms, feature films and television films—is the largest component of what their viewers normally see (Tables 23-26). The tables also show that the Finnish public broadcasters feed their viewers with more fiction programs than other Nordic public television channels. Swedes have more than twice as many news programs on their public channels (25.7% in 2002) than the Finns (7.7%) and Danes (9.8%) and 41% more than Norwegians.
Table 23. Breakdown of Major Genres of Denmark’s DR Television, in % 2000 2001 2002 Fiction 23.7 25.0 23.8 Information 33.5 19 34.2 News 7.0 7.9 9.8 Sport 8.4 6.0 7.3 Arts 8.7 9.2 7.5 Entertainment 6.6 5.9 4.7 Source: OBS
Table 24. Breakdown of Major Genres in Finland’s YLE Television, in %
2000 2001 2002 Fiction 29.5 29.0 26.4 Information 31.2 34.4 34.6 News 6.7 7.2 7.7 Sport 9.7 8.9 10.6 Arts 4.3 5.7 6.3 Entertainment 4.1 4.3 4.1 Source: OBS
Table 25. Breakdown of Major Genres in Norway’s NRK Television, in %
2000 2001 2002 Fiction 22.4 22.1 21.4 Information 18.8 16.0 13.9 News 10.0 17.0 18.1 Sport 9.6 7.2 12.7 Arts 9.9 5.2 8.1 Entertainment 13.0 14.1 13.3 Source: OBS
Table 26. Breakdown of Major Genres in Sweden’s SVT
2000 2001 2002 Fiction 23.6 23.1 21.3 Information 20.6 18.8 16.9 News 19.0 25.4 25.7 Sport 8.0 6.4 12.3 Arts 12.7 11.6 10.4 Entertainment 8.7 8.0 7.1 Source: OBS
Information programs, on the other hand, constituted the largest share of program output in both Denmark and Finland in 2002 with 34.2% and 34.6% respectively. Their share of Finland’s public broadcasters’ output was 13.9% and Sweden’s 16.9% in the same year. Tables 23, 24, 25 and 26 point out (a) generally, Nordic public broadcasters pay little attention to entertainment, compared to the news and information and (b) when it comes to information they apparently see it as part of their duty to keep their audiences posted on events concerning daily life.
7. Digitalization
When the digital technology became a reality in the mid 1990s, analysts and researchers forecast that analogue terrestrial broadcasting would be terminated in a few years (OECD, 1999). They were correct to predict that countries with the technology would do their best to extinguish their analogue transmission as quickly as possible. But they failed to see the hurdles the countries would face in the course of their transit from analogue to digital. Digital technology has many benefits. Once in place, the technology is set to substantially alter the broadcasting landscape. It does not only increase the range and type of services the broadcasters can provide, but also transforms the manner in which they are delivered. The broadcasters can use the greater capacity at their disposal to add more channels and at the same time upgrade picture and sound quality through high-definition television. Through digital technology, the broadcasters have the ability to furnish interactive services via a television receiver and instead of sending the same program to all viewers; an individual viewer will have the chance of receiving a particular program. The list of the advantages digital has over other modes of transmission is long but, as is the case with every new technology, commercial viability is a determining factor in its application.
After a rough start and several postponements, the Nordic states have now set new final dates for the changeover from terrestrial analogue to digital transmission. But they still need to overcome a few obstacles in their race against time to meet their self-imposed deadlines.
According to OECD (2001), Sweden’s public broadcasters were the first among their Nordic counterparts to introduce digital transmission in 1999. Sweden’s private television sector is also a Nordic digital pioneer as it had 3 digital multiplexes with 14 channels in the same year while its other Nordic counterparts had none. Digital transmission by Finland’s public broadcasters was introduced in 2000. Trials to transmit digitally were started by Denmark’s public service television in late 1999 and Norway still had a pilot project in the same year.
Table 27. Percentage of Television Households Receiving Digital Television in Nordic States and Other Countries 1997 1998 1999 Denmark 0 2.2 4 Finland 0 0.1 0.4 Norway 0 0.3 3.2 Sweden 0 0.8 2.9 UK 0 1 11.4 France 5.5 9.3 11.8 Spain 3 8.5 11 Canada 0.1 2 8.3 Source: OECD
But as Table 27 shows the digital revolution was still at its infancy in the Nordic states over the three years to 2000 and the direction it would take remained uncertain. Although the table shows high year-on-year growth, take-up of digital television by consumers in these countries was far below that of the U.S., the U.K., France and Canada. While by the end of 1999 around 14% of television households in the United States, for example, had the equipment to receive digital television, only 0.4% had it in Finland, 3.2% in Norway, 2.9% in Sweden and 4% in Denmark.
The considerable variation Table 27 reveals in the move to digital over the same period is not restricted to Nordic countries. It is also discernible in continental Europe. Only two countries—France and Spain—had more than 10% of digital television households and Italy had registered more than 5% growth. But as these countries experienced rapid growth in the take-up of digital television over the three years to 2002, the Nordic states made a remarkable move to catch up.
For example, Sweden’s proportion of households receiving digital television increased to 14% in 2001 from 2.9 in 1999. Denmark’s take-up of digital television shot to 11.8% from 4% and Finland’s to 10.5% from 0.4%. The percentage in growth is higher than that in both France and Spain for the same period whose take-up increased to 17% each (European Commission, 2002).
However, the growth in the proportion of digital houses in the Nordic states is still way behind that of the U.S. and the U.K. In the U.S., more than 24% of houses received digital television in 2001 and 34% in the U.K. The U.K. is perhaps the world’s number one in terms of digital take-up.
A recent report by the British Broadcasting Corporation (Highman, 2004) estimated the number of houses with digital television service at 12.36 million, or 50.2% of television households. The U.K. is committed to switch off analogue television transmission by 2010, according to the BBC.
In its latest report on digital terrestrial television or DTT (June 2, 2004), the European Platform of Regulatory Authorities (EPRA), classifies its 39-member countries into three groups in the light of their achievement and progress in the DTT transition. Only Finland and Sweden appear in the coveted A category of the most advanced countries where DTT penetration is above 15%. Denmark and Norway are included in the B group along with countries such as Hungary and Slovakia. According to EPRA (2004: 25), the penetration of digital television soars in Norway to 32.5% in 2003, but the country is not yet legally under obligation to switch off analogue frequency at a certain date and lags behind Sweden and Finland in terms of degree of DTT development.
The switchover to DTT is one of the most dramatic transformations the industry has seen since the television came into being in the 1950s. And as BBC’s media writer Nick Higham says (Highman, 2004) it needs “a brave government” to commit itself to switch off analogue television transmissions. Indeed, difficulties in gaining broad public acceptance of digital terrestrial television are evident in the Nordic nations and leading regulators to reconsider the previously established target dates for switch off (Brown & Picard, 2005).
As the EPRA (June, 2004) report came out, Finland’s Ministry of Transport and Communications, for example, announced the postponement of the full changeover to digital terrestrial television broadcasts for at least a year. The ministry had originally set 2006 as the final date to terminate analogue terrestrial transmission. The authorities in Denmark have also backed down on a vow to switch off DR’s local transmitters in the hope that its digital television network will cover the whole country by 2005. And the Norwegian parliament held a special session on the topic early 2004 to agree on a final switchover date which has been tentatively set for 1 January 2008. After changing switchover dates several times, the Swedish Ministry of Culture announced in February 2004 that it still cannot, under current circumstances, set a deadline “for the discontinuance of analogue broadcasting” (Nordic Media Policy, 2004).
8. Conclusions
The paper has explored features of television in the Nordic countries at the dawn of the twenty-first century by focusing on a channel count, revenues, market share, and the impact of VCRs, DVDs, and digitalization. The television environment has undergone major changes in these countries in recent years. The number of local channels and stations has declined and there has been a marked increase in the number of nationwide broadcasts. The turn of the century is also marked by a rise in the number of foreign broadcasters targeting Nordic viewers. It is worth noting that private television rather than its public service counterpart has fuelled much of the change and growth in the Nordic television landscape.
As for operating revenues, public funding remains a main source of income with advertising still lagging behind. No major changes are expected to occur in the current share of both public and private funding so long as the Nordic states shun calls to open up their public television sector.
Satellite and cable have given Nordic viewers access to more channels and programs, but major transformations in the contours of the market share of major domestic channels are not noticeable. However, a trend of public broadcasters losing part of their hold on the market has emerged. The market shares Nordic public broadcasters are losing are not fully recovered by their private counterparts and are probably going to foreign broadcasters who have been targeting the region in increasing numbers.
DVD penetration and sales are soaring along with expenditure on television sets. As a result the DVD is expected to transform not only television-related activities but the whole audiovisual industry. It will be interesting to watch how the surge in DVD penetration is going to affect television viewing and cinema attendance as the film industry revenues from the new electronic disc begin to rival income from theater releases.
No significant changes in the contours of television viewing are visible at the turn of the century despite the changes in broadcasters and video products. Nordic viewers continue to spend less time before their television sets than most of their European counterparts. Average television viewing is forecast to fall further with the onslaught of the new forms of electronic media, particularly the DVD. As viewers pay more and more attention to video games, the gaming industry is bound to eat into the current average of television viewing per person.
With regard to digitalization, the Nordic states reveal marked variation. While they have in place a solid digital infrastructure, it is not yet clear whether they will meet their self-imposed and postponed deadlines to switch-off analogue terrestrial broadcasting. While Sweden and Finland have made big strides to digitalize their television broadcasting, Norway and Denmark still lag behind.
References
Becker, L. & Schönbach, K., ed.s. (1989). Audience responses to media diversification. Mahwah, N.J.: Lawrence Erlbaum.
Brown, A. & Picard, R., eds. (2005). Digital terrestrial television in Europe. Mahwah, N.J.: Lawrence Erlbaum.
Carlsson, U. & Harrie, E., eds. (2001) Media trends in Denmark, Finland, Iceland, Norway
and Sweden. Göteborg: NORDICOM.
de Bens, E., & Knoche, M., eds. (1987).) Electronic mass media in Europe: Prospects and
developments. Dordrecht, The Netherlands: D. Reidel.
European Audiovisual Observatory (OBS) Yearbook (2003). Strassbourg: European Audiovisual Observatory.
Financial Times (2004). Media messages: Advertisers will have to work harder to reach consumers, Financial Times, August 3, p. 12.
Harrie, E., comp. (2003). The Nordic media market. Göteborg: NORDICOM.
Highman, N. (2004).Weighing up TV’s digital future, February 2. London: British Broadcasting Corporation.
Gunter, B. & Svennevig, M. (1987). Behind and in front of the screen. London: John Libby. Johnsson-Smaragdi, U. & Roe, K. (1986). Teenagers in the new media world: Video recorders,
video games and home computers. (Lund Research Papers in the Sociology of
Communication, 2). Lund..
Kelly, M.; Mazzoleni, G. & McQuail, D., eds. (2004). The media in Europe: The European
media handbook, 3rd edition. London: Sage Publications.
Roe, K. (1981). Video and youth: New patterns of media use. (Media Panel Report, No. 18). University of Lund: Department of Sociology.
Rogers, E.M. & Balle, F., eds. (1985). The media revolution in America and western Europe. Norwood, NJ: Ablex.
Picard, R. (2001). Expansion and limits in EU television markets: Audience, advertising and
competition issues. Discussion paper C2/2001. Turku, Finland: Business Research and
Development Centre, Turku School of Economics and Business Administration.
Waters, R. (2004). Sequels shoot up the video game industry’s sales charts, Financial Times, August 9), p. 14.
Internet References
Carat Crystal: http://users.otenet.gr/~media-he/studies/ (2002)
Directory of Television Channels in Europe: http://www.obs.coe.int/db/persky/ (2004) DVD & CD in Europe: www.disctronics.co.uk (2004)
EPRA, European Platform for Regulatory Services: http://www.epra.org/content/ english/index2.html (2004)
Nordic Media Policy: http://www.nmn.org/indexe.htm (2004)
The World Factbook: http://www.cia.gov/cia/publications/factbook/ (2004)
Statistics Sources
European Audiovisual Observatory: Yearbook 1995 – 2003)
European Commission: Cinema, TV and radio in the EU, Statistics on audiovisual services (Data 1980 – 2002).
Organization for Economic Development and Co-operation (OECD, Broadcasting services, 1999 & 2001.