https://doi.org/10.47260/jesge/1119 Scientific Press International Limited
Dams Safety: Review of Satellite Remote Sensing
Applications to Dams and Reservoirs
Nasrat Adamo1, Nadhir Al-Ansari2, Sabah Hussain Ali3, Jan Laue4 and Sven Knutsson5
Abstract
Remote sensing is the collection and interpretation of information of an object, area or phenomenon by a recording device that is not in physical or intimate contact with the object or phenomenon under study. It generally refers to the use of satellite borne or airborne sensors to capture the spectral and spatial relations of objects and materials on Earth from the space. This is done by sensing and recording reflected or emitted electromagnetic radiation from the objects. A brief history of satellite remote sensing is given in this review but the bulk of it is devoted to the scientific satellites launched into orbit and their sensors tracking, and presenting changes in water resources fields. The used technologies and satellite systems for monitoring movements and changes include American GNSS, GPS, the Russian GLONASS, Europe’s European Satellite Navigation System (GALILEO), China’s COMPASS/BeiDou, the Indian (IRNSS); Japan’s (QZSS) and many others. Details are presented on the present (LANDSAT), the Moderate Resolution Imaging Spectroradiometer (MODIS), as well as Synthetic Aperture Radar (SAR), and RADARSAT, JERS‐1, and ERS, which are developed by various countries, especially the USA. These sensors have the refined capability of providing estimates of variables, which depending on the purpose and design of the sensor, can follow critical issues related to water management problems. This review presents examples of actual studies carried out including; building databases of small dams and lakes on regional scale, derivation of volume vs. elevation and surface area vs. elevation of hundreds of reservoirs around the world, various
1 Consultant Dam Engineer, Sweden.
2 Lulea University of Technology, Lulea 971 87, Sweden.
3 Ass. Professor, Remote Sensing Center, University of Mosul, Iraq. 4 Lulea University of Technology, Lulea 971 87, Sweden.
5 Lulea University of Technology, Lulea 971 87, Sweden.
Article Info: Received: September 7, 2020. Revised: September 17, 2020.
bathymetric reservoir surveys, siltation of reservoirs and catchment areas erosion problems, monitoring of water quality changes, and above all monitoring dam deformation and stability problems of dams. The presented case studies cover the use of these different sensor together with the imagery used, their sources, methods of interpretation, validation and gives presentation of the end results. This review, which is only a very brief presentation of satellite remote sensing applications concludes that; in spite of the large volume of research done on this subject so far, which this review cites some of them , the expected future developments in satellite remote sensing technology coupled with advances in algorithms and models used in refining satellite imagery and validating the results will bring more accurate results and less laborious treatment work in addition to wider scope of applications. Keywords: Remote sensing, satellites, sensors, electromagnetic radiation, GNSS, GPS, GLONASS, GALILEO, COMPASS/BeiDou, IRNSS, QZSS LANDSAT, MODIS, SAR, RADARSAT, JERS‐1, ERS, bathymetric surveys, siltation of reservoirs, erosion, water quality, dam deformation.
1. General
Remote sensing is the collection and interpretation of information of an object or an area without being in physical contact with it. It involves the use of instruments or sensors to "capture" the spectral and spatial relations of targets observable at a distance from the space and analyzing and applying that information. The process involves the elements of energy source, radiation and the atmosphere, interaction with the target, recording energy by the sensors, transmission, reception, and processing, interpretation and analysis, finally the Application. So remote sensing provides a bird's eye view of much larger extent by looking down from above. The total area encompassed is considerably enlarged when looking downward from, say, a tall building or a mountain top. This increases even more from an airliner cruising above 10,000 meters. From a vertical or high oblique perspective, the obtained impression of the surface below is notably different than when observing the surroundings from a point on the surface [1]. In this information era, the trend is of remote sensing is to use new technologies for automation of monitoring important engineering undertakings or natural hazard such as dams, reservoir water level fluctuations and landslides [2]. This is especially important when it comes to accurately monitor absolute (3D) movements of a dam for example. In many cases, dam movement is measured by means of plumb lines, inclinometers or tiltmeters, and manual geodetic surveying techniques. Automation can be done here by using advanced instruments and means, and from that an absolute displacement can be estimated and recorded. There are even now many emerging technologies like robotized total stations, ground based radar, etc. which rely on very expensive and delicate equipment to be installed on site and subject to vandalism. The problem is even worse when it is required to monitoring slopes, abutments and landslides. The inaccessibility of some sites makes the task a huge challenge [3].
Satellite technologies, however, can provide tools to accurately monitor movements and changes without the need of expensive equipment on the ground. One example of such technology is the Global Navigation Satellite System (GNSS) which refers to a constellation of satellites providing signals from space that transmit positioning and timing data to GNSS receivers. The receivers then use this data to determine location and more detail information.
At present GNSS include many fully operational global systems; namely the United States’ Global Positioning System (GPS) which became fully operational in 1993, and the Russian Federation’s Global Navigation Satellite System (GLONASS) which was completed in 1995 and rejuvenated afterwards to be one of the most expensive projects in Russia’s Space program budget in 2010 [4].
Other system went into orbit later on namely Europe’s European Satellite Navigation System (GALILEO) which went alive in (2016), and China’s (COMPASS/BeiDou), the North Star, which its last satellite was launched on June 23rd 2020, marking the completion of the deployment of China’s own global navigation system. This satellite, the 55th in the family of BeiDou that means “Big Dipper” in Chinese, was successfully sent into the preset orbit by a Long March-3B carrier rocket, according to the launch center [5]. Then India’s Regional Navigation Satellite System (IRNSS); which was completed in 2016 [6], and Japan’s Quasi-Zenith Satellite System (QZSS) which had 18 satellites in operation by 2018 to be increased to 38 by 2024 [7].
Once all these global and regional systems become fully operational, the user will have access to positioning, navigation and timing signals from more than 100 satellites [8].
The second technology other than the GNSS which has been in wide use is the (Interferometric synthetic aperture radar: InSAR). This is a geodetic technique that can identify movements of the Earth's surface. Observations of surface movement made using InSAR can be used to detect, measure, and monitor crustal changes associated with geophysical processes such as tectonic activity, earthquakes, landslides and volcanic eruptions. When combined with ground-based geodetic monitoring, such as Global Navigation Satellite Systems, InSAR can identify surface. The technique can potentially measure millimeter-scale changes in deformation over spans of days to years. in particular monitoring of subsidence and structural stability [9]. Also, it's very important techniques for generating Digital Elevation Model (DEM) by using the Interferometric Phenomenon.
GNSS and InSAR are two different approaches that can provide tools to accurately monitor movements and changes without the need of expensive equipment on the ground, they complement each other to get a robust and complete solution. GNSS can provide fully automated motion monitoring in (3D) and real-time to a millimeter level accuracy for a discrete number of points by means of affordable GNSS receivers on the ground. InSAR on the contrary, provides infrequent, near vertical movements of a large number of points over a wide area also to millimeter-level accuracy without any equipment on the ground. Together, a comprehensive reservoir motion monitoring can be achieved. The radically two different approach
provide robustness to the system to better comprehend the behavior of the dam- reservoir system [10].
Remote sensing has become now a major technological and scientific tool used to monitor planetary surfaces and atmospheres. In fact, from a dollar-based measuring stick, the expenditures on observing Earth and other planets has since the earliest days of the space program now exceeded $150 billion. Much of this money has been directed towards practical applications, largely focused on environmental and natural resource management.
2. Historical Development of Remote Sensing
Remote sensing began in the 1840s as balloonists took pictures of the ground using the newly invented photo-cameras [11]. In the early 20th century remote sensing images were captured using kites and even by pigeons carrying small light weight cameras attached to these birds, and photos were automatically taken for military aerial reconnaissance using a timing mechanism. In 1906 professional photographer George Lawrence used a string of kites to raise a 49 pound camera 1000 feet in the air to capture the devastation of the earthquake in San Francisco. The steel kite line carried an electric current to remotely trigger the shutter. The famous photograph “San Francisco in Ruins” was taken 6 weeks after the earthquake and subsequent fires in San Francisco Figure 1 [12].
Figure 1: “San Francisco in Ruins” (by George Lawrence, 1906) [12]. Aerial photography became a valuable reconnaissance tool during the first world war and came fully into its own during the second world war [12, 13]. It was used for espionage in the (U2) flights program during the Cold War era, which was started in 1956 and came to an end on 1st May 1960 when a (U2) plane flown by Francis Gary Powers was shot down by (SAM) missile over Russia.
compared to traditional ground surveys was used in the United States for farm programs beginning in the 1930s with the passing of the Agricultural Adjustment Act. The Agricultural Adjustment Administration (AAA) began its aerial photography program in 1937 and by 1941 the (AAA) has flown and acquired aerial photographs of more than 90% of the agricultural land in the US.
The development of satellite based remote sensing began with the (Space Race) by launching the first world satellite (Sputnik 1) in 1957 by the Soviet Union, followed by the United States in 1960 with the successful launch of (Explorer1). In 1972 (Landsat 1), the first earth resource satellite was launched by the US. The main goal of the (Landsat) program was to collect data from the Earth through remote sensing techniques. Landsat 1 was originally named (Earth Resources Technology Satellite 1). The Landsat program has continued for 45 years with (Landsat 8) launched in 2013 and with (Landsat 9) expected to be in orbit in mid-2021.
Since the launch of (Sputnik 1) thousands of satellites have been launched. There are great number of commercial and governments satellites in operation today, many of which are used for remote sensing applications. There are currently over 3,600 satellite orbiting the Earth, but only approximately 1,400 are operational. Of these satellites, there is well over 100 which are earth observing satellites that carry variety of different sensors to measure and capture data about the Earth. These satellites are often launched by governments to monitor Earth's resources, but private commercial companies are becoming increasingly active in launching earth observing satellites as well.
Seasat was the first satellite designed for remote sensing of the Earth's oceans with synthetic aperture radar (SAR) which was launched on 27th June 1978 [14]. On the 35th anniversary of (Seasat's) launch, the Alaska Satellite Facility (USA) released newly digitized Seasat synthetic aperture radar (SAR) imagery [15]. Until this release (Seasat SAR) data were archived on magnetic tapes, and images processed from the tapes were available only as optical images of film strips or scanned digital images. Neither the tapes nor the films allow the quantitative analysis possible with the new digital archives. With the great improvements in computer-based processing, especially now, the ability of personal computers to handle large amounts of remote sensing data has made satellite and manned platform observations accessible to universities, resources-responsible agencies, small environmental companies, and even individuals.
Application of remote sensing in the field of water resources has become nowadays one of the principle tools in following and solving problems of water quality, runoff and hydrological modeling, flood management, watershed management, drought management, irrigation command area management, snow cover and glaciers, groundwater studies [16, 17, 18] in addition to solving problems of transboundary reservoir systems monitoring and dam safety monitoring [19]. The need to develop monitoring systems that can map changing land use, search for and protect natural resources, and track interactions among the biosphere, atmosphere, hydrosphere, and geosphere has become a paramount concern to managers, politicians, and the general citizenry in both developed and developing nations.
3. General Principles of Satellite Remote Sensing
There two types of remote sensing imaging systems:
i. Passive remote sensors
Which gather radiation that is emitted or reflected by the object or surrounding areas. Reflected sunlight is the most common source of radiation measured by passive sensors and microwaves emissions is another one.
Examples of passive remote sensors include film photography, infrared charge-coupled devices, and radiometers that whereby the radiant energy is converted to bio-geophysical quantities such as temperature, precipitation, soil moisture, chlorophyll etc.
These sensors can be:
First: the passive microwave sensor (TMI) designed to provide quantitative rainfall information over a wide swath under the Tropical Rainfall Measuring Mission (TRMM) satellite by carefully measuring the minute amounts of microwave energy emitted by the Earth and its atmosphere. TMI is able to quantify the water vapor, the cloud water, and the rainfall intensity in the atmosphere. It is a relatively small instrument that consumes little power. This combined with the wide swath and the good quantitative information regarding rainfall make TMI the "workhorse" of the rain-measuring package on Tropical Rainfall Measuring Mission [20], and; Second: the Moderate Resolution Imaging Spectroradiometer (MODIS) that was launched into orbit by NASA in 1999 on board the Terra satellite, and in 2002 on board the Aqua (EOS PM) satellite. They are designed to provide measurements in large-scale global dynamics including changes in Earth's cloud cover, radiation budget and processes occurring in the oceans, on land, and in the lower atmosphere, and they have been used in monitoring of large dams reservoirs storage.
ii. Active remote sensors
Active sensors create their own electromagnetic energy that is transmitted from the sensor towards the targets, interacts with the targets producing a backscatter of energy and is recorded by the remote sensor's receivers.
RADAR, LiDAR and LADAR are examples of active remote sensing where the time delay between emission and return is measured, establishing the location, speed and direction of an object [21]. In both LiDAR and LADAR, remote sensing is achieved by illuminating the target with laser light and measuring the reflection. Differences in laser return times and wavelengths can then be used to make digital (3-D) representations of the target [22]. LiDAR stands for Light Detection and Ranging and (LADAR)is abbreviated from; Laser Detection and Ranging. They are both acronyms that represent one type of remote sensing technology that can determine the distance between a sensor and an object. Coupled with the known location of the sensor, the range information can be used to produce a highly detailed 3-dimensional map of the object [23]. The Principles of passive microwave sensor and active remote sensors performances are illustrated in Figure 2.
Figure 2: Passive and active sensors systems working principles [24]. In the passive remote sensing systems, the sensor itself is composed of several radiation detectors. Assembling a set of radiation detectors with different wavelength band sensitivity and adding the necessary hardware will result in a multispectral sensor. The recording of image generating data by multispectral sensors is often performed by multispectral scanning. A set of sequential scan lines will eventually build an image, Figure 3 [25].
The smallest element to be detected by a sensor is called the geometric resolution of the system. The detector will measure the average reflection in a selected wavelength band. The result will be recorded as an image element on the scan line called a pixel. the pixel size that is cited, e.g. 80 m pixel size means that the smallest image element records the average reflection from an area of 80 by 80 m i.e. 6400 m2.
Figure 3: The chain of satellite data acquisition. The scanning device records data, pixel by pixel, along a scan line. Assembling the scan lines gives an image. The radiation is recorded in grey levels, most satellite sensors have an
8-bit resolution that permits 256 levels [25].
In cases of detecting, for example, a dry water course passing through an irrigated agriculture area. The reflectance from the river will differ very much from the surroundings since it lacks vegetation and has a bed of coarse sand and gravels with a high reflectance. The radiation detector will take an average reading from every pixel in the area. Pixels containing only irrigated fields will have a low reflection and appear dark on an image. Although the river is only 20 m wide it will significantly influence the average reading of the reflectance from all pixels it passes through. This will render these pixels brighter than the surroundings and on an image a series of pixels, following the river bed will get significantly different radiation readings, making the river appearing as a line on the image [25, 26, 27]. To summarize a satellite (sensor) image is built by pixels which are the smallest element in the image. A number of pixels are forming a line (scan line), recorded perpendicular to the flight direction of the sensor platform. When arranged properly using dedicated software the lines form an image.
The basic information on satellite remote sensing given in the preceding pages are meant to guide the unspecialized reader in following the various applications in: First: fields of civil engineering projects in the stages of:
i. Reconnaissance.
ii. PreliminaryPlanning/Feasibility. iii. Design.
iv. Construction.
v. Post construction/maintenance. . The potential role of remote sensing at each stage will vary from project to project,
but the following sections indicate some of the possible uses of the techniques [28],
and; Second: water resources management where such applications have already been
used successfully in observing flooding conditions and recording water level fluctuation in rivers and reservoirs, following reservoirs surface area variations, estimation of reservoirs storage and reservoirs siltation in addition to ascertain current dams and landslides stability conditions.
4. Dams and Reservoir Site Selection using Satellite Remote
Sensing
Dams and reservoirs site selection may be done in various ways, but most of the traditional methods are costly and time consuming. Advances in remote space technologies, however, can be utilized to make optimum use of time and cost. Satellite Remote Sensing provides imaging technology for updating of available maps and information in real time frame as well as collecting data of land use and Landover. A well-selected site may give the optimum benefits with minimum problems related to its performance and its impacts on the environment. In many recent cases these methods have been supported by use of the Geographical Information System (GIS) which is computer based system that handles the attribute data as well as spatial data since geographical information is an important characteristic. Use of GIS in many such studies is considered as a decision support system regarding optimal site selection. Remote sensing methods may provide basic data required for the GIS to build geodatabase and make decisions by using the appropriate available software.
As a demonstration of using such methods it is worth referring to one case study describing the process of selecting potential dams/reservoirs for the water supply of Karachi in Pakistan which was published in 2010 [29].
The first step was to determine site selection criteria which were to be considered as constraints in this procedure. Identification and justification for each of them was given by:
i. Sites should not be in the vicinity of densely populated areas due to safety considerations.
ii. Sites must have water accumulating topography to form reservoirs. iii. General slope of the area shall be gentle and not exceeding 11° to avoid
slope failure for environmental considerations.
iv. Having enough water source (run off and rainfall) for satisfying the projected demand.
The required layers of data necessary for the (GIS) use were obtained by using combination of both traditional methods and by utilizing acquired remote sensing data. In this way it was possible to create and convert one information layer for each
of the constraints data sets mentioned above by using (ArcGIS) software [30]. Information layers for constraints (i) to (iii) were produced from two satellite data
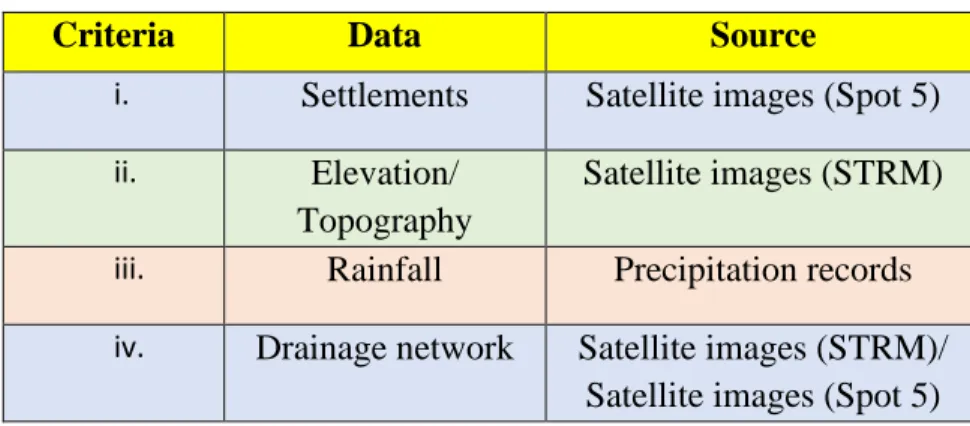
sources; the first source was (SPOT-5), which is one of the earth observation satellites (Passive System) in the program developed by the French space agency in the 1970s in association with SSTC from Belgium and SNSB from Sweden [31]. The second source was Shuttle Radar Topographic Mission (SRTM) dated 2004. STRM)is a NASA mission initiated in 2000 to obtain elevation data for most parts of the world, and it is the current dataset of choice for digital elevation model (DEM) data since it has a fairly high resolution (1 arc-second, or around 30 meters), and it has near-global coverage (from 56°S to 60°N), which is available in the public domain [32]. Finally, the rainfall data needed for (iv) and required for the study were obtained from available (1989-2000) local records. Summary of the criteria, the required data, and their sources is shown in Table 1.
Table 1: Site selection criteria, required data and their sources
Criteria Data Source
i. Settlements Satellite images (Spot 5)
ii. Elevation/
Topography
Satellite images (STRM)
iii. Rainfall Precipitation records
iv. Drainage network Satellite images (STRM)/ Satellite images (Spot 5)
Although this methodology makes the decision making process more objective, there is still an element of subjectivity which originates from the planner own experience and judgment. In this case selection of the more promising sites was done by allocation weights to each of the criteria and screening the result in a procedure described in the study. This procedure allows flexibility to be incorporated as varying degrees of importance are assigned to each criterion based
on the planner’s experience. The final decision was left to the relevant department which is the final decision maker. It is recognized that social, political and budgetary constraints could produce an alternative other than the best alternative obtained by the planner.
Our conclusion is that; the planning process of any development project of an engineering nature, such as dams, communication lines and live lines can be a complex process involving many disciples based on requirements dictated by natural elements, social rules and environmental factors. Space remote sensing can help as a tool to provide basic data of natural and environmental factors, which otherwise have to be obtained by costly and time consuming traditional methods. The great number of satellites and the numerous sensors onboard available today present good opportunities in planning, but decision making remains as an unchallenged human activity.
5. Dams and Reservoirs Management Utilizing Satellite
Remote Sensing Applications
Space remote sensing has found its application in USA for many of the operational issues of dams and their reservoirs since the late 1980s. Initial work was done in1987 over a small number of targets using data from SEASAT [33]. SEASAT was the first Earth-orbiting satellite that was managed by NASA for remote sensing of the Earth's oceans and had on board the first spaceborne Synthetic-Aperture Radar (SAR). This satellite was launched on 27 June 1978 but it stopped working on the10th of October 1978. Observation was followed after this by the extraction of decimal time series from TOPEX mission [34]. TOPEX/Poseidon was a joint satellite mission between NASA, the U.S. space agency, and CNES the French space agency, to map ocean surface topography; Launched on August 10th,1992. Estimating water storage in large reservoirs and lakes is attributed to the advent of radar altimetry. The most commonly used spaceborne radar altimeters during the past period were; GEOSAT, Topex/Poseidon or T/P, ERS-1, ERS-2, GFO, ENVISAT, JASON‐1 and JASON-2.These sensors are out of service now and are replaced by other more modern sensors such as LANDSAT, the MODIS, as well as SAR, and such as RADARSAT, JERS-1, and ERS. All these sensors have the refined capability of estimating water storage and storage variation in lakes and reservoirs, in addition to measurements of both surface water area and bathymetry. The primary advantage of LANDSAT is its high resolution of 30m per pixel, but it has low repeat frequency and is susceptible to cloud cover contamination. For sensors with daily coverage, like MODIS, the frequency of observations is obviously an advantage, but the resolution is relatively coarse 250 m to 500 m per pixel.
As an example of studies on the use of such measurements for the derivation of the elevation- area variation time series one example is presented in the following text. It is taken from a comprehensive study which was carried out in 2012 on five of the largest reservoirs in the United States and 34 reservoirs in various parts of the world
by utilizing available MODIS outputs [35]. Water elevations and surface areas data during any overlapping period(s) from (2000 to 2010) for each of these reservoirs were used to derive their elevation-area relationships. These elevation-area relationships were then used to estimate reservoir storage volume time series. In Figure 4 the water surface elevation and surface area relationship for Fort Peck Reservoir is presented as one of the outputs of this study.
Figure 4: Water surface elevation and surface area relationship for Fort Peck Reservoir [35].
A linear regression was used to approximate the relationship between surface elevation (h ) and surface area (A ) i.e.,
A = f (h )
For the period 1992- 2000, when MODIS data were unavailable, this relationship was applied to estimate the reservoir surface area from the water elevation historical data. Similarly, during periods when altimetry data were unavailable during the MODIS era, the water elevation was estimated as an inverse function of the surface area function (h = f −1(A )).
The storage equation:
Vo = Vc - (Ac + Ao)(hc-ho)/2 , was used to estimate reservoir storage,
where Vc , Ac , and h c represent; storage, area, and water elevation at capacity, and Vo , Ao , and ho are the observed storage, area, and water elevation, respectively. The values at capacity (Vc) were taken mostly from the Global Reservoir and Dam (GRanD) database [36]. GRanD is based on multiple sources, including a variety of regional and national inventories and gazetteers, International Commission on Large Dam's World Register of Dams as well as a variety of publications, monographs, and maps.
By substituting the elevation-area relationship into above equation, the storage equation can be simplified into a single variable function, either as a function of water elevation from altimetry or as a function of surface area from MODIS. The value of MODIS data was provided in filling the gaps in the existing records to derive the complete elevation- area variation time series for all of these reservoirs for the period (1992 to 2010) which then could be used to estimate reservoirs storage volume time series for the same period. In Figure 5 the time series of reservoir storage volume estimated from remote sensing for Fort Peck Reservoir is presented as an example.
Figure 5: Time series of reservoir storage estimated from remote sensing for Fort Peck Reservoir [35].
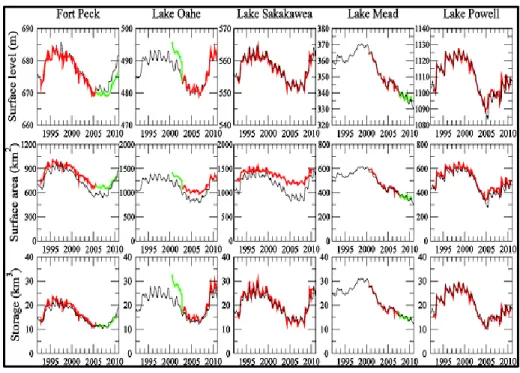
The complete sets of the time series for water surface elevations, surface area, and storage volumes which are obtained from remote sensing for the five U.S reservoirs are given in Figure 6. This figure shows comparison of gauge observations for the reservoirs in black, altimetry-based estimates in red, and MODIS based estimates are in green.
In the same way, the elevation‐surface area relationships for each of the 34 other world reservoirs were developed, and then they were used to estimate time series of reservoir storage volumes. The reservoir storage volume results are shown in Figure 7 and the elevation‐area relationships are summarized in Table 2. The total capacity of the 34 reservoirs is 1164 km3, which represents about 15% of global reservoir capacity. For 16 of these reservoirs, the estimated storage volume is available for 19 years (1992–2010) and the average record length for all reservoirs is 14.5 years. The correlation coefficient between the water elevation and surface area varies from 0.08 to 0.98, with an average value of 0.5. A high correlation usually indicates good quality for both data sets, while a low correlation can result from many conditions. These include errors from either the water elevation or surface area or both, and/or the possibility that within the range of variation the bathymetry is independent of area (i.e., vertical walls). For consistency within the time series for each reservoir, the MODIS estimated surface areas were used to maximize the record length, when altimetry water elevation was unavailable, but this is done only if the correlation coefficient between altimetry water elevation and MODIS surface area exceeded 0.5.
Figure 6: Comparison of gauge observations for five U.S. reservoirs; gauge observations in black, altimetry-based estimates in red, and MODIS based
Three of the reservoirs given in this table are located in Iraq; Mosul Dam reservoir, Qadisiya Dam (Haditha) reservoir, and the Thartar Reservoir. Of these three reservoirs the Tharthar reservoir and the Qadisiya Dam, are selected for further comments, in addition to commenting on Lake Nasser on the Nile River (Egypt), and the Toktogul Dam reservoir (Kyrgyzstan), in addition to Guri Dam reservoir (Venezuela).
Lake Tharthar, the largest artificial lake in Iraq, is the first example. Its primary purposes are irrigation and flood control. During the study period, there were two severe droughts in the Fertile Crescent, one from 1998 to 2001 and the other from 2008 to 2010. Both wheat and barley production dropped precipitously during these drought events. The remotely sensed reservoir storage for Lake Tharthar indicates that the lowest storage during these events was about 35% of the peak value in 1993. Lake Qadisiyah (Haditha), a much smaller reservoir built for irrigation, flood control and power generation close to Lake Tharthar, was hit relatively harder by the droughts; reservoir storage was completely depleted by the end of 2009 for a short period. Knowledge of water availability in water‐sparse regions like this is crucial for man-aging irrigation water use and for planning aid.
Table 2: Water Elevation-Area Relationships, Correlations, and Mean Absolute Errors [35].
In central Asia, the time history of storage in Toktogul Reservoir was examined. It supplies water to Kyrgyzstan's single largest hydropower plant, and it also provides irrigation water downstream. During the 2007–2008 drought, the reservoir storage was completely depleted. Storage information for the Toktogul Reservoir is also crucial for water management in the Naryn/Syr Darya basin, which is a major international river system in Central Asia.
With a storage capacity of 157 km3, Lake Nasser in Africa is the third largest man-made reservoir in the world by volume. Its main use is for irrigation, with hydropower and flood control as secondary operation purposes. During the 1990s the water elevation and storage increased due to high precipitation in the Ethiopian Highlands. For the safety of the dam, water was spilled from Lake Nasser westward into the Sahara Desert, forming the Toshka Lakes (beginning in 1998). From 2003 to 2007, these discharges to the Toshka Lakes were stopped, and the new lake contracted. From knowledge of storage history for Lake Nasser it shows that the rebound of storage in 2008–2009 should have allowed more spillover to the Sahara, suggesting possible increases in irrigation diversions or releases to the Nile Delta. Guri Dam in South America is the world's third largest hydropower plant. It supplies 73% of Venezuela's electricity. Two major drought events (2001 to 2004 and 2009 to 2010) were the worst in the past 40 years in Venezuela, and the reservoir dropped to a low storage of 28% of its maximum in 2003. During the 2010 event, power rationing was implemented to close the electricity gap. The obtained reservoir time series shows that reservoir storage experienced a quick recovery from the last drought by the end of 2010.
The interest for securing reliable water resources in many semiarid regions of the world has increased sharply during last decades to meet the increasing population demand for food. This has led to expanding irrigated agriculture from small water sources and required the use of small reservoirs for the hitherto neglected such re-sources. The increasing number of small size dams and their wide distribution over large swaths of rural countryside has made their monitoring much more difficult. To overcome the lack of baseline data, some studies have classified the extent of small reservoirs surface areas of such reservoirs from Landsat ETM which utilize the Enhanced Thermal Mapper sensor (ETM) born by Landsat 7 (1999) [37]. One study published in 2009 explained the use of (ENVISAT-ASAR) to monitor three small dams close to the village of Tana Natinga in upper east region of Ghana, West Africa, where water supply from these three small dams was critical for the population of three villages to satisfy irrigation demand, livestock watering and household use [38]. The area was semiarid with an annual average precipitation of not more than 986mm and the three reservoirs had shallow depths. The study used 22 (ENVISAT-ASAR) images acquired bimonthly from June to August 2006 to ensure observing seasonal variation, the changing vegetation context, and the large variability of backscatter from water surfaces i.e., through wind-induced water surface roughness. The ENVISAT or “Environmental Satellite” is a large inactive Earth-observing satellite which is still in orbit, οperated by the European Space Agency (ESA)[39, 40], and ASAR is the advanced Synthetic Aperture Radar sensor
[41]. The overall conclusion of this research has shown that regional to basin scale inventories of small inland water bodies are readily possible with ENVISAT-ASAR images. In combination with regional area-volume equations, basin-wide reservoir storage volumes can be estimated, and the impact of further development can be assessed and monitored.
Moreover, in a research carried out in 2005 [42], the inventory of small farm reservoirs in Insiza District that forms part of Mzingwane catchment (Zimbabwe) [43] was obtained through remote sensing by acquisition of images from (LANDSAT 5, bands 5, 4 and 2). Using Red- Green- Blue channel, water bodies were depicted in colors ranging from blue to almost black and reservoirs were uniquely identified. This procedure was applied for all reservoirs studied in this research work. The objectives of the study were:
i. To identify small reservoirs in terms of their numbers and spatial distribution in the study area from satellite images.
ii. To develop a methodology to estimate small reservoir capacities as a function of their remotely sensed surface areas in the basin.
The estimated number of small farm reservoirs when this study was conducted in (2005) was 1000 in Insiza District as depicted from satellite image and they were quite evenly distributed in the entire catchment as displayed in Figure 8.
Figure 8: Spatial distribution of small reservoirs in the Mzingwane catchment [42].
This number included small reservoirs in both communal lands and resettlement areas, which means an update baseline data of reservoirs was obtained by use of remote sensing. The method of using satellite information to estimate the number of small reservoirs and keep an update of small reservoir database proved to be useful. The difference in the number of small reservoirs’ records obtained from other sources in later years maybe due to construction of small farm dams in these years by some farmers without prior approval from the water authorities.
Having established the spatial distribution of small reservoirs in the study area in question, field study on 12 selected reservoirs from this inventory was carried out. The depths of water accompanied with their coordinates were measured; from which area and capacity relationships were calculated for each reservoir using geographical information system (Arc View 3.2 GIS) package with Spatial Analyst, plus Surface Areas and Ratios from elevation Grid extension [44] were used to automate surface area calculations and to provide surface area statistics. The use of (Arc View 3.2 GIS) software was actually validated in 2003 [45].
The conclusions were; the applicability of the method over other catchments may have to be looked at in future as well as the need to carry out a hydrological model-ling to investigate the impacts of small reservoirs in water resources in other basin. In general, and with the capacities of these small reservoirs known, planners and water managers will quickly make decisions on how to utilize and manage the available water given the various competing uses. Moreover, a water manager will in case of flooding be able to predict the likelihood of floods and hence putting in place remedial actions to ensure the community is not at risk [46].
Estimation of small reservoir storage capacities with remote sensing in the Brazilian Savannah Region was also conducted and results were published in 2011. This work was carried out for the purpose of efficient water management and sound planning of 147 small reservoirs which can store 19×106 m3 of water at full capacity located in the Preto River Basin which was hindered by inadequate knowledge of the number, storage capacity and spatial distribution of reservoirs in the basin.
To address this lack of data, a simple method to estimate reservoir storage volumes based on remotely sensed reservoir surface area measured with (LANDSAT) was developed. The method was validated by choosing a subset of reservoirs in this basin for which surface areas, shapes and depths were determined with ground-based survey measurements. The agreement between measured and the remotely sensed reservoir volumes was satisfactory indicating that remotely-sensed images can be used for improved management of water in the Brazilian Savannah. The inventory and classification of reservoirs was conducted by means of remote sensing using three Landsat ETM images taken in 2005. Investigation of the selected reservoirs in the chosen subset consisted of visiting the site, collecting information from farmers with questions focused on reservoir characteristics such as existence of technical information (area, depth, maps, etc.), maintenance, age, purpose, etc. The initial database consisted of 252 small reservoirs, but only those with surface areas between 1 and 50 ha were considered. Estimation of water depths was done using a plummet from a boat and GPS coordinates determined at many
locations inside these reservoir. In order to assure good quality data and whether more readings should be takes, the depth and GPS data were downloaded to a laptop and analyzed before leaving the site.
Satellite measurements of 75 reservoir surface areas were well correlated with field measured areas. Deviations in surface area measurements between the two methods were the result of both the coarse image spatial resolution of 30 m and the presence of herbaceous water plant cover in the shallow tail parts of the reservoirs. Surfer Golden Software was used to calculate the surveyed reservoir volumes by creating a 3D-Model for each reservoir, and the volume-area relationships were determined by a linear regression of the log of both the maximum surface area and storage capacity [47].
The general relationship between measured reservoir volumes and their remotely sensed surface areas showed good agreement. The R2 =83% gives, in some extent, confidence in its use, especially for reservoirs with no other available information. Combining this relationship with periodic satellite-based reservoir area measurements will allow hydrologists and planners to have a clear picture of water resource system in the Preto River Basin, especially in ungauged subbasins. At full capacity, the water that the Preto River Basin’s 147 small reservoirs can capture is likely small, but these act as a set of well-distributed and easily accessible water source systems that have multiple uses, reducing the population’s vulnerability and improving their livelihoods. The applicability of the derived relationships to other catchments should be examined in future [48].
In 1994 a comprehensive study on the applications of remote sensing methods summed up the application of remote sensing methods required in the field of hydrology, of which many have their use in the investigations of potential dam sites, creating inventories of small dams on regional scale, obtaining volume-area relationships of dams, floods studies and so on. The study indicated the need for more research before operational applications can be made in other areas. The areas requiring additional emphasis that were indicated in this 1994 study were: Land Cover, Sediment Loads and Erosion, Snow Water Equivalent (Complex Terrain), Soil Moisture, Groundwater, Physiography, Albedo, Evapotranspiration, Areal Inputs to Models, Streamflow, Infiltration, Chemical Pollution. The study concluded that rapid advances in this field were expected in the following several years, especially if adequate effort is devoted by technique developers to technology transfer of the remote sensing methods [49]. This prediction proved its foresight as may be seen from another publication in 2018 which includes details of advances made in the following years in the technology of remote sensing and the versatility of the topics researched [50].
6. Remote Sensing Application in Bathymetry Studies
Accurate determination of water depth is important both for the purposes of monitoring underwater topography and movement of deposited sediments, and for producing nautical charts in support of navigation. Moreover, bathymetry has proven its value in studies on hydrological and biochemical processes in water bodies such as lakes and reservoirs, in addition to presenting an aid to constructing weather forecast models where temporal variation of surface area and reservoirs depths are taken into consideration. Bathymetry has been traditionally done by vessel based echo sounding and also by airborne remote sensing by (Lidar) by illuminating the target with laser light and measuring the reflection with a sensor which can produce accurate depth measurements. These methods, however, can in situations be costly, inefficient, and inapplicable to very near shore shallow waters and limited by the survey width. By comparison, satellite remote sensing methods offer more flexible, efficient and cost-effective means of mapping bathymetry over broad areas.
This remote sensing bathymetry generally falls into two broad categories [51]:
i. non-imaging
ii. imaging methods
The first category; is based on the use of (Lidar) sensors, that measure distances by illuminating the target with laser light and measuring the reflection. Differences in laser return times and wavelengths can then be used to make digital 3D representations of the target and the method has terrestrial, airborne, and mobile applications [52]. It is able to produce accurate bathymetric information over clear waters at a depth up to 70 m. However, this method is limited by the coarse bathymetric sampling interval and high cost.
The second category; this method can be implemented either analytically or empirically, or by a combination of both. Analytical or semi-analytical implementation is based on the manner of light transmission in water. It requires inputs of a number of parameters related to the properties of the atmosphere, water column, and bottom material. Thus, it is rather complex and difficult to use.
Both implementations of this category can produce fine-detailed bathymetric maps over extensive turbid coastal and inland lake waters quickly, even though concurrent depth samples are essential. The detectable depth is usually limited to 20 m. The accuracy of the retrieved bathymetry varies with water depth, with the accuracy substantially lower at a depth beyond 12m and it is influenced by such factors as water turbidity and bottom materials, as well as image properties. With the introduction of new sensors, new data collection technology and the explosion of digital datasets, there has come the ability to develop accurate geospatial products. DEMs and bathymetric navigation surfaces are generated from combining high-resolution and spatially dense, raw digital data with proper vertical reference datum surfaces and are capable of supporting a variety of applications pertinent to the coastal manager. By using VDatum software [53] bathymetric and
topographic data can be transformed into common vertical datum such as shoreline, or Mean High Water; a seamless DEM can then be created. Data integration allows bathymetric-topographic or bathy-topo (DEMs) to be produced upon which various scenarios can be overlaid, such as sea-level rise, storm surge, tsunami and other inundation scenarios [54]. It is worth mentioning that the airborne (Lidar) has been used to map the bathymetry of thousands of small shallow lakes over the Alaska Slope [55].
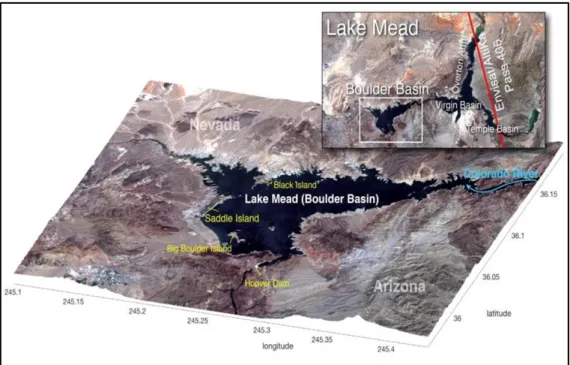
Advancements made in recent years and the growth of spaceborne altimetry have shown, however, promise for deriving reservoir bathymetry. An example published in 2018 explained such use which was applied to derive 3 D bathymetry of the lower portion of Lake Mead by combining the time series radar altimetry and Landsat data sources, which included the hydrological data and maps based on Shuttle Elevation data at multiple scales, and on Envisat and Altika radar altimeters, and Landsat-based water extents. Lake Mead, created by Hoover Dam on Colorado River, which is located in Nevada, USA, was used as the study case due to the large ground-based data availability, including bathymetric measurements used for evaluations. It is also the largest reservoir in the U.S, with a maximum water capacity of 32.2km3. The focus of the study was the lower portion of the lake, i.e., the Boulder Basin. Figure 9 shows a location map of the study area which has a maximum water capacity of 10.5km3. The objectives of the study were to evaluate different techniques that rebuild reservoir bathymetry by combining multi-satellite imagery of surface water elevation and extent.
DEMs were processed in two distinct ways in order to determine 3D reservoir bathymetry.
They were defined as: (a) linear extrapolation and (b) linear interpolation.
Figure 9: Geographical information of Lake Mead in the USA and Boulder Basin. The figure is derived from Landsat-8 OLI image taken on August 14,
2017 [56].
The first one linearly extrapolates the land slope, defining the bottom as the intersection of all extrapolated lines. The second linearly interpolates the uppermost and lowermost pixels of the reservoir’s main river, repeating the process for all other tributaries.
A visible bathymetry, resulting from the combination of radar altimetry and water extent masks, could be coupled with the DEM improving the accuracy of techniques (a) and (b). Envisat and Altika based altimetric time series was combined to a Landsat based water extent database over the 2002-2016 period in order to generate the visible bathymetry, and topography was derived from the (3-arcsec HydroSHEDS DEM (i.e. 900m). Fourteen 3D bathymetries derived from the combination of these techniques and datasets, plus the inclusion of upstream and downstream riverbed elevations, were evaluated over Lake Mead. Accuracy was measured using ground observations, which showed that metrics improve as a function of added data requirement and processing. Best bathymetry estimates were obtained when the visible bathymetry linear extrapolation technique and riverbed elevation were combined. Water storage variability was also evaluated and showed that best results were derived from the aforementioned combination.
In this type of studies two limitations, however, were recognized in the evaluation. They were:
i. Limited number of the evaluation techniques to generate 3D bathymetry. ii. Limited number of evaluation sites.
Applying and combining additional extrapolation and interpolation techniques (i.e. polynomial, logarithmic, exponential, among others) to a wider range of reservoirs can result in a more refined evaluation, and metrics could be related to hydrogeological features (e.g. shape, depth, etc.) in order to determine the most appropriate techniques to be used. Unfortunately, access to ground-based bathymetric observations is still limited, restricting a broader evaluation [56]. To overcome the limitation of availability of elevation observations from radar altimetry another study was published in 2019 which was made with the objective to explore the potential of generating high resolution reservoir bathymetry at a global scale using data collected by the Multiple Beam Experimental Lidar (MABLE) on board NASA, Ice, Cloud, and land Elevation ICESat-2, which is the 2nd-generation of this series [57]. The study covered again the Bolder Basin forming the western part of Lake Mead shown in Figure 10, also indicated in Figure 9 above.
Figure 10: Location map [58].
MABEL elevation data were collected on February 24, 2012, with reported clear sky and relatively low turbidity where the collected data was over approximately 2m footprint along its track. The data was then merged with the Shuttle Radar Topographic Mission (SRTM DEM) to get the final telemetry. Leak Mead (Lidar) survey data collected by the United State Bureau of Reclamation (USBR) in 2009 were used to validate part of the bathymetry product which was generated using MABEL data. The methodology can be illustrated by the flow chart in Figure 11.
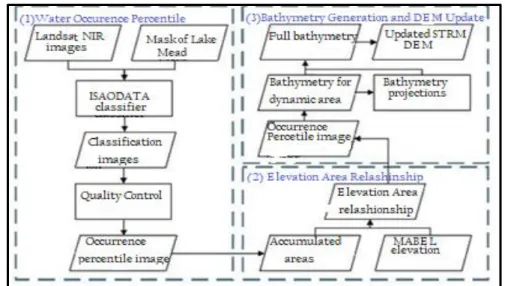
Figure 11. Flowchart of the bathymetry generation algorithm. It consists of three parts (contained in the three blue boxes): 1) The water occurrence percentile image was generated from the Landsat classifications,
which essentially provided the bathymetry contours; 2) The Elevation-Area relationship was established by combining the area from occurrence percentile image with MABEL elevation values. This was then used to identify and assign elevation values to the contours, and 3) The Elevation-Area relationship was applied to the bathymetry for the dynamic lake area. Which was used to project the bathymetry of the dynamic lake for the central
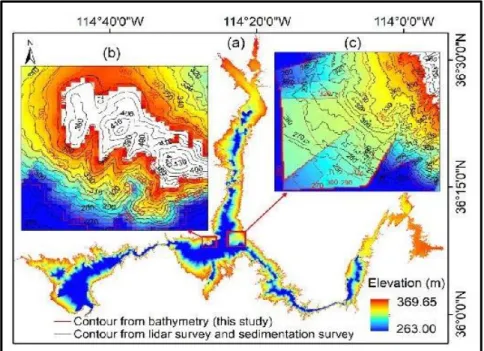
area to obtain the full lake bathymetry. Then the full lake bathymetry was overlapped with the SRTM DEM data to replace the constant value [58]. Figure 12a shows the full bathymetry of Lake Mead, including the remotely sensed part (330.62–369.65 m) and the projected part (263.00–330.62 m). Although the performance of the projected bathymetry varies with region, it has an overall good pattern. Close-up views of the two regions were selected to show the details. In the subset area shown in Figure 12b, the contours based on the projected bathymetry agree well with those from the sedimentation survey data. However, in the subdomain depicted by Figure 12c, the projected results largely missed those from the survey; which was caused by the assumption made that the slope remains constant. The resultant full bathymetry was then embedded onto the SRTM DEM data. The comparison between the bathymetry and SRTM DEM is shown in Figure 13. It was evident that the elevation of Lake Mead from DEM is constant (372 m) over the entire reservoir. In order to be accurate, the researchers first applied the reservoir area from the DEM (587.50 km2) to the (MABEL)-based elevation-area relationship to estimate its corresponding elevation (367.82 m). A systematic bias of 4.18 m was found between this elevation value and that according to the SRTM DEM. A bias correction of 4.18 m was then applied to the bathymetry such that it
could be seamlessly combined with the DEM. Thus, the part of the DEM with a constant value of 372 m was replaced by the part of the bathymetry results representing 372 m and below after the systematic bias correction. Moreover, contour maps with different horizontal intervals (e.g., 5, 10, and 20 m) were drawn from the bathymetry, which can help to delineate the profile. An example of the contour map at a 20-m interval is shown in Figure 13.
Figure 12: (a) Full bathymetry of Lake Mead, including the remotely sensed bathymetry (3330.62-369.65m) and the projected bathymetry (263.00-330.62m); (b), (c) close-up views of the two regions with (b) satisfactory and (c) unsatisfactory performances are selected to show the details. Note that the
contour data from both sources have an elevation interval of 10m. The contour data are not shown in (a) because they are relatively dense and would
not be useful to the reader [58].
Validation of the remotely sensed bathymetry products showed an overall good agreement when comparing it with available USBR Lidar data and sedimentation data sets. Comparing the statistical bathymetry results obtained from this study with those obtained from the (Lidar) survey within each percentile band (at a 10% interval), there was a clear overestimation in the 1%–30% range and an underestimation in the 80%–100% range. However, the derived bathymetry in overall agrees very well with the (Lidar) survey data. The overall survey data show a larger variation within each band, which can be attributed to both the higher resolution and the measurement error of the raw data, but it was unclear why the survey elevations in the 90%–100% band are higher than those in the 80%-90% band.
Figure 13: (a) Full bathymetry and (b) STRM DEM data over Lake Mead. The contour map (with a 20m interval) is derived from bathymetry information and DEM elevation is constant (372m) over the entire lake[58]. In summary, it was demonstrated that the 532 nm (MABEL) elevations and imagery data sets can be combined to generate high-resolution 3D reservoir bathymetry results for the dynamic area over the last three decades. The bathymetry for the central reservoir area can be projected by extrapolation and then integrated with the remotely sensed results to obtain the full bathymetry. The highlight is; that a 30m resolution and high-quality bathymetry profile representing the complete range of the dynamic reservoir area over more than 30 years (i.e., 58% of Lake Mead’s capacity) was produced exclusively from remote sensing data. The next conclusion was that until the time of this research work, there had been no cost-effective approach to derive reservoir bathymetry on a global scale.
Similar method was used to derive area-elevation relationships for reservoirs on global scale and a 30m resolution bathymetry data set was generated for 347 global reservoirs, representing a total volume of 3,123 km3 (50% of the global reservoir capacity). This was documented in a recent study published in 2020 study [59]. First, Area- Elevation (A-E) relationships for the identified reservoirs were derived by combining altimetry data from multiple satellites with Landsat imagery data. Next, the resulting (A-E) relationships were applied to the Surface Water Occurrence (SWO) data from the Joint Research Center (JRC) Global Surface Water (GSW) dataset [60] to obtain bathymetry values for the dynamic areas of the reservoirs. Lastly, an extrapolation method was adopted to help achieve the full bathymetry dataset.
The remotely sensed bathymetry results were primarily validated as follows:
i. Against Area-Elevation (A-E) and Elevation-Volume (E-V) relationships
derived from the in situ elevations and volumes for 16 reservoirs, with root-mean-square error (RMSE) values of elevation from 0.06 m to 1.99m, and normalized RMSE values of storage from 0.56% to 4.40%, and ii. They were also validated against survey bathymetric maps for four
reservoirs, with R2 values from 0.82 to 0.99 and RMSE values from 0.13m to 2.31 m.
The projected portions have relatively large errors and uncertainties (compared to the remotely sensed portions) because the extrapolated elevations cannot fully capture the underwater topography. Overall, this approach performs better for reservoirs with a large dynamic area fractions. It can also be applied to small reservoirs (e.g., reservoirs with surface areas of a few square kilometers or less), where (ICESat) observations are available, and to large natural lakes. With the contribution of (ICESat-2), this dataset has the potential to be expanded to thousands of reservoirs and lakes in the future [59].
It is noted that large volume of research work was performed during the last decade on various bathymetry applications utilizing satellite techniques and innovations in monitoring water bodies; ranging from oceans to lakes and reservoirs of various sizes. To cite very few examples, one may mention some of them such as; Complete Remote Sensing Approach to Monitor Reservoirs Volume (2011) [61]; Bathymetric Mapping Using Landsat8 Scattered Imagery (2015) [62]; Lake Nubia Bathymetry Detection by Satellite Remote Sensing 2018 [63]. A New Digital Lake Bathymetry Model Using the Step-Wise Water Recession Method to Generate 3D Lake Bathymetric Maps Based on DEMs (2019) [64].
7. Reservoir Siltation and Catchments Erosion Observed by
Satellite Remote Sensing
Evaluation of sediments volume and its spatial distribution in any reservoir is an important factor in water management of river basins especially those on which dams and reservoirs are constructed. Sediments accumulation does not only affect the useful life of the reservoir and causes reduction of its storage, and hence water availability, whether for irrigation or/and power generation, but it will also affect its operation schedule, in addition to its impact in many cases on water quality. Increased sediment concentration can create turbid waters with a smaller euphotic zone which may have negative impacts on fish and bird species and causing abrasion of fish gills, thus increasing potential for diseases or mortality. Turbidity can also cause visual impairment for predatory fish, affecting their feeding habits. Conducting studies on sedimentation accumulation in any reservoir and its spatial distribution can be performed by conventional and remote sensing techniques. The conventional techniques of quantification of sediment deposition in a reservoir such as hydrographic surveys and the inflow-outflow methods, are cumbersome,
costly and time consuming, while on the other hand the alternative possible technique, which is the digital image processing of remotely sensed data is; easy, less costly and subjective of minimum human errors, and can be used for routine assessment of sedimentation in reservoirs. Remote sensing techniques use the fact, that the water spread area of reservoir at various elevations keeps on decreasing with the passage of time and recurrence of floods which bring fresh quantities of such sediments. Remote sensing satellite provides information regarding the water spread area of the reservoir at a particular elevation on the date of pass of the satellite which helps to estimate sedimentation in a reservoir over a period of time. The broad spectral range of available satellite remote sensing devices can provide synoptic, repetitive, and timely information regarding the sedimentation in a reservoir. Reduction, if any, in the water spread area for a particular elevation indicates deposition of sediments at that elevation [64].
Moreover, considering the fact that sediments carried to, and deposited in any reservoir originate from the drainage basin in which the reservoir is located, it follows that understanding of the factors leading to this; such as slope, soil type, land use within the drainage basin is important. The study of the factors contributing to the erosion process can help in taking preventive measures on such drainage basin. These actions may range between improving land use methods, stopping deforestation and enhancing vegetative cover, cultivating on terraces, and constructing silt check structures and control of gulling.
Studies based on remote sensing of the whole watershed area have been carried out in some cases to establishing the factors contributing to erosion and rating them in order to have the full view and the dimensions of the problem. An example of such a study is cited from the case of the Ramganga reservoir (India) and the contribution of its drainage basin to the problem [65].
The Ramganga dam is 128m earth fill dam that was constructed on the Ramganga River, a tributary of the Ganga River during 1961-1974 and it has a live storage capacity of 2,190 million cubic metres. It generates hydroelectric power and facilitates irrigation. The catchment area of Ramganga basin is approximately 32,493 km2 [66]. The study was performed using historical records of water level elevations from 1988-2001 and satellite data from LISS- III sensor [67] of the Indian Remote Sensing (IRS-1C) satellite launched on 28 December 1995 [68]. The study area was covered in Path 97, Row 50 of the satellite orbit, and the remote sensing data for the following dates were considered; 28 September 2000, 15 November 2009, 9 December 2000, 19 February 2001, 8 April 2001, and 2 May 2001. For the preparation of drainage area and contour map, Survey of Indian topographical maps 53-K/9, 10,11, 13, 14, and 15, 53O/1 and 2 at scale of 1: 50,000 were used. The Methodology that was followed in the study was carried out into two steps:
i. Watershed prioritization.
Watershed prioritization is the process of ranking different micro watersheds of the main watershed according to the order in which they have to be taken up for development.
Holistic integrated planning involving remote sensing, and it was found that (GIS) to be effective in planning on watershed approach [69, 70].
In the above mentioned study, the drainage network and contours of the study area were converted into digital formats based on topographical maps (1:50,000 scale) obtained from the Survey of India as mentioned, and for drainage networking and development of a digital elevation model (DEM), the GIS software (ILWIS) -“abbreviated from; Integrated Land and Water Information System”- was used. (ILWIS) has the capabilities to integrate image processing, tabular databases, and conventional GIS characteristics [71].
The reservoir catchment was divided into nine sub-basins based on the drainage network. The two parameters considered were: (i) the greenness index, to study the effect of vegetation; and (ii) the brightness index, to study the effect of soil and slope. The function “interpolation from iso-lines in (ILIWS)” was applied to each rasterized contour map to generate the DEM. Using the DEM, the slope for each sub-basin was estimated. For computation of other parameters, such as the greenness and soil brightness indices, tasseled cap transformation [72] in the ERDAS IMAGINE software was then applied [73].
For the quantification of the volume of sediments deposited in the reservoir, the basic information extracted from the satellite data are the reservoir surface areas at different water surface elevations. With the deposition of sediment in submerged areas of the reservoir, the area enclosed by an individual contour, at any elevation, decreases. Greater deposition of sediment causes greater decreases in the contour area. Using the synoptic satellite data and image interpretation techniques, the surface area of the reservoir at the instant of satellite overpass is determined. The decremental change in reservoir capacity between two consecutive levels is computed using the prismoidal formula. The overall reduction in capacity between the lowest and the highest observed water levels can be obtained by adding the decremental capacity at various levels. It is important to note that the amount of sediment deposited below the lowest observed level cannot be determined using remote sensing data. It is only possible to calculate the sedimentation rate within the particular zone of the reservoir. Hence, the volume of the reservoir below the lowest observed level is assumed to be the same before and after sedimentation. The study concluded that the average sedimentation rate in the Ramganga dam reservoir assessed using remote sensing for the period 1988–2000 was (4.28 × 10⁶ m3 per year). This was in reasonable agreement with the average sedimentation rate calculated from recurrent bathymetric surveys of (4.80 × 10⁶ m3 per year). As such, the study confirmed that using remote sensing techniques represents an economical as well as a practical alternative to the much more expensive and tedious conventional bathymetric surveys. As result of siltation, the reservoir appears to be losing, on average of 0.15% of its initial capacity every year; which is within the normal range of loss in similar environments. The watershed prioritization process
![Figure 4: Water surface elevation and surface area relationship for Fort Peck Reservoir [35]](https://thumb-eu.123doks.com/thumbv2/5dokorg/4426514.106488/12.813.217.640.253.646/figure-water-surface-elevation-surface-relationship-fort-reservoir.webp)
![Figure 5: Time series of reservoir storage estimated from remote sensing for Fort Peck Reservoir [35]](https://thumb-eu.123doks.com/thumbv2/5dokorg/4426514.106488/13.813.133.675.560.894/figure-series-reservoir-storage-estimated-remote-sensing-reservoir.webp)
![Table 2: Water Elevation-Area Relationships, Correlations, and Mean Absolute Errors [35]](https://thumb-eu.123doks.com/thumbv2/5dokorg/4426514.106488/17.813.58.774.151.918/table-water-elevation-area-relationships-correlations-absolute-errors.webp)
![Figure 8: Spatial distribution of small reservoirs in the Mzingwane catchment [42].](https://thumb-eu.123doks.com/thumbv2/5dokorg/4426514.106488/19.813.162.640.526.961/figure-spatial-distribution-small-reservoirs-mzingwane-catchment.webp)