COORDINATED INVENTORY CONTROL
- A case study on its performance compared to the current system at IKEA
Silvia Rasmusson
Björn Sunesson
Department of Industrial Management and Logistics,
Lund University, Faculty of Engineering
SE-221 00 Lund, Sweden
ABSTRACT
Unfortunately, it is today uncommon for companies to have a coordinated control applied in their inventory systems. Models that theoretically have the possibility to provide substantial savings are often disregarded because they are unknown to practitioners or considered too complex or too difficult to implement.
This article is based on a master’s thesis written in 2009 at Lund University, in cooperation with the company IKEA. A model developed to calculate reorder points using a coordinated approach has been used to show the affects it would have on a distribution system by comparing it to the current setup used by IKEA. The system investigated consisted of one distribution center and seventeen retail stores. The distribution center is refilled from an outside supplier. The comparison was done by simulation in the discrete event simulation software Extend.
The project illustrates that the use of a coordinated inventory approach can significantly reduce inventory without decreasing service levels. The largest relative reductions appear at the distribution center, while the mean inventory at the retail stores only change slightly.
1. BACKGROUND
There are today a large number of theories and studies on how an inventory system should be controlled in order to satisfy the customers and at the same time keeping stock levels as low as possible to reduce costs for keeping inventory. Most of these theories result in an optimized control of each installation independently, which are then put together in a system. It is fairly easy to understand that this system of connected optimal single inventories will only be sub optimized and that a better solution could be
reached if the inventories could share information and the same goal.
The idea with a coordinated approach is that the total inventory system aims to meet the end customer demand and that the total amount of stock is minimized. This implies that a bad service experienced between the different levels of inventories is not seen as an issue, as long as the end customers are satisfied. The method for doing so is to use a model where all installations share the costs for lost customers.
This paper is based on such a model developed at the division of Production Management at Lund University, Faculty of Engineering. The model used to optimize the system has been previously tested on real case scenarios but only on low demand spare articles. This is thus the first time it has been used on end consumer pattern with high demand. The model aims to optimize reorder points rather that order quantities for a given system.
All data used during the course of the project was taken from IKEA’s ERP system. Some of them had to be processed in order to fit the analytical model and the simulation. Some approximations had to be done due to the limitations of the available data, the major one being demand which was here assumed to be equal to sales.
2. OBJECTIVE
The purpose of the project was to investigate how a model for controlling a multi level inventory system could be used to calculate reorder points for IKEA’s distribution centers and retail stores. The analysis was done by looking at how the service level target was reached as well as how much the inventories could be reduced if a coordinated inventory control method was implemented, instead of the uncoordinated control system used today (Rasmusson and Sunesson, 2009).
Page 1 of 4
The case study was conducted using a sample of articles and the corresponding real case data from a geographically limited area. All articles included were replenished from one single distribution center. The chosen articles were taken from different price, frequency and service level categories. This means that even though only a fraction of the total number of articles was considered, the results of the project could be made general and applied to a large number of other articles.
3. METHODOLOGY
The most suitable methodological approach for the project was thought to be to conduct an operations research modeling (Hillier & Lieberman, 2005). This included following the suitable steps of the following six major ones:
1. Define the problem of interest and gather relevant data
2. Formulate a mathematical model to represent the problem
3. Develop a computer-based procedure for deriving solutions to the problem from the model 4. Test the model and refine it as needed
5. Prepare for ongoing application of the model as prescribed by management
6. Implement
Since the model for calculating reorder points already existed, the second step was not exactly followed, as the mathematical base to the analytical model already existed. Instead the focus was put on building a simulation model (step 3) to enable testing of the results from the analytical model (step 4). Due to the time frame, step five and six are left undone and left for management to decide upon. The simulation was done for each article independently and each article was simulated twice with the reorder points as the only changed parameter. First, the current reorder points were used, and then the reorder points calculated by the analytical model.
4. ASSUMPTIONS
As with all models, there are a number of assumptions that has to be made. The analytical model used in this paper to calculate reorder points assumes the following (Andersson and Marklund, 1999):
• The transportation times at all levels are constant • There is no risk for shortages at supplier, which
means that the lead time to the distribution center is always constant and equal to the transportation time
• All order quantities are fixed and pre determined • A complete delivery policy is followed, which
means an the entire order needs to be available at the distribution center before it is sent to the retail store
• A continuous review policy means that the order is placed exactly when the reorder point is reached. In reality this might be done at the time of a periodic inspection
• End customers demand follow a normal distribution
• A back order system means that both customer and retail stores wait for the item to be available in case of empty stock
The assumptions made in the simulation model were the same as above with these two exceptions (Rasmusson and Sunneson, 2009):
• Customer demand follows a compound Poisson distribution with logarithmic compounding distribution. That means the time between arrivals is exponential distributed and the number of items taken follows a logarithmic distribution. • The end customers are lost in case of empty stock
5. THEORETICAL FRAME OF REFERENCE
The main idea behind the analytical model used is to, with a coordinated approach, calculate the optimal reorder points. It might be interesting to also study the order quantities, but during the project these were assumed to be constant.
The model is based on minimizing the sum of the systems total holding costs and shortage costs by decomposing the initial system. To connect the distribution center to the retail stores, an induced shortage cost is introduced (Berling and Marklung, 2006). This means that each time a customer does not receive the product immediately the distribution center shares the shortage cost with the retail store. The induced shortage costs for every retail store is then weighed together, using mean demand to weigh different stores differently. When the distribution center has only one shortage cost, it is easy to optimize the reorder point by using calculations for a single level inventory (Andersson and Marklund, 1999).
With the reorder point at the distribution center, it is possible to calculate the expected lead time for each retail
Page 2 of 4
store, as the probability of stockouts at the distribution center can be determined. Finally, when the average lead time is known for the retail stores, the optimal reorder points can be calculated (Andersson and0 Marklund, 1999).
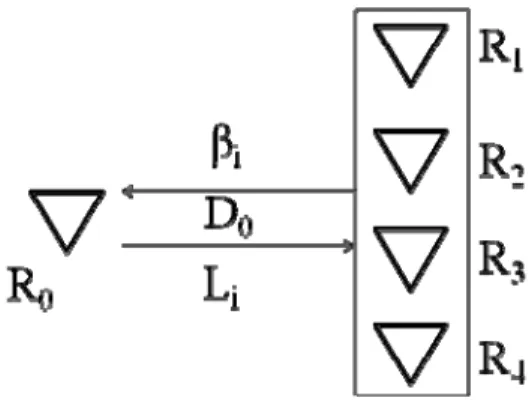
The model is illustrated in Figure 1 below, and following that is a short summary of the steps.
Figure 1 Conceptual model of the analytical model
1. Determine the induced backorder cost for each retail store and then for the distribution center 2. Determine the demand distribution at the
distribution center
3. Determine the optimal reorder point at the distribution center
4. Calculate the average lead time for the retail stores
5. Determine the optimal reorder point for each retail store
6. RESULTS
The output extracted from the simulation runs focused on service and mean inventory. Service is the fraction of demand that could instantly be taken from inventory (called fill rate or SERV2). The results were compiled and presented below. See Rasmusson and Sunesson, 2009 for more discussion on the results.
To start with, the service experienced using the current reorder points are analyzed. The chart in Figure 2 divides the articles according to the deviation in percentage points of the system service from the target service level.
Figure 2 Service deviation with the current setup
It is obvious that the current setup performs poorly in many of the cases. For nearly half of the simulations the deviation from target was more than 5 percentage points below target service. About one third experienced relatively good service (-5 to 5 percentage points deviation) compared to target, and a small amount had a service above 5 percentage points from target.
Figure 3 below does the same analysis for the simulation using the reorder points calculated with the coordinated approach. It shows that the system service is relatively close to target which implies that a coordinated system performs well in terms of satisfying end customers.
Figure 3 Service deviation using a coordinated setup
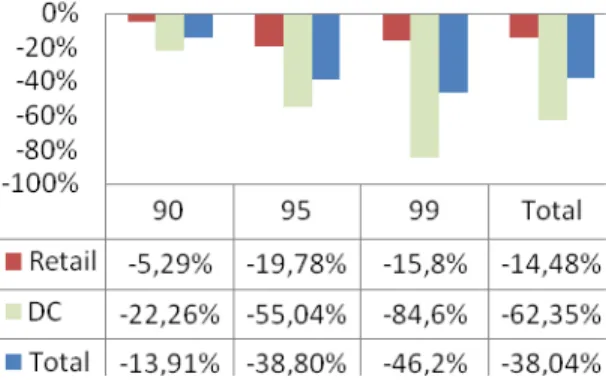
The second result parameter extracted from the simulation is mean inventory. Figure 4 shows how the inventory using the coordinated approach is reduced compared to the current setup. The comparison below is done only for the articles that, with the current approach, had a system service within 5 percentage points from target service. This group of articles has similar system services for both
Page 3 of 4
approaches and is therefore seen is a good sample when analyzing change in inventory.
Figure 4 Change in inventory levels from current
When classifying the articles according to service level, the relation between retail stores, distribution center and total reductions are almost maintained throughout the different classes. What is notable though, is that the reductions are larger with higher service level targets. The total distribution center inventory reductions for the class with highest service target are almost 90 percent, as opposed to 20 percent for the lowest service class. The reason for this is that, the distribution center does not need a service level at par with the service level at retail stores. It is interesting to compare the system service for the DC for the different approaches, which was 82% for the current setup and 49% with coordinated control. So with higher current service levels at the distribution center, larger reductions can be made without losing service to customers.
7. CONCLUSIONS & RECOMMENDATIONS
By studying the output parameters of the coordinated case, it was clear that the approach managed to keep the service at acceptable levels at the retail stores. This means that the fraction of satisfied customers was close to the target service. Thus, the model can be said to give accurate reorder points.
When comparing the differences in inventory levels, it was notable that for a comparable service level at retail level, the service at the distribution center was much lower with the coordinated approach, 49,3% in average, compared to 82,7% for the current approach. This reduction was expected, as the model is based on the idea that the important service is the one experienced by customers.
As implied from the service numbers, the average inventory levels at the distribution center were also lower with the coordinated approach. This also means that the
costs associated with keeping stock are also reduced, such as space, handling and tied up capital costs.
We recommend IKEA to continue study the possibilities to implement a coordinated inventory control to the articles passing through distribution centers. Implementing the approach will reduce the total inventory cost which in turn also affects other inventory decisions, such as the fraction of direct delivery. The most obvious areas to continue with the studies are to improve the quality of the input parameters and to improve the comparison with the current system. The data should be taken for a longer period of time, demand data should be on daily basis and order quantities more accurate. This will lead to a more precise and reliable base for an eventual decision to use the coordinated approach.
8. REFERENCES
Andersson Jonas and Marklund Johan Decentralized inventory control in a two-level distribution system. Lund : Elsevier, 1999. Andersson Jonas, Axsäter Sven and Johan Marklund Decentralized Multiechelon Inventory Control. Lund, 1998.
Berling Peter and Marklund Johan Heuristic Coordination of Decentralized Inventory Systems Using Induced Backorder Costs. Lund. 2006. Hillier Frederick S. and Lieberman Gerald J. Introduction to operations research. Boston : McGraw-Hill, 2005.
Rasmusson Silvia and Sunesson Björn. Coordinated inventory control-A case study on its performance compared to the current system at IKEA. Lund. 2009.
Page 4 of 4