Statens väg- och trafikinstitut (VTl) Fack 58101 Linköping å Nr 44 1977 National Road & Traffic Research Institute : Fack S-58101 Linköping Sweden
-= Systems analysis of road traffic
44
'
(Abbreviated version of Internrapport No. 160)
by Gösta Gynnerstedt
:tens väg- och trafikinstitut (VI'I) . Fack ' 581 01 Linköping
Nr 44 ' 1977
tional Road & Traffic Research Institute Fack S-581 01 Linköping Sweden
Systems analysis of road traffic
|I4
(Abbreviated version of Internrapport No. 160)
by Gösta Gynnerstedt
I N N E H Å L L S F Ö R T E C K N I N G 1.1 1.2 1.2.1 1.2.2 1.3 3.1 3.2 3.2.1 3.2.2 3.2.3 3.3 SUMMARY
SYSTEMS APPROACH
The physical road traffic system
The controlling administrative system The decision model system
The information system
Summary
LIMITATION TO RURAL ROAD TRAFFIC
THE TOTAL SYSTEM
Policy and measures On a strategic level Operational measures
Road geometric design' Vehicles
Driver
Measures of effectiveness
THE ROAD TRAFFIC PROCESS
Simplified description of the process Choice of method - simulation
The simulation model
VTI MEDDELANDE 44 h ub -W M R ) 10 11 11 13 16 16 18 18
Systems analysis of road traffic
(Abbreviated version of Internrapport nr 160) by Gösta Gynnerstedt
National Swedish Road and Traffic Research InStitute
Fack
8-581 01 LINKÖPING SWEDEN
SUMMARY
Increasing road maintenance costs Increasing road-user costs
The adverse non-user effects of road traffic Inadequate traffic safety
Limited energy resources Economic constraints
These are all factors which demand a broadening and deepening of the deCision process used to maintain the road traffic system. In this paper a short summary is presented of a systems analysis approach regarding the need of information about the traffic process in order to Optimise the road traffic system.
Interest is focused on the rural traffic process. The approach is to regard the process as part of a control
system.
The controlling unit consists of the administrating
system with its inherent decision process and a related information system. In principle, the approach enables an Optimization of the road traffic system with respect to a concept of transport quality (e.g the level of
service concept.) Analysis has shown that the simulation technique is the only feasible method to describe the
traffic process. (This enables a study of several
inter-acting measures of effectiveness due to one or a combi-nation of measures.)
In the last chapter of the paper different applications are enumerated, some of which are already in progress.
II
The Simulation model was first applied in a study of climbing lanes. This research work was presented to
the National Swedish Road Board in January 1975. The
technique has also been applied (1976) in a study of the European road E4. Simulations of a road stretch of 32 km were performed in order to test alternative levels of improvement to the existing road. Currently, the technique is being applied to study the effects of different feasible road widths for a stretch of the
road RBl.
Experience gained from these applications is used in
an ongoing develOpment of the technique.
The research work is divided into four.integrated.activities,
o System analysis approach summarized in this paper
0 Development of a road traffic simulation model
o DevelOpment of equipment for field studies to collect traffic data. This also involves an
integrated data processing system for the
vali-dation of the simulation
model-. Application of the simulation technique and its implementation in the decision process.
This research work has been performed since 1969 at the National Swedish Road and Traffic Institute (VTI) at the request of the National Swedish Road Board.
Since 1976 the Department of Transport (U;K) has co-operated with the VTI in order to implement the simu-lation technique as an aid to evaluating minor
improve-ments in the British rural road network.
SYSTEMS APPROACH
In order to maintain, improve and develOp a system, and to adjust it to other interacting systems with regard to costs and values within restricted economical re-'sources, relevant knowledge is needed regarding
the prOperties of the system
the consequences of different feasible measures -the consequences of different uncontrollable factors
0 the system's positive and negative environmental.
effects
-In order to analyse the system with respect to the
questions formulated aboveuäthe system and its environ-ment must be defined, as well asäåh7wü _ut and output of the system and their relationships.
In a systems analysis approach the problem of vehicular traffic may be formulated as one part of a hierarchical socio-technological control system, governed by an ad-ministrative system. This approach permits a logical macrosc0pic expansion of the traffic system with regard
to other interacting systems. It also permits research into the microscopic properties of the traffic system. The administrative decision problem in question then determines which levels in the system's hierarchy should
be taken into account in the analysis of the problem.
The aim of this approa5h\has been to create greater con-sistency between applied research on different levels of the system and to transfer this consistency to the administrative decision process.
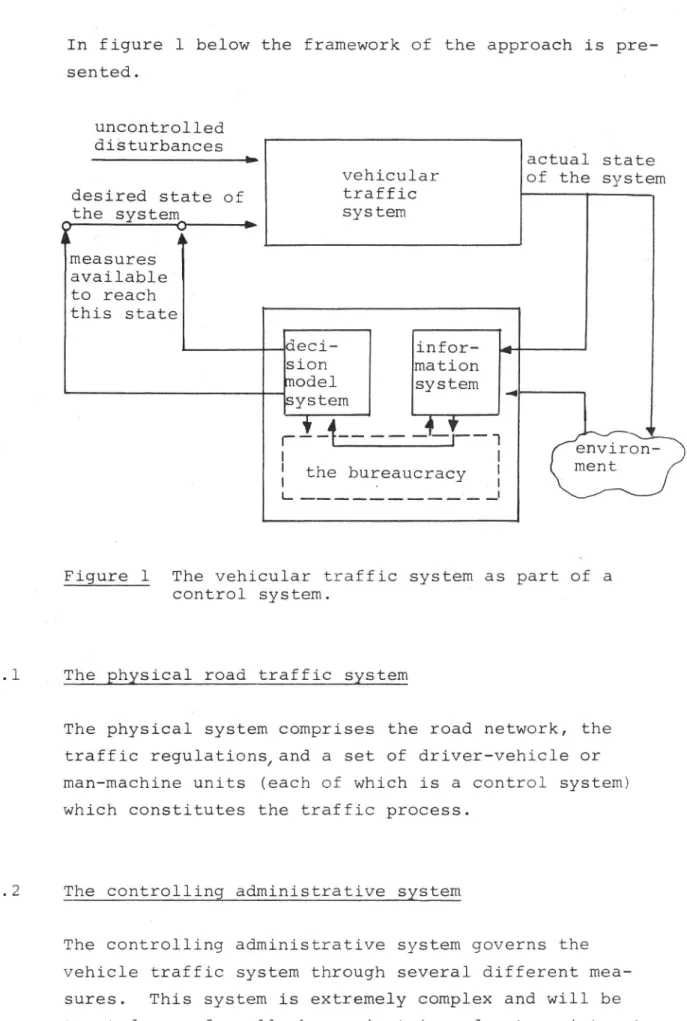
In figure l below the framework of the approach is
sented. uncontrolled diSturbances . = actual state
. vehicular of the system
desired state of traffic
the system system
o---+ A measures available' to reach this state deci- infor- n sion mation mOÖEl system Ål system
'P 1
__4J __
i__._ __._. environ-I ment o_r- 1.
:
IFigure l The vehicular traffic syStem as part of a
control system. '
The physical road traffic system
The physical system comprises the road network, the traffic regulations/and a set of driver-vehicle or
man-machine units (each of which is a control system)
which constitutes the traffic process.
The controlling administrative system
The controlling administrative system governs the vehicle traffic system through several different mea-sures. This system is extremely complex and will be treated very formally here, just in order to point out
the structure of the decision process, and relevant in-formation for the decisions. It is divided into three subsystems, viz:
1. The bureaucracy
2. The decision model system 3. The information system
The bureaucracy here is supposed to govern the traffic
system rationally, so its transfer function is Simplified to a unit function. This is apprOpriate to the aim of this approach but of course a simplification not justi-fied with regard to a study of the bureaucracy itself.
Ihs_ês9;§29§_m9ésl_§2§§sm
The demand of the decision process has changed markedly during the last decade. In the sixties the main purpose of traffic policy was to develop a road network to
satisfy the journey speed demand of increasing vehicular
traffic.
To-day the authorities face a different decision
situa-tion; long term planning in accordance with the overall
develOpment of society; demand for safer traffic; traffic
as an ecological system with regard to the environment; and traffic with constrained resources (e.g fuel and
cost).
These circumstances have increased demand for a broader
decision process and this has brought about the need for a deeper understanding of traffic behaviour.
The administrative process has been described by E Jantz (2) as a multilevel decision problem on political,
strategical and Operational levels. This approach will
be used to indicate the need for traffic information
.2.
for the determination of
0 a desired state of the system
_measures available on different levels to obtain and maintain this state
0 information from the traffic system relevant
to the control system
Ibs_;9§9§mê2292_§y§§sm
The content of the information system is very broad. It contains information about the road, the traffic regulations introduced on the road and about the traffic. In Sweden an advanced road-data bank is
established containing this type of information on the major road network.
The information system also contains information about the environment.
The contents of the information system should be defined by the needs of the decision model system. However, the cost/benefit aspect of these contents may also have to be taken into account.
Summary
In this chapter the principle of the systems approach has been described. The traffic system has been regarded as a control system whose inputs are measures of diffe-rent levels, which enable a desired state of the system to be attained. The actual state of the traffic system and the consequences of the measures introduced consti-tute the output. The decisions will be influenced by
the output, and also by reactions from the environment. The traffic system is then the transfer function between
input and output.
In the following chapters 2 and 3 the available measures pwill be specified, and in chapter 4 the transfer function
will be described.
LIMITATION TO RURAL ROAD TRAFFIC
In the following, interest will be focused On the effi-ciency of the traffic process in the rural tWo lane, two way road network associated with the comprehensive decision problem mentioned above.
The reasons for focusing on this particular problem are: 0 The national major road network outside build-up
areas consists mainly of two lane two way roads and a large proportion of the total vehicle
kilo-metrage occurs on these. Consequently a large
proportion of the budget is allocated to this 'road network.
0 It seems obvious that the available resources for road construction will be limited in the 'future and mainly allocated to maintenance and
improvements to the existing road network.
o Higher annual traffic flows will be required to justify a particular road width. Consequently two lane roads will also substitute for motorways.
V T I M E D D E L A N D E 4 4 MEASURES BY AUTHORITIES
11
\\
\\*\Strategic Operational ALICNMEHT - vertical - restrict VEHICLE DRIVER - desired ROAD FACTORS CROSS SECTION '- lanc widths * shoulder widths « shoulder pavement . auxiliar - horizontal SIGHT DISTANCE TRAFFIC REGULATION - speed limit - arrangement of axles - horsepower-mass ratio- inclination for passing
y lane'
ion of passing
speed
Eggure 2, TOtal system
RESOURCES AVAILABLE V. 4A. . Hur...,
K
.in 1 V RANSPOR'551% '
,
._ fp/
_.//V _4 TRAFFIC VOLUME TRAFFIC COMPOSITION T R A F F I C P R 0 C E S S ..MEASURES OF EFFECTIVENESS OPERATIONAL COSTS E.G. - consumption of time - consumption of petrol
ri' ... COMFORT
_.TRAFFIC'SAFETYfTHE TOTAL SYSTEM
The purpose of introduction a control system was two-fold. The decision process was looked upon as a cont-rolling device and the road traffic system as a dynamic process which has to be optimised. 'The desired state thus is the optimised traffic system.
The desired state so far has been expressed by the road
geometric design standard. It is evident however that the optimalisation needs relevant system variables
ex-pressing its dynamic qualities. The level of service
concept gives an expression of the quality of the traffic system. The system variables or measures of effective-ness describing this quality of the traffic process - constituting the output of the traffic system - are
functions of the road geometric design, the traffic regulations and other legistative measures, the
proper-ties of the driver-vehicle units, the traffic volume, the traffic composition, and environmental factors;
The different demands of the adminiStrative decision process have been discussed as described in figure 2 below. Changes in these enumerated factors are the measures that influence the quality of the traffic
pro-cess. In figure 2 these changes constitute the input of the controlled traffic system.
It was pointed out in the previous chapter that the
decision process contained measures on strategic and
operational levels. The problem of how to transport goods is strategic when considering the demand for transport or the best mode of tranSportation; On the other hand it is an operational problem when consideê ring a proposal for the maximum length of heavy commer-cial vehicles.
Policy and measures on a strategic level
The concepts demand and need in figure 2 are not
neCes-sarily synonymous. In the sixties the objectives of
long-term planning were more or less aimed at satisfying
the actual or predicted demand of the road users. Be-cause of limited resources and the actual situation
described in 1.2.3 above, an objective need for
trans-port in society has to be identified. This need is not always expressed explicitly. The objective for the policy must then be to adjust the three circles in the Venn-diagram so that they overlap maximally by use of the strategic measures available. The policy and
stra-tegic measures chosen will affect the traffic volume
and its composition.
Operational measures
The operational measures will be identified more expli-citly in the following. Measures here taken into account comprise the road geometry, the traffic regulations,
the driver and the vehicle.
.2. 10
BQêê-9§9TêEElE_§ê§lQQ
o road width number of lanes shoulder width 0 alignment horizontal alignment vertical alignment0 sight distance available
The number of lanes is at least two. Added lanes (e.g. crawling lanes) are also taken into account. The lanes are always paved. The shoulder width varies up to 3 m. The shoulder is usually paved. If paved it may be used momentarily as a lane for overtaking provided that it
is broad enough. The traffic behaviour thus varies on roads with regards to the shoulder width, and added lanes. Shoulder widths less than 1 m are not used for overtaking.
The horizontal alignment is defined by the radii of the
consecutive bends.'The vertical alignment is described as a polygon along
the road.
The sight distance is also described as a polygon along
the road. One sight distance polygon is given in each direction.
Ganeral speed limits are taken into account as well as
local speed limits, varying from 50 km/h to 110 km/h.
(Nuespeedsoi-heavy commercial vehicles and caravans are individually restricted; this is taken into account not here, but in the driver properties described below.
3.2.3
ll
Prohibition of overtaking is introduced whenever the _sight distance is less than a certain minimum length or
if justified for other reasons (e.g. crossings or
junc-tions).
yebislsê
o 'Power/mass ration (p-value)
0 Number of axles
These two parameters specify the type of vehicle taken into account. They enable a description of fast sport
cars as Well as the heaviest articulated vehicles.
In-directly the length of a heavy vehicle can be derived from these parameters. The p-Value of the vehicle is
generated from distributions for four different vehicle
classes - these are differentiated by the number of axles.
QEÅYêE
The desired speed is often a very intuitive concept. Briefly it can be understood here as the speed of a
free moving driver-vehicle unit.
1. On a straight level road without limiting roadwidth. 2. Without speed restrictions.
3. With a given p-value of the vehicle.
The inclination to overtake is specified for different
de-overtaking
restric-traffic situations regarding actual road geometri (e.g.
tions and the prOperties of the driver-vehicle units sign and traffic regulations
involved). Thus the vehicle type and the speed
diffe-rence is taken into account as well as the sight
dis-tance available and any oncoming vehicles that may be
present.
12
The desired speed is randomly sampled from a desired speed distribution and assigned to each driver-vehicle unit in accordance with its number of axles and power/mass ratio. It is then reduced to take into account the road geometry, the speed limits, and the power/mass ratio of the vehicle. In this way the mean speed profile of free moving vehicles in a sample under consideration is calculated. The sample in question is chosen with
regard to the actual traffic composition in the problem under consideration. In the driver-vehicle unit the
driver represents "the will" and the vehicle "the ability". To make the discussion more concrete the consequenses
of the following measures may be studied. l. Change in traffic volume
la. Due to time
lb. Due to legistative measures
lc. The change of capacity limit due to assymmetric flow in the two direCtions. This phenomenon in-fluences the system effects very much and appears more and more frequently with an increased traffic flow.
Change in traffic composition
2.1 Change in the percentage of heavy commercial
vehicles - the percentage is now regarded as con-stant but empirical results indicate a more or less constant flow of HCVs and a fluctuating flow of cars.
3. Change in road geometric design
3.1 Change in the design road width for a given annual traffic flow
3.2 Introduction of additional lanes
3.3 Change in the minimum design standards for the road alignment
3.4 Change in the minimum design standard for sight length
Change in traffic regulations
Change in general speed limits
b »[ 5 JÄ då 0 0 0 l
.2. Change in the speed limit of commercial vehicles 3 Change in overtaking restrictions according to
13
road geometric design, traffic flow and composi-tion. This question is closely connected to 3.4 above.
5. Change in regulations affecting vehicle performance. 5.1 Introduction of a minimum power/mass-ratio for
HCVs. This is closely connected to:
f. 0
the criteria for climbing lanes
0 'the dimensional parameters of the vertical
align-ment '
0 the speed limit of HCVs
5.2 Change in the maximum length of HCVs with regard to their frequency, the need of overtaking, and the difficulty to overtake.
6. Change of the driver's performance in terms of his adaptability to the traffic flow with regard to 0 the dispersion of the speed distribution 0 Violations of the speed limit
0 the choice of situation for overtaking
The measures enumerated above are just examples of possible parameter changes available. In a through systems approach the parameters should be studied with
regard to the systems effect and the objectives, goals,
and value judgements.
Measures of effectiveness
In the previous chapter, different system variables have been discussed as measures available to the authorities I in order to modify the system. The question now is:
what measures of effectiveness will be relevant to ex-press the different traffic responses of the modifica-tionS?
Effects in the traffic process generally could be both tangible and intangible. A value judgementcan be/put upon certain tangible effects such as journey time, fuel consumption, etc.
l4
There has been a widespread opinion that only quanti-tative effects capable of being expressed numerically should be taken into account. Objections could be raised, but they lead to a complex problem which will
not be discussed here.
The output in figure 2 shows the measures of
effective-ness taken into account. In principal the following demands can be Specified.o Measures of effectiveness reguested by economic models to estimate the road user cost
o Measures of effectiveness answering to the level of
service concept
'This means that both tangible and intangible effects are derived.
The road user costs are primarily furnished by 0 journey time consumption
o fuel consumption
To estimate the number of accidents directly from a traffic model is not yet practicable but some solutions to produce an estimate in an indirect way are under investigation.
The number of overtakings and their localisation along the road is determined as well as the status of the driver-vehicle unit as free-flowing or hindered. Thus the kilometrage separated into
a free flowing units o followers
15
as functions of the road coordinate can be derived. From this type of information the "comfort" - included in "the level of servise" concept - can be derived. The question then is what value judgement should be put upon this factor.
If the three states could be connected to corresponding
types of accident, then the problem would be solved, i.e.
free moving kilometrage - single accidents overtaking kilometrage - overtaking accidents follower kilometrage - the rest of two-vehicle accidents
It should be noticed that the changes in the percentages of kilometrage due to modifications of a system variable could be prOportional to a Corresponding change in
accidents of the different types. The eStimated number of accidents could then be derived from existing accident prediction models.
l6
THE ROAD TRAFFIC PROCESS
In order to ascertain the necessary connections between
the measures of effectiveness taken into account, the
traffic process itself has to be more thoroughly under-stood. Thus the block "traffic process" in the middle of figure 2 is described in more detail in figure 3. The traffic process represents the transfer function between the previously described input (the measures) and output (the measures of effectiveness).
Simplified description of theyprocess
A Simplified description of the road traffic process is given in figure 3. The process consists of a feed-back lOOp system. Thus the actual speed distribution is
de-pendent on both the traffic volume and its composition,
and some of the input parameters described above - e.g. road geometry, traffic regulations and behaviour of the road-users.As may be seen from figure 3, the statistical
characte-ristics of the speed distributiondetermine the number of "catchings-up". If the dispersion 0:0, no "catching up" takes place.
The driver who catches up is offered possible overtaking opportunities dependent on the input parameters and on-coming traffic.
The possible overtaking situations are accepted to a certain extent. The number of accepted overtaking si-tuations then influences the speed distribution by a feed-back loop.
V T I M E D D E L A N D E 44
TIUH FI(T CH/ULÄCWWH{ISUKICS
I)IFLTH§EN-TTATED BY TRAFFIC CATEGORY AS FUNCTIONS OF TRAFFIC FLOW AND COMPOSITION I
TRAFFIC VOLUME TRAFFIC COMPOSITION
JOURNEY SPEED DISTRIBUTIONt==r JOURNEY TIME DISTRIBUTION
mean value dispersion ROAD WIDTH i ALIGNMENT SPEED LIMIT DESIRED SPEED
-á-w-Fr-brNUMBER OF "CATCHINGS UP"
POWER/MASS RATIO ROAD WIDTH
OVERTAKING RESTRICTIONS SIGHT DISTANCE AVAILABLE
__--- POSSIBLE OVERTAKING 1=, SITUATIONS
' ...4
INCLINÅTION TO OVERTAKE
.__uü_m__ ACCEPTED OVERTAKING---i' NUMBER OF OVERTAKINGS
POWER/MASS RATIO
SITUATIONS./
PERCENTAGE OF
4] HEADWAY _ ___ _"__+ - FREE MOVING VEHICLES
jQUEUE LENGTH QUEUE FRBQUENCY
\
DISTRIBUTION
gigqre 3. Traffic process
18
I The number of accepted overtaking situations also in-fluences the headway distribution. The headway distri-bution in one direction influences the number of possible overtaking situations in the oncoming traffic through a feedback loop as indicated above.
As the traffic process is very complex the consequences of a change in a system variable can be very unpredic-table. For instance, the introduction of a climbing lane results in a change in the headway distribution beyond the climbing lane. Thus the number of possible overtaking situations in the opposite direction decreases and the traffic in this direction suffers a journey
time delay.
Choice of method * simulation
In order to reproduce the traffic process in accordance with figure 3 with regard to those measures which have to be taken into account, the simulation technique has been applied. Although it seems that it has not yet been applied elsewhere for this purpose, the technique also promises to be a useful tool for the traffic en-gineer. The usefulness stems mainly from two facts:
0 The phenomena involved are so complex that a
total mathematical analysis is virtually impossible. . It is difficult, costly and sometimes impossible
to make a change and perform the evaluation of it in the real world. Once a valid_simulation model
is constructed, even radical modifications to the
system may be simulatedyand evaluated with relative ease.
The simulation model
The simulation model is an aggregate of submodels con-sisting of different kinds of behavioural models and a vehicle dynamics model. The models are related to
road geometry, traffic regulations and the driver-vehicle Characteristics shown in figures 2 and 3. These sub-models consist essentially of three parts:
o submodels for "free flow traffic"
submodels for traffic with interactions
submodels for generating vehicle-driver units and their traffic situation, i.e. spot speed and time headway.
The submodels have been treated thoroughly in separate reports in Swedish and have been summarized in English.