J
Ö N K Ö P I N GI
N T E R N A T I O N A LB
U S I N E S SS
C H O O L JÖNKÖPING UNIVERSITYR e v e r s e St o c k Sp l i ts
An Empirical Approach to the Signaling and Trading Range Hypotheses on
Swedish Stocks Subject to Reverse Split between 1995 and 2004
Master’s thesis within Financial Economics Author: Abbe Fransson
Tutor: Agostino Manduchi Jönköping Spring 2005
Master’s Thesis
Master’s Thesis
Master’s Thesis
Master’s Thesis with
with
within
with
in
in
in Financial Economics
Financial Economics
Financial Economics
Financial Economics
Title:Title: Title:
Title: Event Study of the Effects of Reverse Stock SplitsEvent Study of the Effects of Reverse Stock SplitsEvent Study of the Effects of Reverse Stock SplitsEvent Study of the Effects of Reverse Stock Splits---- An Empirical An Empirical An Empirical An Empirical Approach to the Signaling and Trading Range Hypotheses on Approach to the Signaling and Trading Range Hypotheses on Approach to the Signaling and Trading Range Hypotheses on Approach to the Signaling and Trading Range Hypotheses on Swedish Stocks Subject to Reverse Split between 1995 and 2004 Swedish Stocks Subject to Reverse Split between 1995 and 2004 Swedish Stocks Subject to Reverse Split between 1995 and 2004 Swedish Stocks Subject to Reverse Split between 1995 and 2004 Autho
Autho Autho
Author:r:r: r: Abbe FranssonAbbe FranssonAbbe FranssonAbbe Fransson Tutor:
Tutor: Tutor:
Tutor: Agostino ManduchiAgostino ManduchiAgostino ManduchiAgostino Manduchi Date
Date Date
Date: Spring 2005Spring 2005Spring 2005Spring 2005 Subject terms:
Subject terms: Subject terms:
Subject terms: Reverse split, bidReverse split, bidReverse split, bid----ask spread, trading volume, nonReverse split, bidask spread, trading volume, nonask spread, trading volume, non----trading days, ask spread, trading volume, non trading days, trading days, trading days, lilililiqqqquidityuidityuidityuidity
Abstract
This paper addresses reverse splits for firms trading on the Stockholm stock exchange between 1995 and 2004. The related sample are tested for abnormal returns surrounding the announcement day of the reverse split, as well as any changes in bid-ask spread, trading volume and the number of non-trading days. No findings of abnormal returns or significant changes in either bid-ask spread or trading volume could be found, while the number of non-trading days for the whole sample increased. This may suggest that that the marketability decreased for the reverse splitting firms.
Magister
Magister
Magister
Magister uppsats inom
uppsats inom
uppsats inom
uppsats inom finans
finans
finans
finansiell ekonomi
iell ekonomi
iell ekonomi
iell ekonomi
Titel:Titel: Titel:
Titel: Event Study of the Effects of Reverse Stock SplitsEvent Study of the Effects of Reverse Stock SplitsEvent Study of the Effects of Reverse Stock SplitsEvent Study of the Effects of Reverse Stock Splits---- An Empirical An Empirical An Empirical An Empirical Approach to the Signaling and Trading Range Hypotheses on Approach to the Signaling and Trading Range Hypotheses on Approach to the Signaling and Trading Range Hypotheses on Approach to the Signaling and Trading Range Hypotheses on Swedish Stocks Subject to Reverse Split between 1995 and 2004 Swedish Stocks Subject to Reverse Split between 1995 and 2004 Swedish Stocks Subject to Reverse Split between 1995 and 2004 Swedish Stocks Subject to Reverse Split between 1995 and 2004 Författare:
Författare: Författare:
Författare: Abbe FranssonAbbe FranssonAbbe FranssonAbbe Fransson Handledare:
Handledare: Handledare:
Handledare: Agostino ManAgostino ManAgostino ManAgostino Manduchiduchiduchiduchi Datum Datum Datum Datum: Spring 2005 Ämnesord Ämnesord Ämnesord
Ämnesord Omvänd split, köpOmvänd split, köpOmvänd split, köpOmvänd split, köp----sälj ratio, handels volym, handelsdagar, likvsälj ratio, handels volym, handelsdagar, likvsälj ratio, handels volym, handelsdagar, likvsälj ratio, handels volym, handelsdagar, likviiiiditetditetditetditet
Sammanfattning
Den här uppsatsen behandlar företag som är listade på Stockholmsbörsen som gjorde omvänd split mellan 1995 och 2004. Företagen är testade för abnormal avkastning kring tillkännagivandet av den omvända spliten, samt förändringar i köp-sälj ratio, handels volym och antalet handelsdagar där ingen handel skedde i aktien. Inga abnormala avkastningar eller signifikanta förändringar i köp-sälj ration eller handelsvolymen kunde hittas. Däremot så visar förändringen i antalet handelsdagar utan handel i aktien en försämring och antalet handelsdagar minskade i de aktier som genomgått en omvänd split. Detta medför att likviditeten minskade för de företag som genomförde en omvänd split.
Table of contents
1
Introduction... 3
1.1 What is the motive for a reverse split? ... 3
2
Theoretical Framework ... 5
2.1 Signaling Hypothesis... 5
2.2 Trading Range Hypothesis... 5
2.2.1 The affect upon liquidity from reversed splits... 5
3
Sample and Methodology ... 7
4
Results and Analyses ... 9
4.1 Changes in Bid-Ask Spread, Trading Volume and Number of Non-Trading Days... 9
4.2 Abnormal Returns Surrounding the Announcement Day... 13
5
Concluding Remarks... 15
Reference list... 16
ii
Tables
Table 4.1.1 – Change in Average Bid-Ask Spread between pre- and post- Reverse Split Period... 10 Table 4.1.2 – Change in Trading Volume between pre- and post- Reverse
Split Period ... 11 Table 4.1.3 – Change in the number of Non-Trading days between the pre-
and the post- Reverse Split ... 12 Table 4.1.4 – Number of Stock with at least One Non-Trading Day... 13 Table 4.1. 5 – Number of Stock with a Change in the Number of Non-Trading
Days ... 13 Table 4.2.1 – Test for Zero Abnormal Return Around the Announcement Date of Reverse Splits ... 14
Abbe Fransson Introduction 2005-08-04
1
Introduction
A reverse split is a substitution of a certain number of outstanding shares for one new share. Thence, the share price increases after the reverse split. The reasons for reverse stock splits are not as well understood as regular stock splits. The common notion is that a firm elects to reverse split in its stock as a mean to enhance its image among investors, increase the liquidity in the stock and to reduce shareholder expenses if commission fees are based on the number of stocks, or number of round lots, traded (Han, 1995). Therefore, one could expect that shareholders derive benefits from reversed splits and consequently the market response to be favorable in its reactions to these splits. However, this does not seem to be the case. Among others, Spudeck and Moyer (1985) reports that stock returns decrease on the announcement date of reversed splits. Woolridge and Chambers (1983) even suggest that when a reversed split is impending, investors should sell their shares.
In the light of the mentioned studies, why would managers carry out reverse splits when it has negative effect on the shareholders? Consequently, why do the shareholders approve a reverse split in the first place? This study addresses the unresolved effects from reverse splits and intends to cast further light on whether there are any notable effects in terms of return or enhanced marketability for the shareholders.
1.1
What is the motive for a reverse split?
Management can use financial decisions to send messages to investors (Ross, 1977); in the finance context this is called signaling. Stock splits can be such a signaling tool. Most often, Spudeck and Moyer (1985), among others, argue, reverse splits seem to be characterized as a strong signal to the market of management’s lack of confidence in future stock price increases as a result of earnings improvement. This spins out to a signaling hypothesis, which in this paper is tested for by looking for potential abnormal returns around the announcement day of the reverse split.
Han (1995) list several works claiming that transaction costs are inversely related to share price, and further propose that transaction costs with fixed elements must decrease after a reverse split. If transaction costs decrease, it should imply that the liquidity of the stock increases. Although, the brokers trading on the Stockholm Stock Exchange charges a commission as a percentage of the value of the trade. Accordingly, this should not be an argument for reverse splits on the Swedish stock market. Han (1995) points out that, in most cases, reverse splits are not driven by the dictated rules of an exchange.
There is another reason to believe that a reversed split would increase liquidity. In the trading range hypothesis it is suggested that stock splits regroup share prices to a preferred price range (Ikenberry, Rankine and Stice, 1996). Lakonishok and Baruch (1987) state that an optimal price range is when stock prices attract investors. Smaller investors might be unable, or unwilling, to buy shares if the per share price is too high (Lakonishok and Baruch 1987). Han (1995) points out that a share price that is too low is an indication of poor performance, and further that institutions tend to avoid low priced shares since there is higher probability that their purchase will be questioned. Managers who are willing to attract both the small investors and the large and institutional ones should seek to have a price that is preferable to both of them. According to Gray, Smith and Whaley (2003) 93.7 percent of the managers in splitting companies claim that their motive for split is to induce the number of stock holders. Thus, it is reasonable to believe that shareholders would
Abbe Fransson Introduction 2005-08-04
4
benefit from a reversed split because a higher price will attract more capital intensive investors.
This study finds no support for the trading range hypothesis, a result that is inconsistent with both the findings of negative abnormal returns made by Han (1995) or Desai and Jain (1997) as well as the discovery of positive abnormal returns made by Masse, Hanrahan and Kushner (1997). In the search for a substantiation or dismissal of the trading range hypothesis the different measures of liquidity gives different results. The results from the test on the bid-ask spread show no indication of change following from reverse split. Earlier research, on the other hand, shows both a decrease (Nelling and Chen, 2002) in the bid-ask spread as an increase (Han, 1995), but still a significant change following the reverse splits. This paper does neither find any support for the trading range hypothesis from the test on the changes in trading volume, consistent with the findings made by Nelling and Chen (2002), while inconsistent with the findings by Han (1995) who finds an increase in trading volume after reverse splits. The only notable effect from the reverse splits was found in the change in the number of non-trading days. In contradiction to Han (1995), who finds a decrease in the number of non-trading days, the sample tested in this thesis finds an increase in the number of non-trading days. A result that speak against the trading range hypothesis, since the marketability decreased in terms of the number of non-trading days.
The remainder of the paper is structured as follows. Chapter 2 contains a more thorough explanation of the related hypotheses and how they can be evaluated. Chapter 3 is a briefing on the data sample and how it has been processed before the tests and also a brief description on how and what tests that were used. Chapter 4 contains the actual testing and analyzing of the data set. To assure the test results are valid, a control group is formed and compared in the same manner as the actual data set from the firms that conducted reversed splits. Chapter 5 concludes and summarizes the paper.
Abbe Fransson Theoretical Framework 2005-08-04
2
Theoretical Framework
2.1
Signaling Hypothesis
Given asymmetric information between managers and investors, management can use financial decisions to send messages to the investors; see, among others, Ross (1977). Stock splits can be such a financial mean. Most often a split is considered to be a positive signal of future performance. On the other hand, in the case of reverse stock splits, Spudeck and Moyer (1985), among others, argue that reverse splits seem to be characterized by of the management’s lack of confidence in the ability of future stock prices to increase, as a result of earnings improvement. Furthermore, they report that stock returns decrease on the announcement date of reversed splits (Spudeck and Moyer, 1985). Hence, the sample in this study will be tested for abnormal returns in the days surrounding the announcement of the reverse splits. Since this paper is an event study the assumption is that the market understands and implements new information directly. Accordingly, if abnormal returns can be found, the signaling hypothesis will hold for the related sample. As a point of order, Lakonishok and Baruch (1987) argue that despite many authors often mention the signaling hypothesis, there is not much evidence that substantiates and empirically proves the hypothesis.
2.2
Trading Range Hypothesis
The trading range hypothesis proposes that stock splits regroup share prices to a preferred price range (Ikenberry et al. 1996). Hansson (1999) claim that an optimal price range is when stock prices are sufficiently low, in actual money terms, to attract investors. Smaller investors might be unable, or unwilling, to buy shares if the price is too high. Lakonishok and Baruch (1987) and Han (1995) argue that on the other hand we have the wealthy investors and institutions. These authors point out that a share price that is too low is an indication of poor performance, and further, that institutions tend to avoid low priced shares since there is higher probability of their actions being questioned after the purchase. The arguments claim that the optimal price range equilibrates the preferences of both types of investors. Managers interested in having a broad variety of share holders or a higher liquidity might work to reach such a price range by using stock splits. Questionnaires examined by Baker and Gallagher (1980) on manager’s motives for stock splits reveal that 93.7 percent motivate the split with the hope that it will increase the number of stock holders. How could you distinguish any affect from reverse splits in correlation with the trading range hypothesis? Well, if the reverse split would enhance the attractiveness of the stock, the liquidity of the stock increases.
2.2.1 The affect upon liquidity from reversed splits
Basically, the definition of liquidity is how easy and fast it is able to sell an asset in exchange for some other resource without changing the market price of the original asset. Consequently, cash is most often considered the most liquid asset. Why is the liquidity of a stock important? In the arbitrage-pricing-model, there are multiple factors that with their individual risks create a relation to the return of an asset (Ross, Westerfield and Jaffe, 2005). Essentially, factors that could affect the lowest return of a security, should offer compensation to the holder of that security. It seems possible that the liquidity of an asset qualifies to be included among the factors determining a securities price in an
arbitrage-Abbe Fransson Theoretical Framework 2005-08-04
6
pricing-model. Investors like liquidity and therefore they are willing to accept lower rates of returns if stocks are liquid (Pastor and Stambaugh 2001). The higher the chance that investors might need to retrieve their money, the higher liquidity is demanded. Implementing that if the trading range hypothesis would hold, the liquidity would be augmented by reverse splits. The problem for most people dealing with liquidity is that the concept, at least in the finance context, is elusive.
2.2.1.1 Measuring liquidity
In the finance context there are some different approaches to measure liquidity, or perhaps to be more precise the degree of liquidity. Holmström and Tirole (1993) define liquidity as the difference in bid-ask spread and the amount that can be traded. Amihud and Mendelsson (1991) suggests that the bid-ask spread is inversely related to liquidity. The higher the liquidity, the lower the spread. US treasure bills often has a spread close to 0.008 percent of their price and illiquid stocks may be between 5 and 10 percent of their value (Amihud and Mendelsson, 1991).
Other authors, for instance Brennan, Chordia and Subrahmanyam (1998), suggest the trad-ing volume is a better measure of liquidity than the bid-ask spread. They point to the fact that volume is easy to measure and to use in analyses (Brennan et al. 1998).
According to Han (1995), a functional measure of liquidity is the number of non-trading days. The motivation that is commonly used to warrant the test on the number of non-trading days is that non-non-trading is negatively related to the liquidity of a stock. Because reverse split stocks typically have low trading frequency, the liquidity effect, if any, can be captured by a change in the number of non-trading days (Han, 1995).
In order to minimize any possible objective view towards the measure of liquidity, this study adopts all three of the above mentioned measures. As can be seen in the later parts of this paper, the different measures might provide results that do not coincide with each other. It is not a self fulfilling prophecy that changes in liquidity will be permeated to the same extent, or at all, in all the different measures of liquidity. The measures will thus be tested and analyzed individually to see whether any changes in liquidity followed from the reverse splits. Any changes in liquidity should emerge from the ex-date rather than the announcement day (Han, 1995). If such changes can be found, the trading range hypothesis will hold.
Abbe Fransson Sample and Methodology 2005-08-04
3
Sample and Methodology
In search for an empirical substantiation or dismissal of the signaling hypothesis this paper looks for abnormal returns surrounding the announcement day of the reverse splits. If such can be found, the signaling hypothesis holds. Pursuing any empirical evidence for the trading range hypothesis, this thesis is looking for changes in the bid-ask spread, trading volume and the number of non-trading days. In order for the changes to be reflective of the trading range hypothesis the bid-ask spread should decrease, the trading volume increase and the number of non-trading days should decrease.
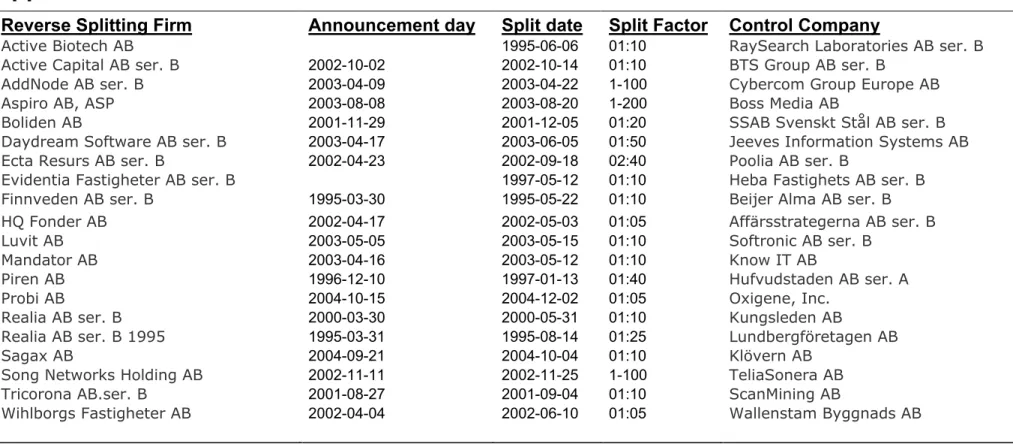
The sample of the 20 reverse splitting firms are formed on the basis that they where reported in either Börsguide 1997, 2000, 2004, or at the Swedish media provider Affärsdata, to be subject to split in the period from 1995 to 2004. For the tests on the bid-ask spread, volume and number of non-trading days individual data from the period -50 days to +50 from the ex-date of the split are collected. The day of the split is set to day 0. All data for the individual stocks were collected from the official webpage of the Stockholm stock exchange.
The bid-ask spread is defined following Han (1995),
) ( * ) 2 / 1 ( jt jt jt jt jt BP AP BP AP SP + − =
where; APjt is the ask price of j at time t, and BPjt is the bid price of stock j at time t.
Hence, SPjt represents the bid-ask spread of stock j at time t as a fraction of stock price. The trading volume collected is the raw number of shares traded, and the number of non-trading days is simply the sum of the respective firm’s days without any non-trading. The trading volume in the post reverse split period is adjusted by the split factor to be comparable to the pre reverse split volume.
To ensure the tests validity regarding any notable changes in bid-ask spread, trading volume or number of non-trading days a control group of firms that did not reverse their split during the related time period were formed. Every reverse splitting firm is matched with a firm operating in the same sector, and the matched firm’s individual data correspond to the timeframe for the individual data for the splitting firm.
Following the procedure of Hansson (1999) a small sample t-test1 for no difference between the changes for the two samples were conducted in order to see whether any changes can be traced to reverse splitting. A Wilcoxon test is done in order to check if the result from the t-test is driven by outliers (Han, 1995). A Wilcoxon test is a nonparametric alternative to t-tests. The test assumes that there is information in the magnitudes of the differences between paired observations, as well as the signs. The procedure is done by taking the paired observations, calculate the differences, and rank them from smallest to
1 This paper takes a detour regarding which appropriate t-test is being used. Hansson (1999) uses a matched
pair t-test, while this study, due to only 20 reverse splitting firms, uses a small sample t-test to check if the pre and post periods are different.
Abbe Fransson Sample and Methodology 2005-08-04
8
largest by absolute value. Add all the ranks associated with positive and negative differences, separately, giving the T+ and T- statistic. By taking the lower of the T+ and T
-statistic and looking in an appropriate table we find the p-value For a more detailed description on the procedure of the tests be advised to look into Statistics (McClave and Sincih, 2000). The reasoning for the test on the three measures of liquidity are achieved following Han (1995), while the method for looking for changes between the period are in line with the tests done by Hansson (1999).
In the examination of the stock return behavior around the announcement day of the reverse split, in order to look for a confirmation of the signaling hypothesis, this study adopts the conventional ordinary least square market model method to calculate abnormal return (AR):
(
m)
jt
jt R R
AR = − α +β
where, ARjt = abnormal return for stock j, day t;
Rjt = actual return for stock j, day t; and
Rm = the return on the related market index;
α, β = the market model estimations for the control period (Kusnadi and Sohrabian, 1999)
The term (α+ βRm) is often referred to the expected rate of return. The expected return is
estimated by the market model2 over day -110 to day -11 relative to the announcement day through the following regression;
t m
jt R
R =α +β +ε
The null hypotheses for the estimates of α and β are
0 : 0 : 1 0 ≠ = α α H H and 1 : 0 : 1 0 ≠ = β β H H
, respectively. The results from the regressions will be provided upon request to the author. In the tests on the signaling hypothesis two of the firms were excluded, due to lack of a registered announcement day.
The results from the tests on any proof of correlation for the two stated hypotheses and the sample used in this thesis are seen in section 4.
2 The Stockholm All Share Index has been used as the proxy to measure abnormal returns against. Also, the
test were conducted, but not presented, using the sector index were the reverse splitting firms are included. The result was very similar and resulted in the same conclusion.
Abbe Fransson Results and Analyses 2005-08-04
4
Results and Analyses
4.1
Changes in Bid-Ask Spread, Trading Volume and
Num-ber of Non-Trading Days
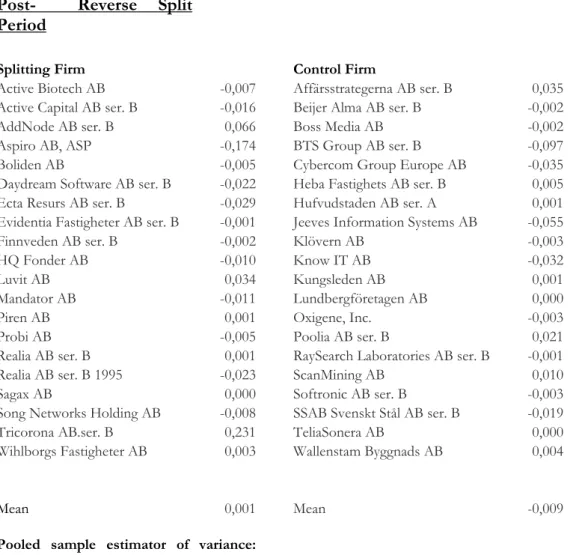
The results from the tests on the bid-ask spread can be seen in table 4.1.1. The second and fourth column display the change in bid-ask spread for the split group and the control group, respectively. The bid-ask spread changes does not show any significant difference between the sample and control group (t-value = 0.588). The Wilcoxon test cannot either distinguish any difference between the sample and the control group. In addition, in this sample, the liquidity, measured as the bid-ask spread, was not improved by the reversed splits. However, this is inconsistent with the results found by Han (1995) on US stocks, who finds that the liquidity measured by the bid-ask spread increases. Further, our finding is also inconsistent with the discovery made by Nelling and Chen (2002) who finds a decrease in bid-ask spreads following reverse splits.
In table 4.1.2 the results from the test on the change in trading volume can be seen. The trading volume show no significant changes for the reverse splitting firms compared to the control group (t-value = 1.086). An outcome supported by the Wilcoxon test. A result inconsistent with the findings made by Han (1995), who finds that trading increases after the execution day of the reverse splits. On the other hand the result is coinciding with the findings made by Nelling and Chen (2002).
Abbe Fransson Results and Analyses 2005-08-04
10
Table 4.1.1
Change in Average Bid-Ask Spread between the Pre- and Post- Reverse Split
Period
Splitting Firm Control Firm
Active Biotech AB -0,007 Affärsstrategerna AB ser. B 0,035 Active Capital AB ser. B -0,016 Beijer Alma AB ser. B -0,002
AddNode AB ser. B 0,066 Boss Media AB -0,002
Aspiro AB, ASP -0,174 BTS Group AB ser. B -0,097
Boliden AB -0,005 Cybercom Group Europe AB -0,035
Daydream Software AB ser. B -0,022 Heba Fastighets AB ser. B 0,005 Ecta Resurs AB ser. B -0,029 Hufvudstaden AB ser. A 0,001 Evidentia Fastigheter AB ser. B -0,001 Jeeves Information Systems AB -0,055
Finnveden AB ser. B -0,002 Klövern AB -0,003
HQ Fonder AB -0,010 Know IT AB -0,032
Luvit AB 0,034 Kungsleden AB 0,001
Mandator AB -0,011 Lundbergföretagen AB 0,000
Piren AB 0,001 Oxigene, Inc. -0,003
Probi AB -0,005 Poolia AB ser. B 0,021
Realia AB ser. B 0,001 RaySearch Laboratories AB ser. B -0,001
Realia AB ser. B 1995 -0,023 ScanMining AB 0,010
Sagax AB 0,000 Softronic AB ser. B -0,003
Song Networks Holding AB -0,008 SSAB Svenskt Stål AB ser. B -0,019
Tricorona AB.ser. B 0,231 TeliaSonera AB 0,000
Wihlborgs Fastigheter AB 0,003 Wallenstam Byggnads AB 0,004
Mean 0,001 Mean -0,009
Pooled sample estimator of variance: 0,028
t-statistics for Zero difference between the samples: 0,588 (not significant at the 0,05 level) df = 38
Wilcoxon test T-: 98
T+: 112
Lowest rank needed for 95% significance: <52
Abbe Fransson Results and Analyses 2005-08-04
Table 4.1.2
Change in Trading Volume between the pre- and post- Reverse Split Period
Splitting Firms Control
Active Biotech AB 2181 Affärsstrategerna AB ser. B 653 Active Capital AB ser. B 8937 Beijer Alma AB ser. B 1580
AddNode AB ser. B 104692 Boss Media AB 370326
Aspiro AB, ASP 37706130 BTS Group AB ser. B 16057
Boliden AB 921006 Cybercom Group Europe AB 4317
Daydream Software AB ser. B -49390 Heba Fastighets AB ser. B 1750 Ecta Resurs AB ser. B 4666 Hufvudstaden AB ser. A 131844 Evidentia Fastigheter AB ser. B -6007 Jeeves Information Systems AB 977
Finnveden AB ser. B -4217 Klövern AB 4010
HQ Fonder AB 5717 Know IT AB -1829
Luvit AB 7447 Kungsleden AB -24466
Mandator AB -157062 Lundbergföretagen AB 12660
Piren AB -2061524 Oxigene, Inc. 11601
Probi AB 36589 Poolia AB ser. B 34718
Realia AB ser. B 28490 RaySearch Laboratories AB ser. B 2874
Realia AB ser. B 1995 8774 ScanMining AB 2382
Sagax AB -135144 Softronic AB ser. B -54316
Song Networks Holding AB 3575034 SSAB Svenskt Stål AB ser. B 2641
Tricorona AB.ser. B 68939 TeliaSonera AB -1579039
Wihlborgs Fastigheter AB -720 Wallenstam Byggnads AB -7249
Mean 2003227 Mean -53426
Pooled sample estimator of variance: 35842965382353
t-statistics for Zero difference between the samples: 1,086 (not significant at the 0,05 level) df = 38
Wilcoxon test T-: 88
T+: 123
Lowest rank needed for 95% significance: 52
Table 4.1.2 – Change in Trading Volume between pre- and post- Reverse Split Period
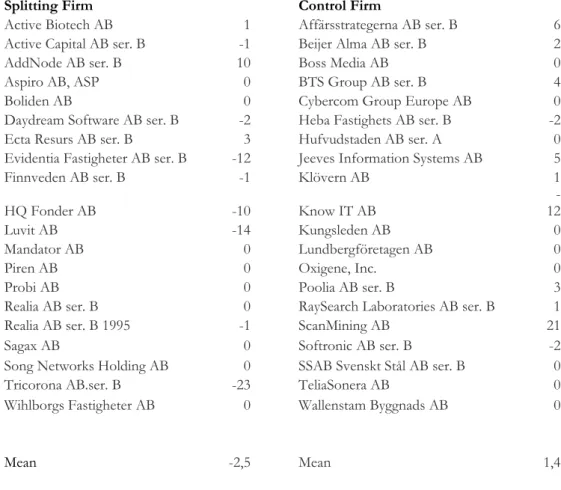
In table 4.1.3 the results from the test on the change in the number of non-trading days are displayed. For the reverse splitting firms, the number of non-trading days increased by 2.5 days3, simultaneously the number of non-trading days for the control group diminished by 1.4 days. The t-statistics on the difference between the both periods is significant at the 0.05 level, a result supported by the Wilcoxon test. Hence, liquidity, for this sample, measured as the number of non-trading days actually worsened by the reverse splits. A
3 The calculation is done by taking the pre- reverse split number of trading days less the number of
non-trading days in the post reverse split period; hence a negative value means an increase in the number of non-trading days.
Abbe Fransson Results and Analyses 2005-08-04
12
finding that is out of line with the results found by Han (1995), where the number of non-trading days decreased after the reverse split.
Ta-b le 4.3.3 – Change in the number of Non-Trading days between the pre- and the post- Reverse Split
Table 4.1.4 display the result from a Chi-square test on the difference between the changes in number of stocks with at least one non-trading day for the two different groups. For significance at the 0.05 level, Chi-square value should be greater than or equal to 3.84. The distribution is not significant; hence there cannot be any conclusion on whether the reversed splits had any affect on the number of at least one non-trading day firms.
Table 4.1.3
Change the number of non-trading days between the Pre- and Post- Reverse Split Period
Splitting Firm Control Firm
Active Biotech AB 1 Affärsstrategerna AB ser. B 6 Active Capital AB ser. B -1 Beijer Alma AB ser. B 2
AddNode AB ser. B 10 Boss Media AB 0
Aspiro AB, ASP 0 BTS Group AB ser. B 4
Boliden AB 0 Cybercom Group Europe AB 0
Daydream Software AB ser. B -2 Heba Fastighets AB ser. B -2 Ecta Resurs AB ser. B 3 Hufvudstaden AB ser. A 0 Evidentia Fastigheter AB ser. B -12 Jeeves Information Systems AB 5
Finnveden AB ser. B -1 Klövern AB 1
HQ Fonder AB -10 Know IT AB
-12
Luvit AB -14 Kungsleden AB 0
Mandator AB 0 Lundbergföretagen AB 0
Piren AB 0 Oxigene, Inc. 0
Probi AB 0 Poolia AB ser. B 3
Realia AB ser. B 0 RaySearch Laboratories AB ser. B 1
Realia AB ser. B 1995 -1 ScanMining AB 21
Sagax AB 0 Softronic AB ser. B -2
Song Networks Holding AB 0 SSAB Svenskt Stål AB ser. B 0
Tricorona AB.ser. B -23 TeliaSonera AB 0
Wihlborgs Fastigheter AB 0 Wallenstam Byggnads AB 0
Mean -2,5 Mean 1,4
Pooled sample estimator of variance: 42,8
t-statistics for Zero difference between the samples: 151,8 (Significant at the 0,05 level) df = 38
Wilcoxon test T-: 43
T+: 167
Lowest rank needed for 95% significance: <52
Abbe Fransson Results and Analyses 2005-08-04
Table 4.1.4
Number of Stocks with at least One Non-Trading Day
Splitting firms Control group Total
Increase 8 12 20
Decrease 10 11 21
Total 18 23 41
Degrees of freedom: 1
Chi-square = 0.241453876236485 (Not significant at the 0.05 level)
Table 4.4.4 – Number of Stock with at least One Non-Trading Day
In table 4.1.6 the results from a Chi-square test on the difference between the changes in the number of firms with a change in the number of non-trading days are displayed. The number of non-trading days increased for the reverse splitting firms, while they decreased for the control group. A result significant at the 0.05 level. Implementing that liquidity measured as the number of non-trading days actually decreased for the reverse splitting firms. Here the findings are opposite to the findings made by Han (1995).
Table 4.1.5
Number of Stocks with a Change in the Number of Non-trading Days.
Splitting firms Control group Total
Increase 8 3 11
Decrease 3 8 11
Total 11 11 22
Degrees of freedom: 1
Chi-square = 4.54545454545455 (Significant at the 0.05 level)
Table 4.1. 5 – Number of Stock with a Change in the Number of Non-Trading Days
4.2
Abnormal Returns Surrounding the Announcement Day
The results from the tests on the cumulative average abnormal returns can be seen in table 4.1. For none of the days surrounding the announcement day there are any significant indication of abnormal returns for the reverse splitting firms. The announcement hypothesis does not accordingly hold for this reverse splitting sample. This is not consistent with the findings made by Han (1995), Desai and Jain (1997) or Masse et al. (1997). Han (1995) and Desai and Jain (1997) finds negative abnormal returns on the announcement day and the consecutive day, but not in the rest of the days in the event window, a result that Han claims to be consistent with earlier studies. Masse et al. (1997) on the other hand finds positive abnormal returns around the announcement day of reverse splits for stocks trading in the Canadian Stock exchanges, and conclude that it appears that in Canada a reverse split announcement can be regarded as a positive signal.
Abbe Fransson Results and Analyses 2005-08-04
14
Table 4.2.1
Test for Zero Abnormal Return Around the Announcement Date of Reverse Splits
Event Day Cumulative Average Abnormal Return t-Statistics
-5 -0,32 -0,01 -4 -1,57 -0,08 -3 -2,54 -0,14 -2 -5,96 -0,37 -1 -6,23 -0,47 0 -5,99 -0,64 1 -7,41 -0,56 2 -6,01 -0,37 3 -6,81 -0,36 4 -8,45 -0,4 5 -8,01 -0,35
Abbe Fransson Concluding Remarks 2005-08-04
5
Concluding Remarks
This study investigated whether there were any effects from reverse stock splits that can be attributed to the signaling hypothesis and/or the trading range hypothesis. Unfortunately the sample of reverse splitting firms was only consisting of 20 firms, which in every instance needed to be tested to see whether the data were normally distributed or not. If there would be any effect consistent with the signaling hypothesis we should see abnormal returns in the immediate aftermath from the announcement from the split. Within the related sample tested throughout the paper, no such findings could be made and, hence, we cannot put forward any support of the signaling hypothesis.
In the testing made upon any noteworthy affect in line with the trading range hypothesis this study relied upon notable changes in liquidity. Due to no universally accepted measure of the degree of liquidity, three individual proxies for liquidity were tested individually. The results from the three measures differ largely. Liquidity defined as either the bid-ask spread or the trading volume showed no tendency to be improved by the reverse splits. Thence, no definite conclusion can be drawn regarding the affect upon the bid-ask spread and the trading volume as a result from a reverse split. The third proxy for liquidity was the number of non-trading days. The total number of non-trading days increased for the reverse splitting sample, while decreased for the control group. A result supported by both the t-statistics and the Wilcoxon test. Here, the liquidity actually perked down as the trend in the reverse splitting sample were to increase their number of non-trading days, while the control group showed the opposite trend.
The purpose of this thesis was to cast light on whether there were any effects for shareholders springing out of reverse splits in the form of either abnormal return or changes in marketability. The only notable effect was the negative one indicated by a decreased marketability in the form of a decrease in the number of non-trading days. To completely sort out the nature of the effect from reverse splits, there is much research still left to be done. For further research there might be of importance to try to evaluate what individual order or rank the common notion of the measures of liquidity should have, if there is one. Of course, a larger sample is of importance to be able to completely rule out the effect of having few observations.
Abbe Fransson Reference list 2005-08-04
16
Reference list
Amihud Y; Mendelson H “Liquidity, Maturity, and the Yields on U.S. Treasury Securities” The Journal of Finance, 46, 1991, pp. 1411-1425
Baker K.H; Gallagher P.L “Management’s view on stock splits” Financial Management, 9, 1980, pp. 73-77
Benet B.A; Harris R.S; Conroy R.M “The Effects of Stock Splits on Bid-Ask Spreads” The Journal of Finance, 45, 1990, pp. 1285-1295
Brennan M; Chordia T; Subrahmanyam A “Alternative factor specifications, security char-acteristics, and the cross-section of expected stock-returns” Journal of Financial Economics, 49, 1998, pp. 345-373
Desai H; Jain P.C “Long-Run Common Stock Returns following Stock Splits and Reverse Stock Splits” The Journal of Business, 70, 1997, pp. 409-433
Gervais S; Kaniel R; Mingelgrin D “The High-Volume Return Premium” The Journal of Finance, 56, 2001, pp. 877-919
Gray S.F; Smith T; Whaley R.E “Stock splits: implications for investor trading costs” Jour-nal of Empirical Finance, 10, 2003, pp. 271-303
Holmström B; Tirole J “Market liquidity and Performance Monitoring” Journal of Political Economy, 5, 1993, pp. 678-709
Ikenberry D.L; Rankine G; Stice E.K “What Do Stock Splits Really Signal?” Journal of Financial and Quantitative Analysis, 31, 1996, pp. 357-375
Han K.C “The Effects of Reverse Splits on the Liquidity of the Stock” The Journal of Financial and Quantitative Analysis, 30, 1995, pp. 159-169
Hansson M “Stock Splits, Liquidity, and Trading Activity” Swedish School of Economics and Business Administration, 1999, Helsinki, Finland
Lakonishok J; Baruch L “Stock Splits and Stock Dividends: Why, Who and When” The Journal of Finance, 42, 1987, pp. 913-932
Lippman S.A; McCall J.J “An Operational Measure of Liquidity” The American Economic Review, 76, 1986, pp. 43-55
Masse I; Hanrahan J.R; Kushner J “The Effect of Canadian Stock Splits, Stock Dividends, and Reverse Splits on the Value of the Firm” Quarterly Journal of Business and Economics, 36, 1997, pp. 51-61
McClave J.T; Sinchih T “Statistics, eight edition” Prentice Hall, Inc., Upper Saddle River, USA, 2000
Nelling E.F; Chen Y “Reverse Stock Splits: Microstructure Effects and a Nonparametric Analysis of the Ex Date Return” LeBow College of Business, Drexel University, Philadelphia, USA
Abbe Fransson Reference list 2005-08-04
Ross S.A. “The Determination of Financial Structure: The Incentive-Signaling Approach” The Bell Journal of Economics, 8, 1977, pp. 23-40
Ross S.A; Westerfield R.W; Jaffe J “Corporate Finance”, McGraw-Hill/Irwin, New York, USA, 2005
Spudeck R.E; Moyer R.C “Reverse Splits and Shareholder Wealth: The impact of commissions.” Financial Management, 14, 1985, pp. 52-56
Woolridge J.R; Chambers, D.R 1983 “Reverse Splits and Shareholder Wealth.” Financial Management, 12, pp. 5-15
Internet Resources
http://www.omxgroup.com/stockholmsborsen/
Pastor L; Stambaugh R.F 2001 “Liquidity Risk and Expected Stock Returns” Retrieved 2005-01-13 from http://gsbwww.uchicago.edu/fac/finance/papers/liquidity.pdf
Kusnadi J; Sohrabian, A 1999 “The Impact of Insurance Mergers on Shareholder Returns” Retrieved 2005-01-13 from http://www.csupomona.edu/~jis/1999/sohrabian.pdf
Abbe Fransson Reference list 2005-08-04
18
Appendix
1Reverse Splitting Firm Announcement day Split date Split Factor Control Company
Active Biotech AB 1995-06-06 01:10 RaySearch Laboratories AB ser. B
Active Capital AB ser. B 2002-10-02 2002-10-14 01:10 BTS Group AB ser. B
AddNode AB ser. B 2003-04-09 2003-04-22 1-100 Cybercom Group Europe AB
Aspiro AB, ASP 2003-08-08 2003-08-20 1-200 Boss Media AB
Boliden AB 2001-11-29 2001-12-05 01:20 SSAB Svenskt Stål AB ser. B
Daydream Software AB ser. B 2003-04-17 2003-06-05 01:50 Jeeves Information Systems AB
Ecta Resurs AB ser. B 2002-04-23 2002-09-18 02:40 Poolia AB ser. B
Evidentia Fastigheter AB ser. B 1997-05-12 01:10 Heba Fastighets AB ser. B
Finnveden AB ser. B 1995-03-30 1995-05-22 01:10 Beijer Alma AB ser. B
HQ Fonder AB 2002-04-17 2002-05-03 01:05 Affärsstrategerna AB ser. B
Luvit AB 2003-05-05 2003-05-15 01:10 Softronic AB ser. B
Mandator AB 2003-04-16 2003-05-12 01:10 Know IT AB
Piren AB 1996-12-10 1997-01-13 01:40 Hufvudstaden AB ser. A
Probi AB 2004-10-15 2004-12-02 01:05 Oxigene, Inc.
Realia AB ser. B 2000-03-30 2000-05-31 01:10 Kungsleden AB
Realia AB ser. B 1995 1995-03-31 1995-08-14 01:25 Lundbergföretagen AB
Sagax AB 2004-09-21 2004-10-04 01:10 Klövern AB
Song Networks Holding AB 2002-11-11 2002-11-25 1-100 TeliaSonera AB
Tricorona AB.ser. B 2001-08-27 2001-09-04 01:10 ScanMining AB
Wihlborgs Fastigheter AB 2002-04-04 2002-06-10 01:05 Wallenstam Byggnads AB