MIRIAM
22
Comparison of Rolling
Resistance Measuring
Equipment - Pilot Study
Anneleen Bergiers, BRRC Luc Goubert, BRRC
Fabienne Anfosso-Lédée, IFSTTAR Niels Dujardin, DRI
Jerzy A. Ejsmont, TUG Ulf Sandberg, VTI Marek Zöller, BASt
MIRIAM, SP1 Deliverable No. 3 Final version 2011-12-31
Table of contents
Table of contents...1
Foreword ...4
Acknowledgements ...5
Abbreviations and acronyms...6
1. Introduction...8
2. Purpose of the study...9
3. Measurement devices...10
3.1 Trailers used in measurements on site...10
3.2 Drum measurements in laboratories...12
4 Test location and surfaces...15
4.1 Test track...15
4.2 Test track surfaces...15
4.3 Texture of the test sections...19
4.3.1 Texture spectra...19
4.3.2 Mean Profile Depth...21
4.3.3 Homogeneity...22
4.3.3.1 Transversal...22
4.3.3.2 Longitudinal...23
4.3.4 Intercorrelation of one-third-octave band texture levels...23
5 Tyres...25
5.1 Characteristics...25
5.2 Tyre pressure and load...26
5.3 Wheels...26
6 Measurement program...27
6.1 Comparison tests of the three measuring devices...27
6.1.1 BASt...27
6.1.2 BRRC...27
6.1.3 TUG...28
6.2 Additional tests to explore certain features...28
6.2.1 Tyres (TUG/ BASt)...28
6.2.2 Speed influence (TUG)...28
6.2.3 Warm-up (BRRC)...28
6.2.4 Influence of wheel adjustment (BRRC)...29
6.2.5 Cement concrete (BRRC)...29
7 Measurement procedure...30
8 Measurement results...31
8.1 Wind...31
8.2 Temperature correction...31
8.3 Repeatability of the RR devices...32
8.3.1 BASt...32
8.3.1.1 Short term repeatability...32
8.3.1.2 Day-to-day repeatability...33
8.3.2 BRRC...35
8.3.2.1 Short term repeatability...35
8.3.2.2 Day-to-day repeatability...36
8.3.3 TUG...36
8.3.3.1 Short term repeatability...36
8.3.3.2 Day-to-day repeatability...37
8.4 Reproducibility of the RR devices...37
8.4.1 BASt – TUG...38
8.4.1.1 All measurements...38
8.4.1.3 Relation between BASt and TUG SRTT tyre measurements...41
8.4.1.4 Relation between BASt and TUG AAV4 tyre measurements...42
8.4.2 BRRC – TUG...44
8.4.2.1 All measurements...44
8.4.2.2 Relation between BRRC and TUG ES14 tyre measurements...45
8.4.3 BASt - BRRC...47
8.4.3.1 All measurements...47
8.4.3.2 Relation between ES16/BASt and ES14/BRRC tyre measurements.48 9 Additional tests...50
9.1 Tyres...50
9.1.1 Measurements...50
9.1.2 Tyre related corrections...51
9.1.3 Trailer related differences...58
9.2 Speed influence...61
9.3 Warm-up...63
9.4 Influence of side forces...65
9.5 Cement concrete...67
10 Drum measurements...68
10.1 BASt...68
10.2 TUG...68
10.3 BASt – TUG...71
10.4 Data from Michelin...71
11 Texture influence on rolling resistance...72
11.1 Texture measurement devices...72
11.1.1 BRRC...72
11.1.2 IFSTTAR / CETE of Lyon...72
11.1.3 ...73
Comparison texture measurements performed by IFSTTAR and BRRC on test track 11.2 One-third-octave band texture levels...74
11.2.1 Without enveloping...74
11.2.2 With enveloping...75
11.3 MPD...76
11.3.1 Without enveloping...76
11.3.2 With enveloping...77
11.4 Band-limited macrotexture and megatexture levels...79
11.4.1 Macrotexture...79 11.4.1.1 Without enveloping...79 11.4.1.2 With enveloping...81 11.4.2 Megatexture...82 11.4.2.1 Without enveloping...82 11.4.2.2 With enveloping...84
11.5 MPD, macrotexture and megatexture...85
11.5.1 Correlations...85 11.5.1.1 Without enveloping...85 11.5.1.2 With enveloping...86 11.5.2 Slope coefficients...87 11.5.2.1 Without enveloping...87 11.5.2.2 With enveloping...90 11.6 IRI...92 12 Conclusions...95 13 References...97 Annexes ...98
A. Texture spectra measured in middle, right and left wheel track direction east...98
B. ...102 Correlation between MPD and C for various tyres measured by different
C.
...105 Correlation between MPD and C for various tyres measured by different
participants – with enveloping r D.
...108 Correlation between macrotexture and C for various tyres measured by
different participants – without enveloping r E.
...111 Correlation between macrotexture and C for various tyres measured by
different participants – with enveloping r F.
...114 Correlation between megatexture and C for various tyres measured by different participants – without enveloping r
G.
...117 Correlation between megatexture and C for various tyres measured by different participants – with enveloping r
Foreword
The order of co-authors on the front page, following main author Bergiers and second author Goubert, is by alphabetical order and has nothing to do with the extent or importance of the contributions.
MIRIAM, an acronym for "Models for rolling resistance In Road Infrastructure Asset Management systems", is a project started and funded by twelve partners from Europe and USA. The managing partner is the Danish Road Institute.
The overall purpose of MIRIAM is to provide information useful for achieving a sustainable and environmentally friendly road infrastructure. In this project, the focus is on reducing the energy consumption due to the tyre/road interaction, by selection of pavements with lower rolling resistance – and hence lowering CO2 emissions and
increasing energy efficiency.
A first phase of the project will contribute with investigation of pavement characteristics, energy efficiency, modelling, and raising awareness of the project in order to secure economical and political support for a second phase. The second phase will focus on development and implementation of CO2 controlling models into
the road infrastructure asset management systems.
The website of MIRIAM is http://www.miriam-co2.net/ where comprehensive project information can be found.
MIRIAM has been divided into five sub-projects (SP), of which SP 1 is "Measurement methods and surface properties model".
This report is part of task 15 within SP 1 and is the fourth Deliverable of SP 1. The Deliverables of Phase 1 are the following:
Deliverable 1:
“Rolling Resistance – Basic Information and State-of-the-Art on Measurement methods”
Deliverable 2:
"Rolling Resistance – Measurement Methods for Studies of Road Surface Effects"
Deliverable 3:
“Comparison of Rolling Resistance Measuring Equipment - Pilot Study" Deliverable 4:
“Road surface influence on tyre/road rolling resistance"
These are all represented by written reports. See the MIRIAM website to download the reports, or to check where the reports may be downloaded.
Acknowledgements
The authors would like to thank IFSTTAR for their hospitality and for opening up the test tracks in Nantes for the round robin test. Thanks are especially in order for Mrs. Fabienne Anfosso-Lédée and Mr. Patrice Bernier.
MIRIAM is funded by contributions by the participating organizations, mainly to cover their own work, as well as pooled funding for which contributions have been obtained collectively by some of the participating organizations and which may be used for special purposes. The work presented in this report has been funded both by the participating organizations themselves (see list of authors) and by the pooled funding.
Abbreviations and acronyms
Abbreviation/acronym
Explanation Comment AAV4 Test tyre Avon AV4 Specified in section 5.1
BASt Bundesanstalt für
Straßenwesen
Federal Highway Research Institute, in English
BRRC Belgian Road Research
Centre
Cr Rolling Resistance Coefficient Also abbreviated “RRC”
CT Symbol indicating a tyre
having a corrupted tread
ES14 Michelin Energy Saver 14” tyre Specified in section 5.1 ES16 Michelin Energy Saver 16” tyre Specified in section 5.1 IFSTTAR l’Institut Français des
Sciences et Technologies des Transports, de l’Aménagement et des Réseaux
French institute of sciences and technology for transport, development and networks IRI International Roughness Index Standardized in ASTM E1926
- 08 LMa Macrotexture level: special
case of logarithmic texture profile level with the profile passing through a band-pass filter encompassing all one-third-octave bands within the macrotexture range (0.63 mm to 50 mm of centre
wavelengths) [1]. Unit: dB vs 1 µm rms.
LMe Megatexture level: special case of logarithmic texture profile level with the profile passing through a band-pass filter encompassing all one-third-octave bands within the megatexture range (63 mm to 500 mm of centre
wavelengths) [1]. Unit: dB vs 1 µm rms.
MPD Mean Profile Depth, a
measure representing pavement texture depth
Standardized in ISO 13473-1
R2 Correlation coefficient R
squared
This is a measure of the variance explained by the tested regression
RR Sometimes used as an
abbreviation for Rolling Resistance
RRC In this report the symbol Cr is
used for the Rolling Resistance Coefficient
RRT Sometimes used as an abbreviation for Round Robin Test
Extensive test comparing a number of measuring devices or subjects; in this case rolling resistance trailers
SRTT Standard Reference Test Tyre Specified in section 5.1 TUG Technical University of
Gdansk, Poland
VTI Swedish National Road and
Transport Research Institute XXXX/YYYY Tyre type XXXX, owned by
institute YYYY, measured by institute YYYY (unless specified otherwise)
XXXX/YYYY_ZZZZ Tyre type XXXX, owned by institute YYYY, measured by institute ZZZZ
XXXX/YYYY_50 Tyre type XXXX, owned by institute YYYY, measured at 50 km/h
XXXX/YYYY_80 Tyre type XXXX, owned by institute YYYY, measured at 80 km/h
1. Introduction
This research is part of the MIRIAM project (Models for rolling resistance In Road Infrastructure Asset Management systems), which aims at developing methods for improved control of road transport carbon dioxide (CO2) emissions in order to obtain
sustainable and environmental friendly road infrastructure.
As a first part of MIRIAM, a “Phase 1” was conducted in 2010-2011. It is planned to start a “Phase 2” in 2012.
MIRIAM is divided into five sub-projects. Sub-project number 1 (SP 1) is designated “Measurement methods and surface properties model”, and lead by Ulf Sandberg, VTI. Within SP 1, one of the major tasks is to study various measurement methods and the performance of available measurement equipment for rolling resistance, with a focus on measuring the pavement properties. As part of this task, in 2011 an international experiment was conducted to compare the measurement devices available within the MIRIAM project. This comparison experiment was popularly called “Round Robin Test” (RRT), which is the name used in this report.
The RRT was organized from 6 to 10 June 2011 on the test track owned by IFSTTAR in Nantes, France. Three institutes participated with their rolling resistance trailers: BASt, BRRC, and TUG. The practical organization was coordinated by IFSTTAR and the technical organization by BRRC. Texture measurements were performed by BRRC to verify the homogeneity of the test sections. Measurements on drums in laboratories were performed by BASt and TUG with the same tyres as used in the RRT.
At a later stage also truck rolling resistance measurements were carried out on a smaller selection of surfaces on the test track in Nantes. However, when this report was written these measurement results were not yet available1.
This experiment was, as far as the authors are aware, the first time when this type of devices was compared.
This report presents the RRT in terms of how it was carried out and the results obtained.
2. Purpose of the study
The main purposes of the study were: To assess the repeatability of the individual devices
To evaluate how well the results of the trailers correlate with each other
To assess the influence of the texture, expressed in terms of third of octave texture levels, broad band texture levels and the Mean Profile Depth, on the rolling resistance
To measure the influence of the tyres on the rolling resistance and how they classify the pavements
3. Measurement devices
3.1 Trailers used in measurements on site
The following organizations provided rolling resistance measuring devices in the form of towed trailers for comparison on the test track of IFSTTAR:
Belgian Road Research Centre (BRRC)
- Staff: Anneleen Bergiers and Philippe Debroux Bundesanstalt für Straßenwesen (BASt)
- Staff: Marek Zöller and Jens Steinheuer Technical University of Gdansk (TUG)
- Staff: Jerzy Ejsmont and Grzegorz Ronowski
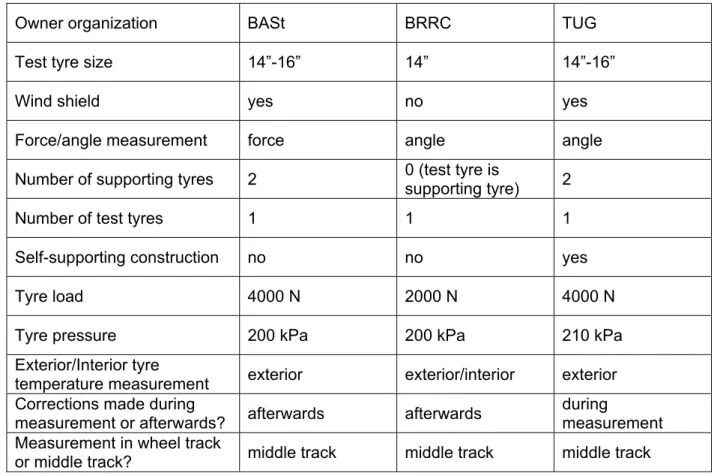
The devices are described and compared in Table 3.1 below. The trailers are further described in [2]. Photos are shown in Figure 3.1 to Figure 3.4.
Table 3.1: Essential features of trailers used during the round robin test in Nantes
Owner organization BASt BRRC TUG
Test tyre size 14”-16” 14” 14”-16”
Wind shield yes no yes
Force/angle measurement force angle angle
Number of supporting tyres 2 0 (test tyre is supporting tyre) 2
Number of test tyres 1 1 1
Self-supporting construction no no yes
Tyre load 4000 N 2000 N 4000 N
Tyre pressure 200 kPa 200 kPa 210 kPa
Exterior/Interior tyre
temperature measurement exterior exterior/interior exterior Corrections made during
measurement or afterwards? afterwards afterwards during
measurement Measurement in wheel track
Figure 3.1: Trailer BASt
Figure 3.3: Trailer TUG
Figure 3.4: All participating trailers on test track
3.2 Drum measurements in laboratories
The following organizations provided rolling resistance measurements on laboratory drums, as a supplement to the field measurements by trailers:
Bundesanstalt für Straßenwesen (BASt)
- Staff: Marek Zöller and Jens Steinheuer Technical University of Gdansk (TUG)
- Staff: Jerzy Ejsmont and Grzegorz Ronowski
The devices are described and compared in Table 3.2 below for the MIRIAM test conditions. The drum facilities are further described in [2]. Photos are shown in Figure 3.5 and Figure 3.6.
Table 3.2: Essential features of drums used for this research
Owner organization BASt TUG
Drum surface Sandpaper “Safety Walk” and Steel drum
Sandpaper “Safety Walk” and APS
Tyre load 4000 N 4000 N
Tyre pressure 200 kPa 200 kPa
Measuring principle direct force measurement (see [2] section 9.1.3)
TUG standard (see [2] section 9.3.2)
Correction for flat surface no yes
Figure 3.5: Drum BASt
Photos of drum surfaces that were used for MIRIAM, are shown in Figure 3.7 - Figure 3.9.
Figure 3.7: Steel surface used on TUG drum
Figure 3.8: Safety Walk surface used on TUG drum
4 Test location and surfaces
4.1 Test track
The test track is situated adjacent to the IFSTTAR offices in Nantes, France. It consists of a large half circle followed by test sections with different road surfaces.
Figure 4.1: The IFSTTAR test track, with the test sections expanded below
4.2 Test track surfaces
An overview of all test sections is shown in Table 4.1 and a more detailed description with pictures may be found in Table 4.2.
Table 4.1: Summary of test sections Pavement
designation
Description
M1 Very Thin Asphalt Concrete 0/10, class 1
F Colgrip: Surface Dressing 1/3 bauxite (high skid resistance) L1 Epoxy Resin (smooth section)
L2 Sand Asphalt 0/4
E1 Dense Asphalt Concrete 0/10 (new) E2 Dense Asphalt Concrete (old)
M2 Very Thin Asphalt Concrete 0/6, class 2 C Surface Dressing 0.8/1.5
A’ Surface Dressing 8/10 A Porous Asphalt Concrete 0/6 N Porous Cement Concrete CC (Dense) Cement Concrete
Table 4.2: Description of test sections (the coin in the pictures has a diameter of 23 mm)
Section Pavement Photo Length Remarks
M1 Very Thin Asphalt Concrete 0/10, class 1 244 m Grinded in middle, steel plate at km point 1550 F Colgrip: Surface Dressing 1/3 bauxite (high skid resistance) 250 m L1 Epoxy Resin (smooth section) 128 m Peeling
L2 Sand Asphalt 0/4 116 m E1 Dense Asphalt Concrete 0/10 (new) 252 m Road markings in middle, crack E2 Dense Asphalt Concrete (old) 250 m Disposed and existing road markings in middle, disposed road markings at east end M2 Very Thin Asphalt Concrete 0/6, class 2 150 m
C Surface Dressing 0.8/1.5 244 m Transversal uneven, disposed zebra crossing at west end, cracks, repaired cracks, surface shortly interrupted at east end A’ Surface Dressing 8/10 50 m A Porous Asphalt Concrete 0/6 220 m N Porous Cement Concrete 185 m Interrupted at west end by concrete plates CC (Dense) Cement Concrete 90 m Plates
4.3 Texture of the test sections
4.3.1 Texture spectra
The texture of the test tracks was measured with the BRRC dynamic laser profilometer (for a description of this device see section 11.1.1). Several runs were carried out with a step size of 0.2 mm at a speed of 30 km/h and over the full length of the test track. The texture profile was measured between the wheel tracks of the vehicle, more or less at the axle of the test track. For each profile the one-third-octave band texture spectrum was calculated. Texture spectra corresponding to six runs on track L2 are shown in Figure 4.2. The repeatability appears to be fair with a standard deviation which is the largest in the megatexture area, but even there it is not higher than 0.5 dB(A).
Test section L2 30 32 34 36 38 40 42 0,5000 0,317 5 0,2000 0,1250 0,080 0 0,0500 0,0318 0,0200 0,0125 0,0080 0,0050 0,0032 Texture wavelength [m] T ext ur e l eve l [d B r e 1 µm ] E-1 W-1 E-2 W-2 E-3 W-3
Figure 4.2: Texture spectra corresponding to several runs (three in eastern and three in western direction) on test track L2
Figure 4.3 shows the average texture spectra of the twelve IFSTTAR test tracks. Note the special shape of the spectrum of test track L1, the extremely smooth epoxy surface. On this surface, the part of the spectrum with texture wavelength below 3 cm is determined by the internal noise of the laser profilometer, rather than that it reflects a real texture.
10 15 20 25 30 35 40 45 50 55 60 0,500 0 0,400 0 0,317 5 0,250 0 0,200 0 0,158 7 0,125 0 0,100 0 0,080 0 0,062 5 0,050 0 0,040 0 0,031 8 0,025 0 0,020 0 0,015 9 0,012 5 0,010 0 0,008 0 0,006 3 0,005 0 0,004 0 0,003 2 0,002 5 Texture wavelength [m] T exture level [d B re. 1µm] A E1 E2 M2 M1 CC F A' L2 L1 N C
Figure 4.3: Average texture spectra of the IFSTTAR test tracks
Due to the stiffness of the rubber, a tyre tread can not protrude very deep in the texture profile. The rubber envelopes only a part of the texture. This is called enveloping. To reach a more realistic result all data were additionally analyzed with enveloping following a method described by [3] with value d*= 0.0025 mm-1. This
value was chosen quite arbitrarily, believing that it will be reasonably representative of passenger tyres, but this has not been studied closely. More information about the enveloping procedure can be found in [4].
The average texture spectra analysed after first applying the enveloping function on the profiles are shown in Figure 4.4.
10 15 20 25 30 35 40 45 50 55 60 0,500 0 0,400 0 0,317 5 0,250 0 0,200 0 0,158 7 0,125 0 0,100 0 0,080 0 0,062 5 0,050 0 0,040 0 0,031 8 0,025 0 0,020 0 0,015 9 0,012 5 0,010 0 0,008 0 0,006 3 0,005 0 0,004 0 0,003 2 0,002 5 Texture wavelength [m] T exture level [d B re. 1µm] A E1 E2 M2 M1 CC F A' L2 L1 N C
Figure 4.4: Average texture spectra of the IFSTTAR test tracks – with enveloping applied on the profiles before spectrum analysis
The impact of applying enveloping on the texture spectra can be seen in Figure 4.5 for test sections L2 (which is rather smooth) and A’ (which is rough).
10 15 20 25 30 35 40 45 50 55 60 0,50000,40000,31750,25000,20000,15870,12500,10000,08000,06250,05000,0 0,03180,02500,02000,01590,0 0,01000,00800,00630,00500,00400,00320,0025 Texture wavelen 400 125 gth [m] Text ur e l evel [ d B r e . 1µ m ] A' with enveloping L2 with enveloping A' without enveloping L2 without enveloping t
4.3.2 Mean Profile Depth
Test section C has been excluded out of the analyses of the correlation between Cr
and texture because of too many irregularities of the surface (see Table 4.2).
The values of the Mean Profile Depth without and with enveloping applied on the profile before calculating the MPD (averages over the whole test track lengths) are shown in Table 4.3.
Table 4.3: MPD values of the IFSTTAR test sections used in this experiment
Figure 4.5: Average texture spectra of test section A’ and L2 with and withou nveloping e Test section MPD [mm] MPD [mm] without with enveloping enveloping M1 1.14 0.63 F 1.00 0.82 L1 0.08 0.09 L2 0.42 0.36 E1 0.59 0.38 E2 0.82 0.64 M2 0.86 0.48 A 0.93 0.50 CC 0.44 0.50 A' 2.77 2.24 N 1.92 1.02 C 0.35 0.34
4.3.3 Homogeneity
4.3.3.1 Transversal
The width of the test sec between 2.5 and 3.9 m, meaning that trailers might not measure in the same wheel track (see Table 4.4). All trailers measure the r i middle track of the vehicle. However, a slight difference in positioning of the measuring vehicle may cause different results. For example: N is ground in the middle and not in the right and left wheel tracks, E1 and E2 have road markings in the middle track. M2 is a wider test section, meaning that probably not all teams measured in exactly the same track. Therefore, transversal homogeneity was checked. Texture measurements were performed in the middle, left and right wheel track of the te ions with size 0.2 mm. Due to spatial limitations on-site, in some cases only the left or right wheel tracks could be measured.
Table 4.4: Width of the test sec
tions ranged olling res stance in the
st sect step
tions
Test section Width [m]
M1 3.00 F 3.00 L1 3.00 L2 2.50 E1 3.45 E2 3.45 M2 3.90 A 3.00 CC - A' 3.00 N 2.60 C 3.00
The results of test section C are shown in Figure 4.6:. The graphs of all other test sections can be found in Annex A. The graph of test section N shows a slight difference between middle and right wheel track (see Figure A.3). Also the graph of test section L1 reveals some difference between middle and right wheel track, which is unexpected (see Figure A.6). No significant influence of road markings can be seen on the graphs of test sections E1 and E2 (see Figure A.4 and Figure A.5).
0 10 20 30 40 50 60 ve l [ d B r e. 1 µ m ] 0,5 0,3175 0,2 0,125 0,08 0,05 0,0318 0,02 0,0125 0,008 0,00 5 0,0032 0,002 0,0013 Texture wavelength [m] T e xt ur e l e C middle
C right wheel track - E C left wheel track - E
Figure 4.6: Texture spectra of test section C measured in middle, right and left wheel track direction east (E)
4.3.3.2 Longitudinal
Texture has been analyzed per 20 m. The standard deviation of the 20 m sections in percentage (standard deviation in dB divided by the average level in dB) has been calculated for the various wavelengths. The results are shown in Figure 4.7.
0% 2% 4% 6% 8% anda rd de vi a t 10% 14% 0,5 0,31 75 0,2 0,12 5 0,08 0,05 0,03 18 0,02 0,01 25 0,00 8 0,00 5 0,00 32 0,00 2 0,00 13 Texture wavelength [m] St ion [ C 12% % ] A L1 L2 N A' M2 E2 F E1 M1
Figure 4.7: Standard deviation (in percentage) of the 20 m sections for various wavelengths and test tracks
The calculated standard deviation may be used to give an idea about the longitudinal homogeneity of the test tracks. E2 can be considered as the least homogene test track for most wavelengths, which may be due to the road markings. F is the least homogene test track for the largest wavelengths. L1, N and C are less homogene in
4.3.4 Intercorrelation of one-third-octave band texture levels
the megatexture area.
In order to study the influence of the texture on the rolling resistance, it is ideal to use a set of test tracks for which the texture levels in any of the one-third-octave bands
are not correlated with the levels in any other band. Suppose e.g. that the rolling resistance is strongly correlated with the texture levels belonging to texture
avelengths 0.5 m and 0.01 m. If the texture levels of these two bands are strongly correlated with each other, then it is unclear to which texture wavelength band the w
rolling resistance is correlated to.
Therefore it was checked how well the texture levels of the different one-third-octave bands of the sample of test tracks correlate with each other. Table 4.5 shows the correlations for the relevant one-third-octave bands.
Table 4.5: Correlations (R²) among the texture levels measured in the various one-third-octave bands; where high correlation > 0.7 is indicated in red, medium correlation > 0.4 but ≤ 0.7 is indicated in yellow and low correlation ≤ 0.4 is indicated in green.
0.5 0.4 0.3175 0.25 0.2 0.1587 0.125 0.1 0.08 0.0625 0.05 0.04 0.0318 0.025 0.02 0.0159 0.0125 0.01 0.008 0.0063 0.005 0.004 0.0032 0.0025 0.5 1.0 0.9 0.7 0.6 0.5 0.5 0.4 0.4 0.4 0.3 0.3 0.3 0.3 0.3 0.3 0.2 0.2 0.2 0.1 0.1 0.1 0.1 0.1 0.1 0.4 0.9 1.0 0.9 0.8 0.7 0.7 0.6 0.6 0.6 0.6 0.5 0.5 0.5 0.5 0.5 0.4 0.4 0.4 0.3 0.3 0.3 0.3 0.3 0.3 0.3175 0.7 0.9 1.0 1.0 0.9 0.9 0.8 0.7 0.7 0.7 0.7 0.7 0.6 0.6 0.6 0.6 0.6 0.5 0.5 0.4 0.4 0.4 0.4 0.4 0.25 0.7 0.8 1.0 1.0 1.0 0.9 0.9 0.9 0.8 0.8 0.8 0.8 0.7 0.7 0.7 0.7 0.7 0.6 0.5 0.5 0.4 0.4 0.4 0.4 0.2 0.6 0.7 0.9 1.0 1.0 1.0 0.9 0.9 0.9 0.9 0.8 0.8 0.8 0.8 0.8 0.8 0.7 0.7 0.6 0.6 0.6 0.5 0.5 0.5 0.1587 0.5 0.7 0.9 0.9 1.0 1.0 1.0 1.0 1.0 0.9 0.9 0.9 0.9 0.9 0.9 0.9 0.8 0.8 0.7 0.7 0.6 0.6 0.5 0.5 1.0 1.0 0.9 0.9 0.9 0.9 0.8 0.7 0.7 0.125 0.4 0.6 0.8 0.9 0.9 1.0 1.0 1.0 1.0 1.0 0.9 0.9 0.7 0.6 0.6 0.1 0.4 0.6 0.7 0.9 0.9 1.0 1.0 1.0 1.0 1.0 1.0 1.0 1.0 1.0 1.0 1.0 0.9 0.9 0.8 0.8 0.7 0.7 0.6 0.6 0.08 0.4 0.6 0.7 0.8 0.9 1.0 1.0 1.0 1.0 1.0 1.0 1.0 1.0 1.0 1.0 1.0 0.9 0.9 0.9 0.8 0.8 0.7 0.7 0.6 0.0625 0.3 0.6 0.7 0.8 0.9 0.9 1.0 1.0 1.0 1.0 1.0 1.0 1.0 1.0 1.0 1.0 1.0 0.9 0.9 0.8 0.8 0.8 0.7 0.7 0.05 0.3 0.5 0.7 0.8 0.8 0.9 1.0 1.0 1.0 1.0 1.0 1.0 1.0 1.0 1.0 1.0 1.0 0.9 0.9 0.9 0.8 0.8 0.7 0.7 0.04 0.3 0.5 0.7 0.8 0.8 0.9 1.0 1.0 1.0 1.0 1.0 1.0 1.0 1.0 1.0 1.0 1.0 1.0 0.9 0.9 0.8 0.8 0.7 0.7 0.0318 0.3 0.5 0.6 0.7 0.8 0.9 0.9 1.0 1.0 1.0 1.0 1.0 1.0 1.0 1.0 1.0 1.0 1.0 0.9 0.9 0.8 0.8 0.7 0.7 0.025 0.3 0.5 0.6 0.7 0.8 0.9 0.9 1.0 1.0 1.0 1.0 1.0 1.0 1.0 1.0 1.0 1.0 1.0 0.9 0.9 0.9 0.8 0.8 0.7 0.02 0.3 0.5 0.6 0.7 0.8 0.9 0.9 1.0 1.0 1.0 1.0 1.0 1.0 1.0 1.0 1.0 1.0 1.0 0.9 0.9 0.9 0.8 0.8 0.7 0.0159 0.2 0.4 0.6 0.7 0.8 0.9 0.9 1.0 1.0 1.0 1.0 1.0 1.0 1.0 1.0 1.0 1.0 1.0 1.0 0.9 0.9 0.8 0.8 0.8 0.0125 0.2 0.4 0.6 0.7 0.7 0.8 0.9 0.9 0.9 1.0 1.0 1.0 1.0 1.0 1.0 1.0 1.0 1.0 1.0 1.0 0.9 0.9 0.8 0.8 0.01 0.2 0.4 0.5 0.6 0.7 0.8 0.9 0.9 0.9 0.9 0.9 1.0 1.0 1.0 1.0 1.0 1.0 1.0 1.0 1.0 1.0 0.9 0.9 0.8 0.008 0.1 0.3 0.5 0.5 0.6 0.7 0.8 0.8 0.9 0.9 0.9 0.9 0.9 0.9 0.9 1.0 1.0 1.0 1.0 1.0 1.0 1.0 0.9 0.9 0.0063 0.1 0.3 0.4 0.5 0.6 0.7 0.7 0.8 0.8 0.8 0.9 0.9 0.9 0.9 0.9 0.9 1.0 1.0 1.0 1.0 1.0 1.0 0.9 0.9 0.005 0.1 0.3 0.4 0.4 0.6 0.6 0.7 0.7 0.8 0.8 0.8 0.8 0.8 0.9 0.9 0.9 0.9 1.0 1.0 1.0 1.0 1.0 1.0 0.9 0.004 0.1 0.3 0.4 0.4 0.5 0.6 0.7 0.7 0.7 0.8 0.8 0.8 0.8 0.8 0.8 0.8 0.9 0.9 1.0 1.0 1.0 1.0 1.0 1.0 0.0032 0.1 0.3 0.4 0.4 0.5 0.5 0.6 0.6 0.7 0.7 0.7 0.7 0.7 0.8 0.8 0.8 0.8 0.9 0.9 0.9 1.0 1.0 1.0 1.0 0.0025 0.1 0.3 0.4 0.4 0.5 0.5 0.6 0.6 0.6 0.7 0.7 0.7 0.7 0.7 0.7 0.8 0.8 0.8 0.9 0.9 0.9 1.0 1.0 1.0
It is clear from Table 4.5 ure levels of the different one-third-octave bands
ar o t d t u h a
impossible t o e g
for the rollin t s I e o
correlation o t b
D h a n ) M
level over the macrotext .
that the text d o
e str ngly correlate ver ra her wi e ext re wavelengt r nges, making it o identify a narrow area f the t xture wavelength ran e as responsible g resis ance, if that would be the ca e. n s cti n 12, therefore, also the f the rolling resistance wi h wide and descriptors, as MPD (Mean Profile epth), LMe (global texture level of t e meg texture ra ge and L a (global texture
5 Tyres
5.1 Characteristics
An attempt was made to find tyres from the same batch (as identified by the DOT marking on the tyre) for all teams in order to minimize differences that are due to a variation in tyre properties. Only the SRTT tyres came from different batches. Each team used his own set of tyres. Moreover TUG performed measurements with all sets of tyres to detect possible variations per tyre type.
In Table 5.1 more details may be found about the tyres that were used on the test track. Shore hardness of all tyres was measured in the TUG laboratory.
Table 5.1: Overview of tyres used during RRT
Symbol Producent Tyre tread Tyre size Index DOT Hard-ness
AAV4/BASt Avon Supervan AV4 195 R14 C 106/104N ATJ8 PC2810 64 Sh
AAV4/TUG Avon Supervan AV4 195 R14 C 106/104N ATJ8 PC2810 62 Sh
AAV4_CT/
TUG Avon Supervan AV4 195 R14 C 106/104N - 64 Sh
ES16/BASt Michelin Energy Saver 225/60 R16 98V HC 3V 00KX1511 66 Sh
ES16/TUG Michelin Energy Saver 225/60 R16 98V HC 3V 00KX1511 63 Sh
ES14/BRR
C Michelin Energy Saver 195/70 R14 91T F1 J9 681X3010 66 Sh
ES14/TUG Michelin Energy Saver 195/70 R14 91T F1 J9 681X3010 63 Sh
SRTT/BASt Uniroyal Tiger paw M+S P225/60 R16 97S ANX0 EVUU4608 68 Sh
SRTT/TUG Uniroyal Tiger paw M+S P225/60 R16 97S …0404 65 Sh
All tyre types used for the RRT are shown in Figure 5.1 and Figure 5.2.
For use as a reference tyre in the RRT, three samples of an Avon AV4 tyre were purchased by VTI. These were sent to IFSTTAR, BASt and TUG. It appeared that one of them had a tread pattern which was different from the "normal" one. This tyre type is chosen as a second reference tyre for CPX measurements of noise and the experience of this is that the tread pattern normally has a rather poor alignment between the left and right halves of the tread; implying that the tread blocks and grooves in the middle have a slightly distorted shape. This seems to be "normal" for this tyre so it has been accepted. However, the deviating tyre AAV4/TUG_CT purchased for this project had the two halves of the tread pattern substantially more displaced and misaligned, making the appearance of the tread weird (see Figure 5.1 middle and right picture). In this project, this tyre has been described as having a "corrupted tread".
Strange enough, it appeared in the tests that the Cr of this tyre sample did not differ
om the samples having a "normal" tread. This is shown later in this significantly fr
report.
Figure 5.1: SRTT (left), AAV4 (middle) and AAV4_CT (right)
Figure 5.2: ES nd ES16 (right)
re
ure
load
n w ar (2 BA nd BRR 21
s were filled up with nitrogen. The process to fill
im der r a e.
experiments i e kPa a ndard in
n ver was v e e insti TUG) whic
ias the comparisons.
ater, attempts will be made to determine what effect the differences in inflation
used for ES14 and for AAV4 have a wheel width of 6 and 5.5” spectively. Wheel width may influence rolling resistance.
14 (left) a
5.2 Ty
press
and
Tyre inflatio
kPa) for TUG. The tyre
pressure as 2.0 b 00 kPa) for St a C and 2.1 bar ( the tyre wa
0 s repeated 3 t es in or to make su e that all air w s gon
Before the measureme t had been , this decided to us iolated by on 200 of th s the sta tutions ( all h ts. Howe b L
might have had. In the Artesis project the influence of tire inflation was looked into [5]. In the Artesis project a difference of 0.1 bar (10 kPa) was found to correspond with a Cr difference of 1.6 %.
The loads were 4000 N in all cases except for the BRRC trailer where the load was 2000 N because of a limitation of the trailer suspension.
5.3 Wheels
The wheels that were used for SRTT and ES16 have a wheel width of 6.5”. The wheels that were
6 Measurement program
The number of runs that were performed in east (E) and west (W) direction per team is specified in the tables hereunder.
6.1 Comparison tests of the three measuring devices
The number of test runs performed per speed and direction by all institutes can be found in Table 6.1 to Table 6.3.
Table 6.1: Number of runs performed by BASt in east (E) and west (W) direction
Pavement AAV4 SRTT ES16 ES14
6.1.1 BASt
50 km/h E-W 80 km/h E-W 50 km/h E-W 80 km/h E-W 50 km/h E-W 80 km/h E-W 50 km/h E-W 80 km/h E-W M1 4 - 4 4 - 4 4 - 4 6 - 6 4 - 4 4 - 4 - - F 1 - 1 1 - 1 2 - 2 2 - 2 1 - 1 1 - 2 - - L1 1 - 1 1 - 2 2 - 2 3 - 3 1 - 1 1 - 1 - - L2 4 - 4 4 - 4 6 - 5 6 - 6 2 - 3 4 - 4 - - E1 1 - 1 1 - 1 2 - 3 2 - 2 1 - 1 0 - 2 - - E2 - - - M2 1 - 1 1 - 0 1 - 1 2 - 0 1 - 1 1 - 0 - - C 1 - 2 1 - 2 2 - 2 2 - 2 1 - 1 1 - 1 - - A’ 1 - 1 - 2 - 2 3 - 2 1 - 1 - - - A 2 - 1 1 - 1 3 - 2 2 - 2 1 - 2 0 - 1 - - N 2 - 2 4 - 0 5 - 5 4 - 0 1 - 1 1 - 0 - - CC - - -6.1.2 BRRC
Table 6.2: Number of runs performed by BRRC in east (E) and west (W) direction
Pavement AAV4 SRTT ES16 ES14
50 80 km/h km/h 50 km/h 80 km/h 50 km/h 80 km/h 50 km/h 80 km/h
E-W E-W E-W E-W E-W E-W E-W E-W
M1 - - - 10 - 10 10 - 11 F - - - 10 - 10 10 - 11 L1 - - - 10 - 11 10 - 10 L2 - - - 10 - 11 10 - 10 E1 - - - 4 - 4 4 - 4 E2 - - - 4 - 4 4 - 4 M2 - - - 4 - 4 4 - 4 C - - - 11 - 11 11 - 9 A’ - - - 16 - 16 15 - 14
A - - - 11 - 11 10 - 9
N - - - 10 - 11 12 - 10
CC - - - 4 - 4 4 - 5
6.1.3 TUG
able 6.3: Number of runs performed by TUG in east (E) and west (W) direction T
Pavement AAV4 SRTT ES16 ES14
50 80 km/h W km/h E-W 50 km/h E-W 80 km/h E-W 50 km/h E-W 80 km/h E-W 50 km/h E-W 80 km/h E-W E-M1 2 - 2 2 - 2 8 - 2 6 - 1 2 - 2 2 - 2 2 - 2 2 - 2 F 2 - 2 2 - 2 8 - 2 6 - 1 2 - 2 2 - 2 2 - 2 2 - 2 L1 2 - 4 2 - 2 9 - 3 2 - 2 2 - 2 2 - 2 2 - 2 4 - 3 L2 2 - 4 2 - 2 9 - 3 2 - 2 2 - 2 2 - 2 2 - 2 4 - 3 E1 2 - 2 2 - 2 2 - 7 2 - 2 2 - 2 2 - 2 2 - 2 2 - 2 E2 2 - 2 2 - 2 2 - 7 2 - 2 2 - 2 2 - 2 2 - 2 2 - 2 M2 4 - 6 2 - 2 17 - 5 2 - 2 4 - 4 2 - 6 4 - 6 6 - 4 C 2 - 2 2 - 2 2 - 8 2 - 2 2 - 2 2 - 2 2 - 2 2 - 2 A’ 2 - 2 2 - 2 2 - 8 2 - 2 2 - 2 2 - 2 2 - 2 2 - 2 A 2 - 2 2 - 2 2 - 8 2 - 2 2 - 2 2 - 2 2 - 2 2 - 2 N 0 0 0 0 0 0 0 0 CC 0 0 0 0 0 0 0 0
6.2
ddi
l t
to
lor
ta
atu
6.2.1 Tyres (TUG/ BASt)
All tyres were tested on the test track to have an idea of differences between tyres of the same type. Also measurements with various trailers (BASt and TUG) with exactly the same tyre can be compared to show trailer related differences. Additionally
s were tested on the TUG drum and three tyres on the BASt drum itions.
eed i
e (TUG
Test sections d re re gh in to min
influence of speed.
6.2.3 Warm p (BR C)
To determine the influen
highway. The exterior te t the tyre shoulder and the interior temperature inside the tyre were reg ered c tinuous while ving 45 inut 80 Tyre essure w meas d each 5 minu during short s nds te
done with air and with nitrogen in the tyre. The process to f the nitrogen respectively was repeated 3 times.
A
tiona ests
exp
e cer in fe
res
afterwards all tyre laboratory cond in
6.2.2 Sp
nfluenc
)
L1 an L2 we measu d at hi speed order deter e the
-u
R
ce of warm-up, measurements have been performed on the mperature a
ist on ly dri m es at km/h.
pr as ure 1 tes a ta till. This st was
6.2.4 Influe
e of w eel a
stme t (BRR )
To simulate the effect of wheel adjustment, measure nts hav been rme shallow curb on dense asphalt 0/10 at various speeds: 30, 50 and 70 km/h. However there was some doubt whether this really would give a similar result.
6.2.5 Cement concrete (BRRC)
urements have been p d on ceme rete on the ack.
ere rtaint sults.
nc
h
dju
n
C
me e perfo d in a Some meas However th erforme bout th nt conc test tr is some unce y a e re7 Measurement procedure
s every team had a different measurement method, everyone performed his test by walkie-talkie with the other teams.
…) were registered continuously by a eather station and could thereby be linked to the measurement results afterwards. The warm-up procedure consisted of driving at approximately 80 km/h during 15 minutes.
A
program individually while communicating Weather conditions (temperature, wind, w
8 Measurement results
8.1 Wind
Wind direction and speed were studied, using data registered by the weather station of IFSTTAR. Maximum wind speed registered during BRRC measurements was for example 5,4 m/s. The direction of the wind ranged between 216° (southwest) and 54° (northwest); 180°, 270° and 360° being the south, west and north respectively. I
3 t
as not considered further as a disturbing factor because wind speeds were low and nly a wind direction west was registered.
.2 Temperature correction
was verified if temperature correction would have a large influence on easurement results.
RRC and BASt linked all measurement runs to the ambient air temperature gistered by the weather station of IFSTTAR.
UG measured ambient air temperature and reported an average value per tyre-peed combination (for example one average temperature for all measurements erformed with SRTT at 50 km/h).
emperature correction is applied following ISO 28580 [6]: w o
8
It m B re T s p T
R
F
C
T
T
k
C
r ref T r r
,1
25 , ith= rolling resistance, expressed in Newtons = tyre load, expressed in Newtons
= constant = 0.008
= temperature during measurement, expressed in °C
ref = reference temperature = 25 °C
able 8.1 demonstrates the linked temperatures and their influence on Cr. The
fluence on Cr was calculated using following formula:
C
W R F k T T T in
C
r,T
C
r,25
C
r,TTable 8.1: Temperatures linked to various institutes with influence on Cr
BASt BRRC TUG inimum temperature [°C] 14.2 15.2 16.5 M aximum temperature [°C] 18.0 17.8 21.0 M Temperature interval minimum – maximum [°C] 3.8 2.6 4.5
Influence in relation to Tref [%] Approx. -6.9 Approx. -6.6 Approx. -5.2 Influence of the variation in
] 3.0 2.1 3.6
temperature [%
A higher temperature effect was reported by Descornet in 1990 [7]. Additionally the influence of the variation in temperature has been calculated using the formula from that research:
C T T T C CrT rT exp 1 0 , ,0 T1 509 %, 5.3 % and 9.4 % influence of variation temperature respectively.
seems to differ between TUG and IFSTTAR weather station ata (for example maximum temperature 17.8 °C versus 21.0 °C) even though all
mparison much.
.3 Repeatability of the RR devices
over the whole length of the test section. A distinction is made between short term and day-to-day repeatability. Short term repeatability investigates measurement runs performed the one after the other on the same test ection. Day-to-day repeatability looks into the measurements that were performed
ferent days on the same test section.
lity
e measurements were done st and some heading west. The “east” and “west” measurements are considered here separately.
ed for all cases, which are given in Table 8.2. tandard deviation (%) is calculated as follows:
For each combination tyre/speed/direction several measurements of C were carried ut on tracks L2 and M1 and the average and the standard deviation were calculated. This standard deviation was divided by the mean value and expressed as
ges e found in t t column o 8.2. The mean value of the percentages is then calculated:
for BASt, BRRC and TUG resulting in 7. in
Ambient air temperature d
measurements took place on the same days. Moreover the influence on Cr is so
small, that it would not affect the results and co
Therefore it is decided not to apply any temperature correction in this report.
8
Results are considered
s on dif
8.3.1 BASt
8.3.1.1 Short term repeatabi
BASt repeated measurements on test tracks M1 and L2 for the SRTT, AAV4, ES14 and ES16 tyres at 50 and 80 km/h. For every case som
heading ea
Standard deviations were calculat S
r
o
a percentage. These percenta can b he righ f Table o for all combinations
o per direction o per track M1 and L2
o per speed 50 and 8 km/h o per tyre
0
epeatability expressed as standard deviations for the BASt ailer
Table 8.2: Short term r tr
Tyre Speed [km/h] Test track Direction Standard deviation [%]
SRTT 50 L2 E 2.0 W 3.5 M1 E 1.9 W 2.5 80 L2 E 2.0 W 5.6 M1 E 3.1 W 2.5 AAV4 50 L2 E 2.4 W 3.1 M1 E 2.3 W 1.1 80 L2 E 3.8 W 2.1 M1 E 3.3 W 3.0 ES16 50 L2 E 0.5 W 1.8 M1 E 2.4 W 2.6 80 L2 E 1.9 W 2.9 M1 E 1.8 W 4.7 overall2 2.6 E 2.3 W 3.0 L2 2.6 M1 2.6 50 2.2 80 3.1 SRTT 2.9 AAV4 2.6 ES16 2.3
The overall short term repeatability of the BASt trailer is 2.6 %, which appears to be tyre and surface independent.
8.3.1.2 Day-to-day repeatability
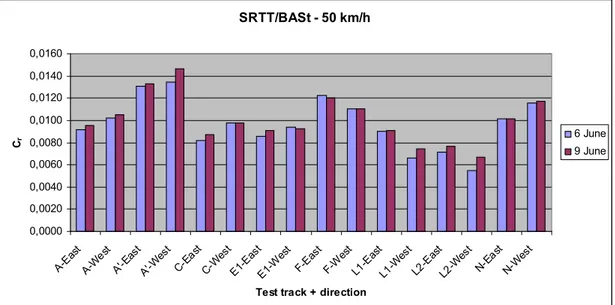
BASt carried out measurements on the tracks with the SRTT tyre at 50 and 80 km/h both on 6 and 9 June 2011. Figure 8.1 shows the measured Cr at 50 km/h and Figure
ean 2 Arithmetic m
8.2 at 80 km/h. The overall relative RMS variation σ is 7 % for both speed values, as follows:
with
the ber of test tracks
o Cr,i,x the rolling resistance coefficie easured on track date x
.
Measurements performed on 9 June at 50 km/h appear to be higher compared to measuremen erformed June, while those at 80 km/h tend to be lower. The authors do no now how to plain this.
which is calculated
σ² = ∑ [ (Cr,i,6 June – Cr,i,9 June)/ Cr,i,6 June ]² / N
all tracks i o N num nt m i on ts p on 6 t k ex SRTT/BASt - 50 km/h 0000 0020 0 0060 0080 0100 0120 0140 0160 A-Ea st A-W -E ast A'-W est C-Ea st est E1-Ea st E1-W est F- W est L1-E ast L1-W est L2-E ast L2-W e st N-W est
Test trac irection
Cr 0, 0, 0,004 0, 0, 0, 0, 0, 0, est A' C-W Ea st F-st Ea N-k + d 6 June 9 June
Figure 8.1: Da o-day variability for the BA t ailer with the SRTT/BASt mounted and
at 50 km/h. y-t St r SRTT/BASt - 80 km/h 0,0000 0080 0100 0120 0140 0160 A' E1 st L1-E ast L1-We st L2-E ast L2-We st M1-E ast M1-We st M2-E ast N-Ea st Cr 0, 0, 0, 0, 0, 6 June 9 June 0,0020 0,0040 0,0060 A-Ea st A-W est A'-Ea st -Wes t C-Ea st C-W est E1-Ea st -Wes t F-Ea st F-We
Test track + direction
Figure 8.2: Day-to-day variability for the BASt trailer with the SRTT/BASt mounted and at 80 km/h.
8.3.2 BRRC
8.3.2.1 Short term repeatability
BRRC repeated measurements on test tracks M1 and L2 for the ES14 tyre at 50 and 0 km/h. For every case eight runs were done heading east and eight heading west. nts are considered here separately. Standard
Cr.
e values are given in Table 8.3. 8
The “east” and “west” measureme
deviation (%) is the standard deviation of all Cr divided by the average of all
Th
Table 8.3: Repeatability expressed as standard deviations for the BRRC trailer Speed
Tyre [lm/h] Test track Direction Standard deviation [%]
E 2.5 L2 W 1.2 E 3.6 50 M1 W 1.1 E 2.6 L2 W 2.8 E 5.1 80 M1 W 2.7 overall 2.7 E 3.5 W 2.0 L2 2.3 M1 3.1 50 2.1 ES14 80 3.3
epeatability seems to be better for 50 km/h than for 80 km/h, which may e due to the influence of the wind.
Two measurement runs are shown in Figure 8.3. The graph reveals a good short term repeatability.
One may conclude that the short term repeatability of the BRRC trailer is 2.7 %.The short term r b 0,000 0,002 0,004 0,006 0,008 0,010 0,012 0,014 0,016 0,018 0 100 200 Distance [m] C r A east run 1 A east run 2
Figure 8.3: C as a function of distance – Two measurement runs performed by BRRC r t section A direction east at 50 km/h
8.3.2.2 Day-to-day repeatability
r test tracks. Only part of the results is
RRC meas
B ured C on 6 and 9 June on all the
relevant as during the measurement campaign on the 9th the trailer hit an object, disrupting the device.
Table 8.4: Identical measurements carried out on different dates Speed
Cr
Test track [km/h] Direction Date Change between 6 and 9 June
F 80 E 6/jun 0.0197 F 80 W 6/jun 0.0205 F 80 E 9/jun 0.0232 17.8 % F 0 8 W 9/jun 0.0242 18.0 % L1 0 8 E 6/jun 0.0160 L1 80 W 6/jun 0.0169 L1 0 8 E 9/jun 0.0188 17.5 % L1 0 8 W 9/jun 0.0196 16.0 % L2 0 8 E 6/jun 0.0169 L2 0 8 W 6/jun 0.0183 L2 0 8 E 9/jun 0.0189 11.8 % L2 0 8 W 9/jun 0.0202 10,4 % A 0 8 E 6/jun 0.0170 A 0 8 E 9/jun 0.0206 21.2 % C 0 8 E 6/jun 0.0174 C 0 8 E 9/jun 0.0217 24.7 % A' 0 8 E 6/jun 0.0203 A' 0 8 E 9/jun 0.0240 18.2 %
There appears to be a systematic increase of the measurement results of 10 up to 25 %, most probably caused by a calibration error. For more information about calibration procedures, see [4]. This will be investigated further.
8.3.3 TUG
8.3.3.1 Short term repeatability
TUG did a number of runs on ten test tracks in both directions, at two speeds and with four types of tyres. The repeatability values are summarized in Table 8.5. The overall short term repeatability for the TUG trailer is 1.1 %. There is no significant difference due to speed or direction. The repeatability is expressed as standard deviation (%) which is the standard deviation of all Cr (of different runs) divided by
the average of all Cr.
Table 8.5: Short term repeatability values of the TUG trailer (%)
SRTT AAV4 ES16 ES14
50 80 50 80 50 80 50 80
Section East West East West East West East West East West East West East West East West M1 1.6% 1.2% 3.1% - 0.8% 0.6% 0.1% 0.8% 0.7% 2.6% 3.2% 0.3% 0.6% 0.4% 1.4% 0.3%
F 1.1% 0.2% 2.0% - 0.1% 0.8% 0.7% 0.6% 0.3% 1.0% 2.3% 1.1% 0.5% 0.1% 1.8% 0.6% M2 3.1% 1.5% 1.3% 0.6% 0.8% 1.0% 0.5% 0.9% 1.1% 1.8% 2.3% 2.5% 3.0% 1.6% 1.7% 0.8% L1 5.0% 0.8% 4.2% 2.5% 0.5% 0.7% 0.3% 0.3% 0.0% 1.0% 1.7% 3.9% 0.1% 1.0% 0.2% 0.8% L2 3.0% 1.6% 1.7% 2.3% 1.5% 0.8% 0.1% 0.4% 1.0% 1.3% 0.7% 0.7% 0.5% 0.2% 1.0% 0.5% E1 0.7% 1.0% 0.7% 2.0% 0.2% 0.5% 0.3% 0.6% 3.1% 0.5% 3.6% 5.5% 1.0% 1.2% 0.0% 0.4% E2 1.0% 0.8% 1.3% 1.4% 0.6% 0.6% 0.3% 0.3% 0.5% 0.5% 2.5% 0.3% 0.8% 1.4% 0.3% 0.4% C 0.5% 1.8% 2.5% 0.5% 0.0% 0.4% 0.3% 0.2% 0.4% 0.2% 1.1% 1.1% 0.8% 0.9% 0.4% 0.3% A' 0.9% 1.7% 2.2% 1.5% 0.2% 0.7% 0.1% 0.7% 1.3% 0.4% 1.0% 3.5% 0.2% 0.6% 0.5% 0.2% A 1.4% 2.3% 4.4% 1.8% 0.4% 0.4% 0.1% 0.6% 0.4% 0.8% 1.8% 0.9% 0.1% 0.2% 0.9% 0.9% overall 1.1% E 1.2% W 1.0% 50 1.0% 80 1.2%
Two asurem runs sho Fig aph reveals an excellent
short term repeatability.
me ent are wn in ure 8.4. The gr
0,000 0,002 0,004 0,006 8 0 2 4 6 8 10 20 30 40 50 60 70 80 90 100 110 120 130 Distance [m] Cr 0,00 0,01 0,01 0 1,0 0,01 0,01 A east run 1 A east run 2 0
o measurement runs performed by TUG on st section A direction east at 50 km/h
easurements on different days.
8.4 Reproducibility of the RR devices
R considered over the wh n o t se n
Figure 8.4: Cr as a function of distance – Tw te
8.3.3.2 Day-to-day repeatability
As TUG already had a full test program by performing measurements with all tyres, UG did not repeat m
T
8.4.1
S
T
8.
.1
l
r
All measurements performed by BASt and TUG with AAV4, ES16 and SRTT are
plo d g d u . r n S e e t
drawn with full line, while the TUG g
BASt performed SRTT/BASt measurements on 2 section 8.3.1.2). Both results are shown in the graphs.
Except for two inconsistent BASt values for surfaces M1 and L2 at 80 km/h, the absolute values of AAV4 for TUG and BASt are situated not too far from each other
(the difference is approx. 10 %) at 50 km/h bu a
peed influence on the similarity of results is difficult to explain.
All graphs show similar patterns with respect to the effect of road surface.
BA t – UG
4.1 A l measu ements
tte in Fi ure 8.5 an Fig re 8 6. G aphs representi g BA t m asur men s are raphs are drawn with dashed line.
days: 6 June and 9 June (see also
t much closer at 80 km/h. Such s
SRTT and ES16 values measured by BASt are substantially higher than measured y TUG at both speeds.
b
Summary 50 km/h
SRTT/BASt_0606 AAV4/BASt ES16/BASt SRTT/BASt_0906
AAV4/TUG ES16/TUG SRTT/TUG
0 0,002 0,004 0,006 0,008 0,012 0,014 0,016 0,018 0,02 0,022 0,024 0,026 M1 F L1 L2 E1 E2 M2 A C A' N 0,01 St and TUG at 50 km/h Figure 8.5: Cr for different test sections measured by BA
Summary 80 km/h 0 0,002 0,004 0,006 0,008
SRTT/BASt_0606 AAV4/BASt ES16/BASt SRTT/BASt_0906
AAV4/TUG ES16/TUG SRTT/TUG
0,024 0,026 0,02 0,022 0,014 0,016 0,018 0,01 0,012 M1 F L1 L2 E1 E2 M2 A C A' N
Figure 8.6: Cr for different test sections measured by BASt and TUG at 80 km/h
8.4.1.2 Relation between BASt and TUG ES16 tyre measurements
Very good correlations between the TUG and BASt ES16 tyres are found for both speeds (see Figure 8.7 and Figure 8.8). However, the difference to a 1:1 line is substantial, indicating a poor reproducibility.
50 km/h y = 0,8492x - 0,0017 R2 = 0,8128 0 0,005 0,01 0,015 0,02 0,025 0,03 0 0,005 0,01 0,015 0,02 0,025 0,03 ES16/BASt_BASt E S 16 /T UG _T UG
Figure 8.7: Correlation between Cr measured by BASt and TUG with ES16 at 50 km/h
80 km/h y = 1,1039x - 0,0035 R2 = 0,8798 0 0,005 0,01 0,015 0,02 0 0,005 0,01 0,015 0,02 0,025 0,03 ES16/BASt_BASt E S 16/ T U G _T U G 0,03 0,025
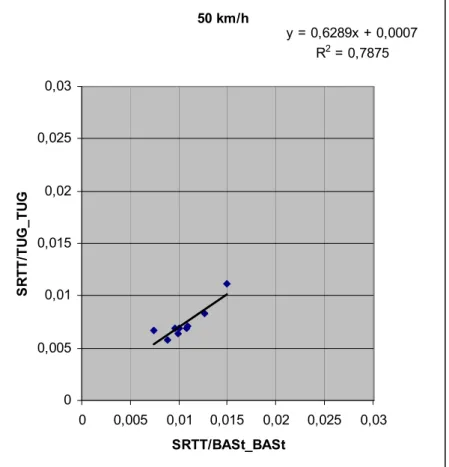
8.4.1.3 Relation between BASt and TUG SRTT tyre measurements
Very good correlations are found between the TUG and BASt tyres when comparing SRTT measurements. At 80 km/h it is even an excellent correlation (0.984). However, the regression line is situated far from the 1:1 relation (albeit slope coefficient is 0.914), which again means that reproducibility is poor.
50 km/h y = 0,6289x + 0,0007 R2 = 0,7875 0 0,005 0,01 0,015 0,02 0,025 0,03 0 0,005 0,01 0,015 0,02 0,025 0,03 SRTT/BASt_BASt S RT T /T UG _T UG
80 km/h y = 0,9139x - 0,0015 R2 = 0,9840 0,03 0 0,005 0,01 0,015 0,02 0,025 0 0,005 0,01 0,015 0,02 0,025 0,03 SRTT/BASt_BASt S RT T /T UG _T UG
Figure 8.10: Correlation between Cr measured by BASt and TUG with SRTT at 80 km/h
8.4.1.4 Relation between BASt and TUG AAV4 tyre measurements
The correlation chart of 50 km/h demonstrates a very good correlation, while the one ). of 80 km/h indicates that there is no correlation (see Figure 8.11 and Figure 8.12 This is due to the two inconsistent BASt values (see Figure 8.6).
50 km/h y = 0,8069x + 0,0044 R2 = 0,9054 0 0,005 0,01 0,015 0,02 0,025 0,03 0 0,005 0,01 0,015 0,02 0,025 0,03 AAV4/BASt_BASt A AV 4/ T UG _T UG
Figure 8.11: Correlation between Cr measured by BASt and TUG with AAV4 at 50 km/h
80 km/h y = 0,1588x + 0,0129 0 0,005 0,01 0,015 0,02 0,025 0 0,005 0,01 0,015 0,02 0,025 0,03 AAV4/BASt_BASt AA V 4/ T U G _T UG R2 = 0,1673 0,03
8.4.2 BRRC – TUG
8.4.2.1 All measurements
All measurements performed by BRRC and TUG with ES14 are plotted in Figure 8.13. Graphs representing BRRC are drawn with full line, while those representing TUG are drawn with dashed line.
It can clearly be seen that BRRC has an outlier for test section M2. The Cr values are
too high. This may be due to the fact that BRRC measured this surface separately, turning with the vehicle with a small turning radius and accelerating very strongly on a small distance. These manipulations of the trailer even caused an impact with the vehicle at a certain moment. The acceleration may have caused higher Cr values for
M2. This problem will be verified by BRRC in the near future.
At 50 km/h the absolute values of ES14 lie together very closely, when discarding outlier M2.
However, TUG drum measurements show a difference between ES14/BRRC and ES14/TUG (see Figure 10.2 and Figure 10.3), which is surface and speed dependent (Cr 0.001 – 0.003).
Also a different load was used. TUG used a load of 4000 N while BRRC used only a load of 2000 N due to suspension limitations of the trailer. A higher difference
similar pattern can be seen for all graphs.
because of this was expected, which is not the case. A
ES14/BRRC_50 ES14/TUG_50 ES14/BRRC_80 ES14/TUG_80 0,022 0,024 0,012 0,014 0,016 0,018 0,02 C r 0,008 0,01 0,004 0,006 0 0,002 M1 F L1 L2 E1 E2 M 0,026 2 A C A' N Test sections
igure 8.13: Cr for different test sections measured by BRRC and TUG at 50 and 80 km/h
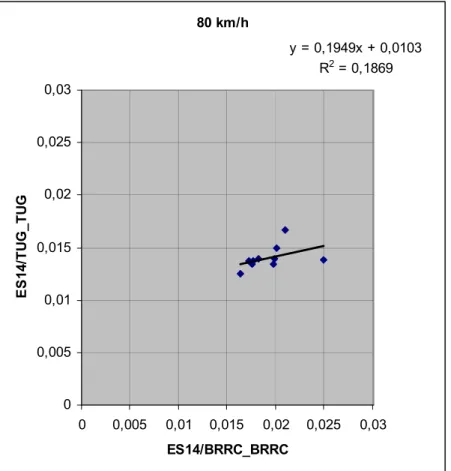
8.4.2.2 Relation between BRRC and TUG ES14 tyre
measurements
A fair correlation is found at 50 km/h (see Figure 8.14). However if M2 would have been discarded, even a very good relation would be found (R² = 0.818).
No correlation appears at 80 km/h (see Figure 8.15). However if M2 would have been discarded, a rather good correlation would be found (R² = 0.612), but reproducibility would be very poor as the BRRC values are consistently much higher.
50 km/h y = 0,4191x + 0,0083 R2 = 0,4718 0 0,005 0,01 0,015 0,02 0,025 0,03 0 0,005 0,01 0,015 0,02 0,025 0,03 ES14/BRRC_BRRC E S 14 /T UG _T UG
Figure 8.14: Correlation between Cr measured by BRRC and TUG with ES14 at 50 km/h
80 km/h y = 0,1949x + 0,0103 R2 = 0,1869 0 0,005 0,01 0 0,005 0,01 0,015 0,02 0,025 0,03 ES14/BRRC_BRRC E S U 0,025 0,03 0,02 G 0,015 14/ T U G _T
8.4.3 BASt - BRRC
8.4.3.1 All measurements
Even though BASt and BRRC did not perform measurements with the same tyre type and thereby no conclusions about reproducibility can be made, it is interesting to compare the measurement results.
All measurements performed by BASt and BRRC with ES16 and ES 14 are plotted in Figure 8.16. To make a clearer distinction between institutes, all measurements of BASt are plotted with full line, while those of BRRC are plotted with dashed line. BRRC values are clearly higher, which is due to the tyre size. Based on TUG measurements performed with ES14 and ES16, it can be assumed that the difference in Cr at 50 km/h is about 0.006 to 0.007 (see Figure 9.3). The graphs of
the measurements at 50 km/h show a Cr difference of the same order of magnitude
see Figure 8.16). The higher values at 80 km/h are also partly caused by the lack of wind shielding of the BRRC trailer.
0 0,002 0,004 0,006 0,008 0,01 0,012 0,014 0,016 0,018 0,02 0,022 0,024 0,026 M1 F L1 L2 E1 E2 M2 A C A' N Test sections C r
ES14/BRRC_50 ES16/BASt_50 ES14/BRRC_80 ES16/BASt_80
8.4.3.2 Relation between ES16/BASt and ES14/BRRC tyre
measurements
nd ES14/BRRC are analyzed. A good correlation achieved at 50 km/h while there is not found any correlation at 80 km/h (see Figure .17 and Figure 8.18). This may be due to the high influence of wind at higher speed
ed, a very good relation at 50 km/h (R² = 0.838) nd a rather low correlation at 80 km/h would be found (R² = 0.429).
Correlations between ES16/BASt a is
8
of the BRRC trailer.
If outlier M2 would have been discard a
No conclusions about reproducibility can be drawn.
50 km/h y = 0,5523x + 0,0030 R2 = 0,6306 0,03 0 0,005 0,01 0,015 0,02 0,025 0 0,005 0,01 0,015 0,02 0,025 0,03 ES14/BRRC_BRRC E S 16 /B AS t_ BA S t
80 km/h y = 0,1318x + 0,0079 0 0,005 0,01 0,015 0 0,005 0,01 0,015 0,02 0,025 0,03 ES14/BRRC_BRRC E S 16 /BAS BAS R2 = 0,1750 0,025 0,03 0,02 t t_
9 Additional tests
9.1 Tyres
9.1.1 Measurements
TUG performed measurements on the test track with all tyres to detect differences between tyres of the same type. However ES14/BRRC and ES16/BASt were not measured. The measurement results are shown in Figure 9.1 and Figure 9.2.
Speed 50 km/h, aver. dir E & W
0,000 0,002 0,004 0,006 0,008 0,010 0,012 0,014 0,016 0,018 0,020 M1 F M2 L1 L2 G E1 E2 C A' A Test sections Cr
AAV4/BASt AAV4/TUG AAV4/TUG_CT ES14/TUG ES16/TUG SRTT/BASt SRTT/TUG
Figure 9.1: Measurements performed by TUG with all tyres at 50 km/h on test track
Speed 80 km/h, aver. dir E & W
0,000 0,002 0,004 0,006 0,008 0,010 0,012 0,014 0,016 0,018 0,020 M1 F M2 L1 L2 G E1 E2 C A' A Test sections C r
AAV4/BASt AAV4/TUG AAV4/TUG_CT ES14/TUG ES16/TUG SRTT/BASt SRTT/TUG
It appears that the AAV4 tyres BASt SRTT tyres differ substa
give values close to each other, but the TUG and ntially.
lated corrections
between tyres of the same type (SRTT. AAV4). only a etween the two AAV4 tyres (see Figure 9.3 and Figure from the same batch unlike the SRTT tyres and one of
es with ifferent sizes. It is amazing that tyre size may have such a dramatic influence.
9.1.2 Tyre re
When looking at differences small difference was noted b
.4). The AAV4 tyres came 9
them even had a corrupted tread pattern. At 80 km/h the differences are slightly larger than at 50 km/h. The two SRTT’s differ by approx. 30 %, which is alarming. The reason must be studied. The difference between ES14 and ES16 can be found in the graph for TUG test tyres. These may be used when comparing tyr
d 50 km/h -0,001 0,000 0,001 0,002 0,003 0,004 0,005 0,006 0,007 0,008 M1 F M2 L1 L2 E1 E2 C A' A Test sections M ea sur ed di ff er enc e Cr AAV4 BASt-TUG SRTT BASt-TUG ES14-ES16 TUG
80 km/h -0,001 0,000 0,001 0,007 0,008 0,002 0,003 0,004 0,005 0,006 M eas u red d if fer en ce C r AAV4 BASt-TUG SRTT BASt-TUG ES14-ES16 TUG M1 F M2 L1 L2 E1 E2 C A' A Test sections
Figure 9.4: Cr difference between tyres measured by TUG on test sections
The relative difference expressed in percentage is shown in Table 9.1. A positive value means that Cr measured with the BASt tyre is higher. It can clearly be seen that
the SRTT’s differ the most at 50 km/h: 19.7 - 39.5 %. The difference is slightly smaller at 80 km/h: 15.5 - 28.7 %. The highest difference between the two AAV4’s with normal tread is only 3.8 % at 80 km/h.
Table 9.1: Relative difference in percentage between tyres measured by TUG on test sections
Speed 50 km/h 80 km/h
Test section AAV4 BASt-TUG SRTT BASt-TUG AAV4 BASt-TUG SRTT BASt-TUG M1 1.0% 37.1% -0.5% 24.7% F 1.3% 33.4% -0.8% 22.4% M2 0.8% 34.6% 1.2% 22.7% L1 0.8% 37.5% 1.5% 28.7% L2 0.8% 31.9% 1.2% 26.6% E1 2.0% 37.5% 0.8% 25.5% E2 1.5% 39.5% 0.9% 24.6% C 1.7% 29.1% 3.8% 23.0% A' 2.6% 24.7% 3.6% 23.7% A 1.8% 19.7% 3.1% 15.5%
Table 9.2 shows the relative difference in percentage between the AAV4/TUG tyre with normal and with corrupted tread. A positive value means that Cr measured with
the tyre with normal tread is higher. The difference between the tyres is higher at higher speed: approximately 3 % at 50 km/h and approximately 15 % at 80 km/h.
Table 9.2: Relative difference in percentage between AAV4/TUG_CT and AAV4/TUG Test section 50 km/h 80 km/h M1 3.2% 15.0% F 3.2% 12.9% M2 3.1% 13.8% L1 3.1% 16.6% L2 2.6% 15.2% E1 2.8% 15.6% E2 4.3% 15.2% C 3.7% 15.3% A' 1.9% 14.3% A 1.1% 14.0%
Analyses were made to explore the influence of this difference between tyres. This was done for tyres of the same type, namely AAV4 and SRTT. AAV4/BASt_BASt and SRTT/BASt_BASt were corrected to AAV4/TUG_BASt and SRTT/TUG_BASt by subtracting the difference found in Figure 9.3 and Figure 9.4.
For SRTT the graphs are now situated rather close to each other. They almost show at 50 km/h nd approximately 7 % at 80 km/h.
the same absolute values (see Figure 9.5) within about 20 %. However the relative difference between the institutes is still quite high: approximately 16 %
a
The tyre correction also improves the correlation at 50 km/h (see Figure 9.6 and Figure 8.9). The correlation at 80 km/h remains the same, which is excellent (see Figure 9.7 and Figure 8.10).
With tyre correction 0,002 0,016 0,018 0,02 0,022 0,024 0,026 Test sections
SRTT/BASt_50_correction SRTT/TUG_50 SRTT/BASt_80_correction SRTT/TUG_80
0,01 0,012 0,014 C r 0,004 0,006 0,008 0 M1 F L1 L2 E1 E2 M2 A C A'
Figure 9.5: Cr for different test sections measured by BASt and BRRC with SRTT tyre correction
50 km/h with tyre correction y = 0,6295x + 0,0021 R2 = 0,8405 0 0,005 0,01 0,015 0,02 0,025 0,03 0 0,005 0,01 0,015 0,02 0,025 0,03 SRTT/BASt_BASt_correction S RT T /T UG _T UG
Figure 9.6: Correlation Cr measured by TUG and BASt with SRTT corrected for tyre difference at 50 km/h
80 km/h with tyre correction
y = 0,9224x + 0,0001 R2 = 0,9841 0 0,005 0,01 0,015 0,02 0,025 0,03 0 0,005 0,01 0,015 0,02 0,025 0,03 SRTT/BASt_BASt_correction S R T T /TU G _TU G
Figure 9.7: Correlation Cr measured by TUG and BASt with SRTT corrected for tyre difference at 80 km/h
The tyre correction does not improve the comparison between absolute AAV4 values much (see Figure 9.8). The relative difference between the institutes is quite high: approximately 12 % at 50 km/h and approximately 6 % at 80 km/h.
Moreover the correlation at 50 km/h is lower than without corrections (see Figure 9.9 and Figure 8.11). The correlation at 80 km/h on the contrary did improve (see Figure 9.10 and Figure 8.12).
With tyre correction
0 0,002 0,004 0,006 0,008 AAV4/BASt_50_correction AAV4/TUG_50 AAV4/BASt_80_correction AAV4/TUG_80 0,01 0,012 0,014 0,016 0,018 0,02 0,022 0,024 0,026 M1 F L1 L2 E1 E2 M2 A C A' Test sections C r
Figure 9.8: Cr for different test sections measured by BASt and BRRC with AAV4 tyre correction
50 km/h with tyre correction y = 0,8231x + 0,0043 R2 = 0,8770 0,025 0,03 0 0,005 0,01 0,015 0,02 0 0,005 0,01 0,015 0,02 0,025 0,03 AAV4/BASt_BASt_correction AAV 4/ T UG _T UG
Figure 9.9: Correlation Cr measured by TUG and BASt with SRTT corrected for tyre difference at 50 km/h
80 km/h with tyre correction
y = 0,1822x + 0,0126 R2 = 0,2283 0 0,005 0,01 0,015 0,02 T UG 0,025 0,03 0 0,005 0,01 0,015 0,02 0,025 0,03 AAV4/BASt_BASt_correction AAV 4/ T UG _
Figure 9.10: Correlation Cr measured by TUG and BASt with SRTT corrected for tyre difference at 80 km/h