http://www.diva-portal.org
This is the published version of a paper published in Nutrition Journal.
Citation for the original published paper (version of record):
Jobs, E., Adamsson, V., Larsson, A., Jobs, M., Nerpin, E. et al. (2014)
Influence of a prudent diet on circulating cathepsin S in humans.
Nutrition Journal, 13(84): 1-5
http://dx.doi.org/10.1186/1475-2891-13-84
Access to the published version may require subscription.
N.B. When citing this work, cite the original published paper.
Permanent link to this version:
S H O R T R E P O R T
Open Access
Influence of a prudent diet on circulating
cathepsin S in humans
Elisabeth Jobs
1, Viola Adamsson
2, Anders Larsson
4, Magnus Jobs
3, Elisabet Nerpin
1, Erik Ingelsson
4,
Johan Ärnlöv
3,4and Ulf Risérus
2*Abstract
Background: Increased circulating cathepsin S levels have been linked to increased risk of cardiometabolic diseases and cancer. However, whether cathepsin S is a modifiable risk factor is unclear. We aimed to investigate the effects of a prudent diet on plasma cathepsin S levels in healthy individuals.
Findings: Explorative analyses of a randomized study were performed in 88 normal to slightly overweight and hyperlipidemic men and women (aged 25 to 65) that were randomly assigned to ad libitum prudent diet, i.e. healthy Nordic diet (ND) or a control group (habitual Western diet) for 6 weeks. Whereas all foods in the ND were provided, the control group was advised to consume their habitual diet throughout the study. The ND was in line with dietary recommendations, e.g. low in saturated fats, sugars and salt, but high in plant-based foods rich in fibre and unsaturated fats.
The ND significantly decreased cathepsin S levels (from 20.1 (+/−4.0 SD) to 19.7 μg/L (+/−4.3 SD)) compared with control group (from 18.2 (+/−2.9 SD) to 19.1 μg/L (+/−3.8 SD)). This difference remained after adjusting for sex and change in insulin sensitivity (P = 0.03), and near significant after adjusting for baseline cathepsin S levels (P = 0.06), but not for change in weight or LDL-C. Changes in cathepsin S levels were directly correlated with change in LDL-C.
Conclusions: Compared with a habitual control diet, a provided ad libitum healthy Nordic diet decreased cathepsin S levels in healthy individuals, possibly mediated by weight loss or lowered LDL-C. These differences between groups in cathepsin S were however not robust and therefore need further investigation.
Keywords: Nordic prudent diet, Cathepsin S, Weight loss, Cardiometabolic risk factors Findings
Introduction
Cathepsin S is highly expressed in antigen presenting cells [1-3] and has important functions in the major histocompatibility complex (MHC) class II antigen pres-entation [4]. Furthermore it degrades extracellular matrix [5].
Elevated circulating cathepsin S concentrations predict mortality in elderly men [6] and it has been linked to cardiovascular disease (CVD), type 1 and type 2 diabetes, cancer [7-10] and inflammation [11,12]. Cathepsin S is also associated with LDL-C and HDL-C [13-15]. Fur-thermore it is increased in adipose tissue and serum
of obese persons [16,17], whereas studies in obese wo-men have indicated that weight loss by obesity sur-gery or energy-restricted diet decrease serum cathepsin S [17,18].
As cathepsin S appears to be a novel promising risk marker of both cardiometabolic and malignant diseases, it is important to examine the effect of diet on cathepsin S concentrations. We hypothesized that a healthy nordic diet (ND) could reduce plasma levels of cathepsin S. The aim was to investigate the effects of a ND, eaten ad libitum, on plasma levels of cathepsin S in the NORDIET-trial. A secondary aim was to investigate the relationships between changes in cathepsin S concentrations and changes in cardiometabolic risk factors.
* Correspondence:ulf.riserus@pubcare.uu.se
2
Department of Public Health and Caring Sciences, Clinical Nutrition and Metabolism, Uppsala University, 75185 Uppsala Science Park, Sweden Full list of author information is available at the end of the article
© 2014 Jobs et al.; licensee BioMed Central Ltd. This is an Open Access article distributed under the terms of the Creative Commons Attribution License (http://creativecommons.org/licenses/by/4.0), which permits unrestricted use, distribution, and reproduction in any medium, provided the original work is properly credited. The Creative Commons Public Domain Dedication waiver (http://creativecommons.org/publicdomain/zero/1.0/) applies to the data made available in this article, unless otherwise stated.
Subjects and methods Subjects
During December 2007, subjects living in Bollnäs, Sweden, were recruited by advertisements in the local news-paper. The inclusion criteria were healthy (as assessed by a physician), men and women between 25 and 65 years, plasma LDL-C ≥3.5 mmol/L¯1, body mass index (BMI) ≥20 and ≤ 31 kg m2, for women and men respect-ively [19]. Subjects with hypertension, CVD, diabetes and other chronic disease and those on lipid-lowering drugs were excluded.
Study design
The study was conducted between February and May, 2008. Eighty-eight subjects were randomly assigned to one of two groups: a ND or a control group following their usual diet.
Clinical and laboratory assessments were performed at baseline and after 6 weeks. The trial was conduc-ted in accordance with the CONSORT statement and registered in the Current Controlled Trials database (http://www.controlled-trials.com); International Stand-ard Randomized Controlled Trial Number (ISRTCTN): 77759305.
Written informed consent was given by all subjects. The study was approved by the regional ethical commit-tee in Uppsala.
Outcome measures
In the present post-hoc study of the NORDIET-trial we aimed to investigate changes in plasma cathepsin S levels during ND as compared with a control group. We also investigated possible relationships between change in plasma cathepsin S and changes in weight, insulin sensi-tivity, triglycerides (TG), LDL-C, HDL-C, systolic blood pressure (SBP) and diastolic blood pressure (DBP).
Intervention
All main meals were provided to the subjects in the ND group. The assessment of diet and the change in diet during the study has been described previously [19].
Prudent diet
The ND was based on the Nordic nutrition recommen-dations (NNR) [20] and contained characteristic foods used in Nordic countries including fruits (e.g. apples) and berries (e.g. blueberries), legumes, vegetables, low-fat dairy products and low-fatty fish (e.g. salmon). The ND also included LDL-C lowering foods (e.g. oats; barley, almonds and psyllium seeds) [21,22]. The ND was pro-vided ad libitum.
Control group
The subjects in the control group were instructed to fol-low their habitual diet, eaten ad libitum, and continue their usual physical activity.
Clinical assessment
Bodyweight was measured (kg) in light clothing without shoes, on a digital scale. Blood pressure was measured manually in a sitting position after 5 minutes rest. Two measurements were performed with a 2 minutes inter-val, and the average value was calculated.
Biochemical analysis
Venous blood was collected after a 12 h fast and plasma separated and frozen in −70°C before analyses. Plasma cathepin S was measured by ELISA (human cathepsin S (Total), DY1183, R&D Systems). The intraassay CV was 7%. Glucose, total cholesterol, TG and HDL-C plas-ma concentrations were measured using a Roche Diag-nostics Cobas® 6000. Plasma LDL-C was calculated by Friedewalds formula [23]. Plasma insulin was measured by an enzyme-linked immunoassay kit (Mercodia AB, Uppsala, Sweden). Homeostasis model assessment-insulin resistance (HOMA-IR) was calculated [24].
Statistical analysis
Data are presented as mean ± SD. Per protocol analysis was used to assess effects of diet on outcome measures. Unpaired T-test was used to assess differences in plasma levels of cathepsin S during follow up, between the two groups, and as a second step, we used ANCOVA to ad-just for sex, weight and cardiometabolic risk factors. To assess associations between change in cathepsin S and change in cardiometabolic risk factors linear regression and Pearson’s correlation was used. A two-tailed P-value of 0.05 was regarded as significant. STATA, version 11 was used for statistical analysis.
Results
Only two subjects (one in each group) dropped out [19], leaving 86 subjects with data on cathepsin S. After ran-domization, the two groups were almost identical with regards to the baseline characteristics, with the excep-tion of a significant difference in cathepsins S levels bet-ween the groups (Table 1).
Effect of diet on cathepsin S
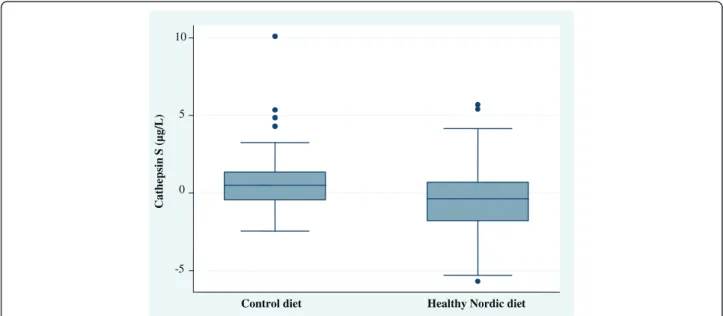
As previously reported [19], ND reduced body weight (mean 3 kg) as compared with the control group. Here we report a significant difference between ND and con-trol group in the change of cathepsin S concentrations (P = 0.03 for between group difference, Figure 1).
The ND decreased plasma cathepsin S levels, from 20.1 (+/−4.05 SD) to 19.7 μg/L (+/−4.3 SD) whereas
Jobset al. Nutrition Journal 2014, 13:84 Page 2 of 5
the control group changed from 18.2 (+/−2.9 SD) to 19.1 μg/L (+/−3.8 SD) (Figure 1). Mean difference in change between groups were 12.0 μg/L (+/−25.2 SD). These differences remained after adjusting for sex (p = 0.03) and insulin sensitivity (P = 0.03), whereas adjusting for weight change (P = 0.22), LDL-C (P = 0.36) and total cholesterol (P = 0.48) abolished the significant differ-ence between groups. However, adjusting for baseline
cathepsin S levels attenuated the difference between groups (p = 0.06), as well as adjustments for differences in systolic and diastolic blood pressure (p = 0.06). As de-scribed previously [19], dietary compliance was overall excellent and the dietary goals were achieved for most nutrients”. E.g. total fat was 27%E (goal 25-35%E), carbo-hydrate 52%E (45-60%E), protein 19%E (10-20%E), fibre 54%E (25–35) and saturated fat 5%E (<8%E).
Table 1 Baseline characteristics after randomization
Characteristics Control group Healthy Nordic diet P-value
Subjects, n 42 44
Age (year) 53.4 ± 8.1 52.6 ± 7.8 0.63
Men/women 15/27 17/27 0.83
Body weight (kg) 78.0 ± 13.3 76.0 ± 10.5 0.44 Body mass index (kg m¯2) 26.5 ± 3.3 26.3 ± 3.2 0.79 SBP (mmHg) 123 ± 14 128 ± 12 0.50
DBP (mmHg) 83 ± 9 81 ± 7 0.16
Plasma TG (mmol/L¯1) 1.4 ± 0.8 1.6 ± 0.8 0.32 Plasma cholesterol (mmol/L¯1) 6.4 ± 0.7 6.2 ± 0.8 0.36 Plasma LDL cholesterol (mmol/L¯1) 4.2 ± 1.0 4.0 ± 0.6 0.33 Plasma HDL cholesterol (mmol/L¯1) 1.5 ± 0.5 1.5 ± 0.4 0.28 LDL/HDL ratio 2.8 ± 1.0 2.9 ± 0.8 0.80 Plasma glucose (mmol/L¯1) 4.9 ± 0.6 4.9 ± 0.5 0.54 Insulin resistance (HOMA-IR) 1.3 ± 0.6 1.2 ± 0.6 0.47 Cathepsin Sμg/L 18.3 ± 2.99 20.1 ± 4.1 0.02
Data are means ± SD. HDL: High-density lipoprotein; LDL: Low-density lipoprotein; HOMA-IR: Homeostasis model assessment-insulin resistance; SBP: systolic blood
pressure; DBP: diastolic blood pressure; TG: triglycerides. Differences between the Nordic Diet and Control groups were assessed using unpaired two-tailedt-tests.
-5 0 5 10 Cathep sin S ( µg/L)
Control diet Healthy Nordic diet
Figure 1 Differences in serum cathepsin S levels between the control diet and healthy Nordic diet (ND) from baseline to 6 weeks. Serum levels of cathepsin S were decreased compared with the control diet (P = 0.03).
Correlations between changes in cathepsin S and cardiometabolic risk factors
Changes in cathepsin S tended to be correlated with changes in weight (P = 0.05), which remained after adjust-ing for sex (P = 0.04). Furthermore, change in cathepsin S were correlated with change in LDL-C (P = 0.03) and total cholesterol (P = 0.01). These associations remained signifi-cant after adjusting for sex (P = 0.03 and 0.01 respectively). Change in cathepsin S did not correlate with changes in insulin sensitivity, TG, HDL-C, SBP or DBP (Table 2). Discussion
Adherence to an ad libitum ND for 6 weeks slightly de-creased levels of plasma cathepsin S in normal or slightly overweight individuals, compared with the control group. Change in circulating cathepsin S concentrations were correlated with changes in body weight, LDL-C and total cholesterol suggesting that these factors may mediate the effect on cathepsin S levels.
To our knowledge, there are no studies investigating the effects of a prudent diet on cathepsin S concentra-tions. In accordance with our results, studies in obese women, showed that energy restriction and weight loss reduced cathepsin S mRNA and cathepsin S release in adi-pose tissue as well as serum levels [17,18]. Body weight decreased by on average 3 kg during ND [19], and there was a near significant correlation between the change in body weight and change in cathepsin S. This study sug-gests that an ad libitum diet reduces weight and cathepsin S levels also in non-obese subjects, including men. The decreased cathepsin S levels did not remain significant after adjusting for weight change, suggesting that weight reduction mediated some of the dietary effect on cathep-sin S. Adjusting for baseline levels of cathepcathep-sin S resulted in a P-value of 0.06 which may indicate lack of statistical power, rather than a lack of effect on cathepsin S. How-ever, regression-towards-the mean effect cannot be com-pletely excluded. Cathepsin S is strongly associated with
cardiovascular risk factors, such as elevated triglycerides [17] and LDL-C [13]. Subjects on ND for 6 weeks mark-edly improved their cardiovascular risk profile, including lowering of LDL-C, insulin resistance, and blood pressure [19] and it is possible that this improvement affected the levels of cathepsin S. Our study supports such findings since adjustment for change in LDL-C and total choles-terol as well as change in body weight abolished the sig-nificant difference between the groups.
Higher levels of circulating cathepsin S are associated with insulin sensitivity [10]. In the current study we could not find a correlation between changes in serum cathepsin S and changes in HOMA-IR. However, the change in insulin sensitivity induced by the 6-week ND was moderate, albeit statistically significant [19]. Perhaps the discrepancy also could be explained by insulin sensi-tivity being measured with euglycemic clamp in the obser-vational study, whereas it was estimated by HOMA-IR in the present study.
The strengths of this study include the randomized controlled design, and also all foods were provided to the ND group ensuring high compliance and low drop-out rates. It should however be noted that some of the observed effect on cathepsin S levels was likely to be caused by the fact that all foods was provided to the ND, but not the control group. Also, these results cannot be directly translated to clinical settings were dietary advice alone is given. Further studies are needed where all foods are provided to both ND and control groups, or dietary advice is given to both groups. Although all sub-jects in both groups were instructed to maintain their physical activity level during the study, possible differ-ences between groups in physical activity level and smo-king were not assessed and may thus have introduced some bias. Since only Caucasian Swedish subjects were included, generalizability to other ethnic groups is un-clear. Further, it should be noted that this is a post-hoc study of the NORDIET trial, and thus there was no
Table 2 Correlations between change in serum cathepsin S concentrations and changes in weight and cardiometabolic risk factors during 6 weeks in the whole sample (n = 86)
Characteristics r P-value β-coefficient (95% CI) P-value Weight 0.22 0.04 241.60 (3.37-479.81) 0.05 HOMA-IR 0.04 0.72 166.02 (−734.40-1066.44) 0.72 LDL-C 0.24 0.03 794.11 (84.86-1503.36) 0.03 HDL-C 0.18 0.12 1914.54 (−505.34-4334.43) 0.12 TG 0.02 0.84 114.98 (−1007.58-1237.56) 0.84 Cholesterol 0.27 0.01 755.29 (163.79-1346.90) 0.01 SBP 0.15 0.18 29.43 (−13.37-72.24) 0.18 DBP 0.17 0.12 46.16 (−12.39-104.71) 0.12
Data are correlation coefficients and regression coefficients, with 95% CI. All models are adjusted for sex. HOMA -IR: Homeostasis model assessment-insulin resistance, HDL-C:High-density lipoprotein cholesterol; LDL -C: Low-density lipoprotein cholesterol, TG: Triglycerides, SB P: Systolic blood pressure, DBP: Diastolic blood pressure; Pearson's correlation and Linear regression has been used.
Jobset al. Nutrition Journal 2014, 13:84 Page 4 of 5
power calculation done on cathepsin S when designing this trial.
Conclusion
These results suggest that a prudent diet comprising healthy Nordic foods may moderately reduce cathepsin S levels in non-obese men and women. This association seems to be partly, mediated by diet-induced weight loss and/or reduced LDL-C concentrations. Given the close link between cathepsin S and various obesity-linked dis-eases and increased mortality risk, the present results warrant further investigation in further studies.
Abbreviations
ANCOVA:Analysis of covariance; BMI: Body mass index; CVD: Cardiovascular disease; DBP: Diastolic blood pressure; HOMA-IR: Homeostasis model assessment-insulin resistance; LDL-C: Low density lipoprotein cholesterol; MHC: Major histocompatibility complex; ND: Nordic diet; NNR: Nordic Nutrition recommendations; SBP: Systolic blood pressure; TG: Triglycerides.
Competing interests
The authors declare that they have no competing interests.
Authors’ contributions
The authors’ responsibilities were as follow; E.J, V.A and U.R designed and conducted the research. V.A and A.L assessed data. E.J, U.R and J. Ä analyzed the data. E.J and U.R wrote the manuscript; All authors had responsibility for final content. All authors read, critically reviewed and approved the final manuscript.
Acknowledgements
This study was supported by the Swedish Heart-Lung Foundation, Thuréus Foundation, Cerealia Foundation Dalarna University, and Uppsala University. UR was funded by the Swedish Research Council.
Author details
1
Department of Public Health and Caring Sciences/Geriatrics, Uppsala University, Uppsala, Sweden.2Department of Public Health and Caring
Sciences, Clinical Nutrition and Metabolism, Uppsala University, 75185 Uppsala Science Park, Sweden.3Dalarna University, School of Health and
Social Studies, Falun, Sweden.4Department of Medical Sciences, Uppsala University, Uppsala, Sweden.
Received: 6 February 2014 Accepted: 11 August 2014 Published: 16 August 2014
References
1. Shi GP, Munger JS, Meara JP, Rich DH, Chapman HA: Molecular cloning and expression of human alveolar macrophage cathepsin S, an elastinolytic cysteine protease. J Biol Chem 1992, 267:7258–7262. 2. Shi GP, Webb AC, Foster KE, Knoll JH, Lemere CA, Munger JS, Chapman HA:
Human cathepsin S: chromosomal localization, gene structure, and tissue distribution. J Biol Chem 1994, 269:11530–11536.
3. Morton PA, Zacheis ML, Giacoletto KS, Manning JA, Schwartz BD: Delivery of nascent MHC class II-invariant chain complexes to lysosomal compartments and proteolysis of invariant chain by cysteine proteases precedes peptide binding in B-lymphoblastoid cells. J Immunol 1995, 154:137–150. 4. Shi GP, Sukhova GK, Grubb A, Ducharme A, Rhode LH, Lee RT, Ridker PM,
Libby P, Chapman HA: Cystatin C deficiency in human atherosclerosis and aortic aneurysms. J Clin Invest 1999, 104:1191–1197.
5. Petanceska S, Canoll P, Devi LA: Expression of rat cathepsin S in phagocytic cells. J Biol Chem 1996, 271:4403–4409.
6. Jobs E, Ingelsson E, Riserus U, Nerpin E, Jobs M, Sundstrom J, Basu S, Larsson A, Lind L, Arnlov J: Association between serum cathepsin S and mortality in older adults. JAMA 2011, 306:1113–1121.
7. Liu J, Ma L, Yang J, Ren A, Sun Z, Yan G, Sun J, Fu H, Xu W, Hu C, Shi GP: Increased serum cathepsin S in patients with atherosclerosis and diabetes. Atherosclerosis 2006, 186:411–419.
8. Wang B, Sun J, Kitamoto S, Yang M, Grubb A, Chapman HA, Kalluri R, Shi GP: Cathepsin S controls angiogenesis and tumor growth via matrix-derived angiogenic factors. J Biol Chem 2006, 281:6020–6029.
9. Verrijn Stuart AA, Schipper HS, Tasdelen I, Egan DA, Prakken BJ, Kalkhoven E, de Jager W: Altered plasma adipokine levels and in vitro adipocyte differentiation in pediatric type 1 diabetes. J Clin Endocrinol Metab 2012, 97:463–472.
10. Jobs E, Riserus U, Ingelsson E, Sundstrom J, Jobs M, Nerpin E, Iggman D, Basu S, Larsson A, Lind L, Arnlov J: Serum Cathepsin S Is Associated With Decreased Insulin Sensitivity and the Development of Diabetes Type 2 in a Community-Based Cohort of Elderly Men. Diabetes Care 2013, 36:163–165.
11. Gupta S, Singh RK, Dastidar S, Ray A: Cysteine cathepsin S as an immunomodulatory target: present and future trends. Expert Opin Ther Targets 2008, 12:291–299.
12. Jobs E, Riserus U, Ingelsson E, Helmersson J, Nerpin E, Jobs M, Sundstrom J, Lind L, Larsson A, Basu S, Arnlov J: Serum cathepsin S is associated with serum C-reactive protein and interleukin-6 independently of obesity in elderly men. J Clin Endocrinol Metab 2010, 95:4460–4464.
13. Lindstedt L, Lee M, Oorni K, Bromme D, Kovanen PT: Cathepsins F and S block HDL3-induced cholesterol efflux from macrophage foam cells. Biochem Biophys Res Commun 2003, 312:1019–1024.
14. Spielmann N, Mutch DM, Rousseau F, Tores F, Hager J, Bertrais S, Basdevant A, Tounian P, Dubern B, Galan P, Clement K: Cathepsin S genotypes are associated with Apo-A1 and HDL-cholesterol in lean and obese French populations. Clin Genet 2008, 74:155–163.
15. Sukhova GK, Zhang Y, Pan JH, Wada Y, Yamamoto T, Naito M, Kodama T, Tsimikas S, Witztum JL, Lu ML, Sakara Y, Chin MT, Libby P, Shi G: Deficiency of cathepsin S reduces atherosclerosis in LDL receptor-deficient mice. J Clin Invest 2003, 111:897–906.
16. Taleb S, Lacasa D, Bastard JP, Poitou C, Cancello R, Pelloux V, Viguerie N, Benis A, Zucker JD, Bouillot JL, Coussie C, Basdevant A, Langin D, Clement K: Cathepsin S, a novel biomarker of adiposity: relevance to atherogenesis. Faseb J 2005, 19:1540–1542.
17. Naour N, Rouault C, Fellahi S, Lavoie ME, Poitou C, Keophiphath M, Eberle D, Shoelson S, Rizkalla S, Bastard JP, Rabasa-Lhoret R, Clement K, Guerre-Millo M: Cathepsins in human obesity: changes in energy balance predominantly affect cathepsin s in adipose tissue and in circulation. J Clin Endocrinol Metab 2010, 95:1861–1868.
18. Taleb S, Cancello R, Poitou C, Rouault C, Sellam P, Levy P, Bouillot JL, Coussieu C, Basdevant A, Guerre-Millo M, Lacasa D, Clement K: Weight loss reduces adipose tissue cathepsin S and its circulating levels in morbidly obese women. J Clin Endocrinol Metab 2006, 91:1042–1047.
19. Adamsson V, Reumark A, Fredriksson IB, Hammarstrom E, Vessby B, Johansson G, Riserus U: Effects of a healthy Nordic diet on cardiovascular risk factors in hypercholesterolaemic subjects: a randomized controlled trial (NORDIET). J Intern Med 2011, 269:150–159.
20. Becker W, Lyhne N, Pedersen A, Aro A, Fogelholm M, Thórsdottír I: Nordic Nutrition Recommendations 2004. Integrating nutrition and physical activity. In Copenhagen: Nordic Council of Ministers; 2004.
21. Theuwissen E, Mensink RP: Water-soluble dietary fibers and cardiovascular disease. Physiol Behav 2008, 94:285–292.
22. Phung OJ, Makanji SS, White CM, Coleman CI: Almonds have a neutral effect on serum lipid profiles: a meta-analysis of randomized trials. J Am Diet Assoc 2009, 109:865–873.
23. Friedewald WT, Levy RI, Fredrickson DS: Estimation of the concentration of low-density lipoprotein cholesterol in plasma, without use of the preparative ultracentrifuge. Clin Chem 1972, 18:499–502.
24. Matthews DR, Hosker JP, Rudenski AS, Naylor BA, Treacher DF, Turner RC: Homeostasis model assessment: insulin resistance and beta-cell function from fasting plasma glucose and insulin concentrations in man. Diabetologia 1985, 28:412–419.
doi:10.1186/1475-2891-13-84
Cite this article as: Jobs et al.: Influence of a prudent diet on circulating cathepsin S in humans. Nutrition Journal 2014 13:84.