Cities xxx (xxxx) xxx
0264-2751/© 2020 The Authors. Published by Elsevier Ltd. This is an open access article under the CC BY-NC-ND license
(http://creativecommons.org/licenses/by-nc-nd/4.0/).
Governance reaction to the emerging megacity shrinkage in Tokyo: The
case of the Tsukuba express transit-suburban region
Eigo Tateishi
a,*, Kyoko Takahashi
b, Taku Nakano
c aDepartment of Urban Studies, Malm¨o University, 8F, Nordenski¨oldsgatan 1, Malm¨o, SwedenbGraduate School of Frontier Sciences, The University of Tokyo, Building of Environmental Studies, 5-1-5 Kashiwanoha, Kashiwa City, Chiba 277-8563, Japan cBuilding Research Institute, 1 Tachihara, Tsukuba city, Ibaraki 305-0802, Japan
A R T I C L E I N F O Keywords: Megacity Shrinkage Governance Post-suburb Tokyo A B S T R A C T
This article provides insight into how the governance system of megacities, as an assemblage of many different factors, can preemptively react to emerging shrinkage. This is a topic that is rarely addressed in the current literature. The article examines the suburban region of the Tokyo Megacity served by the Tsukuba Express. The region is studied both quantitatively and qualitatively using a mixed-methods approach, and the results are related to the governance system model as originally developed. The results suggest that shrinkage-preemptive governance involves a mix of pro-growth and shrinkage-adapting strategies, but that implementing such stra-tegies through interpolicy and intermunicipal coordination is problematic in growing metropolitan suburbs. We suggest (1) the national government plays a role in interpolicy coordination and regional governance of shrinkage, (2) the formation of political consciousness around regional transit infrastructure to foster regional coordination, and (3) a regional effort to restructure regional socio-economic identities to mitigate dependence on Tokyo and enhance economic resilience. This study shows that governance system models can assist planners and policymakers in engaging with the complexity of post-growth urban challenges.
1. Introduction
Urban shrinkage is the sustained population loss of a given spatial area that dynamically interacts with factors such as demography, the economy, and the built environment (Haase et al., 2016, p. 89; Martinez- Fernandez et al., 2012, p. 214; Schilling & Logan, 2008, p. 452; Weaver et al., 2017, pp. 3–5). It poses planning challenges in national and local contexts because it is associated with vacant houses, urban decay, eco-nomic decline, unemployment, and segregation (D¨oringer et al., 2019). As these challenges become apparent internationally, urban governance to adapt to shrinkage is increasingly receiving scholarly attention (D¨oringer et al., 2019, p. 7).
Studies have revealed that it is challenging to change conventional pro-growth modes of governance to shrinkage-adapting modes (Hartt, 2018; Hospers, 2014; Pallagst et al., 2019; Schlappa, 2017). For plan-ners, accepting shrinkage is not simply switching to new professional approaches—it is a long-term “mourning process” to fundamentally restructure urban governance (Elzerman & Bontje, 2015, p. 88). Studies seem to agree that planners’ perceptions are a key determinant of different trajectories of this long restructuring process (Camarda et al.,
2015, p. 37; Pallagst et al., 2019, 2017; Sousa & Pinho, 2014). Yet the mode of governance can also be changed through the interactions be-tween different factors such as the severity of shrinkage (Hartt, 2018, p. 11), the path dependency of planning institutions (Galster, 2019; Sousa & Pinho, 2015), public debates on shrinkage (Haase et al., 2017; Mal-lach et al., 2017; Nelle et al., 2017), the self-confidence of local actors (Lang, 2012), and intermunicipal competition for financial and political resources (Lang, 2012; Phelps & Wood, 2011; Weck & Beißwenger, 2014).
These findings suggest that the strategy and formation of shrinkage- adapting governance cannot be adequately comprehended by focusing only on a single, static aspect of urban governance in action. Rather, we need to analyze governance as a governance system: a dynamic assem-blage of actors (with their own perceptions and public debate), objects (policies, institutions, and the conditions of shrinkage), and relations (e. g., with other localities) to work toward urban shrinkage (Tietjen & Jørgensen, 2016).
There is an emerging need for planning studies to understand how a governance system will (and should) react to the shrinkage of megacities. Although this topic is rarely addressed in the current literature, there are * Corresponding author.
E-mail address: eigo.tateishi@mau.se (E. Tateishi).
Contents lists available at ScienceDirect
Cities
journal homepage: www.elsevier.com/locate/cities
https://doi.org/10.1016/j.cities.2020.103033
two reasons why the governance of megacity shrinkage should receive more scholarly attention. First, considering potential depopulation on a global scale (Bricker & Ibbitson, 2019; Vollset et al., 2020), the shrinkage of megacities is a probable scenario during the 21st century (Kawai et al., 2019; Phelps & Ohashi, 2018; Sorensen, 2019). Experts in many mature cities are paying attention to post-sub-urbanization—“densification, complexification and diversification of the suburbanization process” (Charmes & Keil, 2015, p. 581) and its politics (Hudalah & Firman, 2012; McArthur, 2017; Phelps & Wood, 2011; Sweeney & Hanlon, 2017). Yet the shrinkage of megacities—the disassembly of inner and outer metropolitan suburbs—will likely raise a new international challenge in urban politics and governance (Kawai et al., 2019; Phelps & Ohashi, 2018, pp. 1–2). Second, considering their strong physical and institutional path dependency (Sorensen, 2019), megacities should, even when they are growing, incorporate prepared-ness for future shrinkage in their governance system to effectively adapt to post-growth (sub)urbanization (Ohashi & Phelps, 2020). Accordingly, our objective is to understand how the governance system of megacities, as an assemblage of multifaceted factors, can preemptively react to emerging shrinkage.
To achieve this objective, we studied the Tokyo Megacity (hereafter, Tokyo), one of the first shrinking megacities in the world (UN, 2018). While the Tokyo Metropolis is likely to experience population growth until 2025 (Tokyo Metropolitan Government, 2017), its metropolitan suburbs have been shrinking since 2010 (MLIT, 2018c1; Suzuki & Asami,
2019). Hence, these suburbs are both the frontline as well as the “frontier” of emerging megacity shrinkage (Ohashi & Phelps, 2020). The future retrofitting or regeneration of these suburbs is emerging as a governance challenge (Phelps & Ohashi, 2018; Phelps & Wood, 2011). We have chosen to focus our case analysis on the metropolitan suburban region served by the Tsukuba Express (hereafter, TX suburban region) as this is the newest and last large-scale transit-oriented development in Japan (Osawa, 2019¯ ). We identified two research questions: (1) How is the governance system of the TX suburban region reacting to the emerging shrinkage? and (2) What are the major challenges for the TX governance system to more effectively adapt to the emerging shrinkage? We begin the case analysis by explaining our governance system model, which synthesizes recent findings of dynamic interactions be-tween urban governance and different endogenous and exogenous fac-tors. After sketching the shrinkage of Japan and Tokyo and describing our TX case, we explain the mixed-methods approach of this article. We performed (1) spatial quantitative analysis using demographic projec-tion data to identify the spatio-temporal condiprojec-tion of shrinkage in the re-gion. Then (2) we conducted eight interviews with 21 experts to understand the current condition of governance (e.g., perception, current governance strategies, and potential policy challenges). Our research strategy is to use our model as an analytical framework to analyze the (in)consistency between the conditions of emerging shrinkage and cur-rent governance.
In this study, we paid particular attention to two aspects: aging population and transport planning. It is projected that Tokyo’s depop-ulation will progress together with a massively aging popdepop-ulation ( Naka-nishi, 2017). Therefore, our analysis strives to grasp the interaction effect of a declining and aging population. Our analysis also strives to capture the complex interactions between urban governance and transport governance because the social interaction between the Tokyo Metropolis and its metropolitan suburbs is largely underpinned by advanced public transport systems (Calimente, 2012; Chorus & Berto-lini, 2016; Yajima & Ieda, 2015).
We drew two conclusions from our study. First, the reaction of the governance systems in the TX suburban region to emerging shrinkage and an aging population well reflects the emerging spatio-temporal pattern of shrinkage. Second, shrinkage-preemptive governance seems
to be feasible for growing metropolitan suburbs, yet the lack of inter-policy and intermunicipal coordination remains a hindrance. On the regional coordination problem, we share the concern of Ohashi and Phelps (2020) regarding the increasing difficulty of forging “metropo-litics” (cf., Orfield, 1997).
To foster effective governance of shrinkage, we formulated three policy implications: (1) the national government needs to play an active coordinator role in interpolicy coordination and regional governance of shrinkage, (2) transit-suburban municipalities need to develop a regionally orchestrated political consciousness around the issues of regional transit infrastructure to foster regional coordination, and (3) metropolitan suburbs need to restructure regional socio-economic identities to mitigate their dependence on the Tokyo Metropolis and to enhance their economic resilience for emerging shrinkage. Like the actor-network analysis of strategic planning by Tietjen and Jørgensen (2016), governance system models like the one presented here may help planners and policymakers to engage with the complexity of post- growth urban challenges, which are asymmetrically different from those in the growth phase (Galster, 2019).
2. Governance of shrinkage as a system
The governance—“the process through which collective affairs are managed” (Healey, 1997: 206)—of shrinkage is increasingly receiving scholarly attention as urban shrinkage poses planning challenges in various national and local contexts. However, studies reveal that the governance of growth, largely depending on elitist, market-driven pol-icies, still overwhelms the planning practice in shrinking cities (Hartt, 2018; Hospers, 2014; Pallagst et al., 2019; Schlappa, 2017). This attachment to pro-growth governance is unsurprising. For planners, accepting shrinkage is not simply switching to new professional approaches—it is a long-term “mourning process” to fundamentally restructure urban governance (Elzerman & Bontje, 2015, p. 88).
Underlying the difficulty of this process is the complexity of urban shrinkage. As Galster (2019) argues, shrinking processes tend to be dynamically nonlinear. This nonlinearity makes it virtually impossible for planners to find a definitive set of solutions to shrinkage (Tietjen & Jørgensen, 2016, p. 30) because any policy actions will engender “waves of repercussions” and create new conditions for further problem-solving processes (Haase et al., 2017; Rittel & Webber, 1973). This means that the problem-solving process may be endless—the solution to shrinkage challenges could be incessant restructuring of governance per se.
Further, this continuous problem-solving process is not run solely by the planning authority (Galster, 2019; Weaver et al., 2017). To optimize the distribution of resources and infrastructure on a regional scale, civic engagement (Hospers, 2014; Roˇcak, 2019; Schlappa, 2017) and inter-municipal cooperation (Hospers, 2014; Weaver et al., 2017) will be essential for shrinking cities. However, such participatory governance will add complexity to the problem-solving process. It will be necessary to find solutions to ineffective communication between different actors (Hospers, 2014; Roˇcak, 2019) and intermunicipal rivalry (Hospers, 2014; Weaver et al., 2017) to effectively assemble different actors, in-stitutions, and places for a common goal.
All in all, the “mourning” restructuring process exposes planners to a new planning landscape where people, ideas, actions, places, and the relations between them need to be incessantly (re)assembled to form a mode of governance to resolve ever-changing shrinkage challenges (Tietjen & Jørgensen, 2016). Accordingly, the strategy and formation of shrinkage-adapting governance cannot be adequately comprehended by examining a single, static factor of urban governance in action. Rather, we need to analyze it as a governance system: a dynamic assemblage of actors, objects, and relations. Fig. 1 displays our governance system model. The remaining subsections explain the seven components of this model: (1) condition of shrinkage, (2) mode of governance, (3) policy action, (4) perception, (5) institutional path dependency, (6) public debate, and (7) intermunicipal relations.
2.1. Condition of shrinkage
The occurrence of a set of locally manifested challenges posed by shrinkage is called the condition of shrinkage (Haase et al., 2017). While depopulation is a primary indicator for the condition (Hospers, 2014, p. 1508; Weaver et al., 2017), most researchers and practitioners agree that shrinkage will produce an assortment of challenges on multiple spatial scales due to its cumulative causation process (Hospers, 2014; Stryjakie-wicz & Jaroszewska, 2016; Weaver et al., 2017, also cf., Myrdal, 1957). Brain drain, as a form of selective outmigration, further eviscerates the economic productivity of a locality (Hospers, 2014; Nelle, 2016). Loss of an economic base and selective migration tend to spatially concentrate social disadvantages (Cortese et al., 2014; Weaver et al., 2017). An aging population can be exacerbated by the outmigration of young families (Cortese et al., 2014; Hospers, 2014), which increases expenditure on care for the elderly. Accelerating depopulation will increase the abandonment and decay of houses (Jeon & Kim, 2019; Schilling & Logan, 2008; Sousa & Pinho, 2015), leading to problems with physical planning and the prop-erty tax base. Cumulatively, these challenges will push public organiza-tions into budgetary austerity, which in itself limits public ability to handle shrinkage (Rink et al., 2014; Schlappa, 2017). The importance of the condition in our model is that it largely influences the perception of local actors (the red arrows in Fig. 1[A]) and induces public debates on shrinkage (the [1] arrows in Fig. 1[A]).
2.2. Perception
Studies seem to agree that planners’ perception is a key determinant of different trajectories of the long restructuring process of governance (Elzerman & Bontje, 2015; Pallagst et al., 2019, 2017; Sousa & Pinho, 2014). In our model, the condition of shrinkage plays a crucial role in altering planners’ perception (Hartt, 2018) (the red arrows in Fig. 1[A]). As the shrinkage worsens, planners will move between four “perceptual” stages: (1) ignoring (shrinkage is perceived as a temporary transition), (2) observation without acceptance (shrinkage is recognized but not accepted), (3) certain acceptance (top-down initiatives are considered to manage decline), and (4) acceptance (pro-growth policies are replaced by shrinkage-adapting policies) (Hartt, 2018, p. 11). With this perception change, planners endogenously alter the mode of governance and subse-quent policy actions (Pallagst et al., 2019) (the blue arrows in Fig. 1[A]). Note that the perception of shrinkage does not always unidirectionally shift from pro-growth to shrinkage-adapting—the opposite can also happen (Pallagst et al., 2019, pp. 11–12), as indicated by the “potential pro-growth rebound” dotted line in the bottom right of Fig. 1[A]. 2.3. Mode of governance
The mode of governance—how collective affairs are man-aged—depends on different dimensions. These include governing re-lations, governing logic, key decision-makers, political objectives (DiGaetano & Strom, 2003, pp. 365–366), power distribution, actor coordination mechanisms, formal and informal institutions, and the formulation of political interests (Evers & de Vries, 2013, p. 539). The literature on governance of shrinkage often considers that civic engagement (Hospers, 2014; Roˇcak, 2019; Schlappa, 2017) and inter-municipal coordination (Hospers, 2014; Weaver et al., 2017) are crucial to optimizing the distribution of resources and infrastructures on a regional scale under budgetary austerity. Participatory problem-solving processes also matter because policy actions—even if ostensibly aimed at adapting to shrinkage—are not always implemented in a politically equitable manner (Hackworth, 2015; Kirkpatrick, 2015). On the other hand, pro-growth modes of governance are usually based on institu-tionalized public-private partnerships, which are distinctly elitist and thus rarely participatory (Pierre, 1999). Yet Bernt (2009) illustrated that given the high dependency of shrinking cities on national grants, such pro-growth governance will end up with a “grant coalition” to bargain
“over a bill that is paid by somebody else” (p. 765). Although the mode of governance can be shifted by many factors, our model assumes that incremental changes in planners’ perceptions are the prime driver of mode shift (the red arrows in Fig. 1[A]).
2.4. Policy actions
Policy actions to address shrinkage can be divided into two major camps. Pro-growth policies refer to market-driven measures such as large- scale urban development, place marketing, compact cities relying on smart growth, the revitalization of suburbs, attracting private investment, and employment opportunities (Hospers, 2014; Sweeney & Hanlon, 2017; Weaver et al., 2017). On the other hand, gesundshrumpfen (healthy shrinking) in Germany, slimpen (smart shrinking) in the Netherlands (Hospers, 2014, p. 1513), and rightsizing/greening in the USA (N´emeth & Hollander, 2016; Schilling & Logan, 2008) and France (B´eal et al., 2019) are examples of shrinkage-adapting policy actions. These policy actions commonly attempt to stabilize population by balancing the “scales” of physical and social infrastructures (Schilling & Logan, 2008; Weaver et al., 2017). This balancing can be done by, for example, demolition, land banking, greening (Schilling & Logan, 2008), promoting social in-novations (Dax & Fischer, 2018), and restructuring educational in-frastructures (Nelle, 2016). Yet the distinction between shrinkage- adapting and pro-growth modes of policy actions is not always crystal clear. As Joo and Seo (2018) observed, these two modes of policy actions can even coexist at the same time. In our model, as Pallagst et al. (2019) have empirically demonstrated, policy actions often reflect the stage of planners’ perception (via a change in governance mode).
2.5. Path dependency
The formal institutions of urban governance are likely path-dependent: institutional legacies of the past constrain the institutional innovations of today (Streeck & Thelen, 2005). The path dependency can prevent plan-ners from perceiving shrinkage (the purple arrows and the red shade in the bottom left of Fig. 1[A]). While the existence of certain institutions can induce inaction by planners who accept shrinkage (Hartt, 2018, p. 10), the lack of shrinkage-effective planning institutions (Galster, 2019; Sousa & Pinho, 2015) can also make planners reluctant to accept shrinkage (Hospers, 2014). Breaking such a path dependency often requires a critical external event or discourse (Pallagst et al., 2019, p. 5; Sorensen, 2018)—a critical juncture: a period of “contingency during which the usual con-straints on action are lifted or eased” (Mahoney & Thelen, 2009, p. 7). This is shown by the [!] mark in the top right of Fig. 1[A].
2.6. Public debate
Recent studies illuminate how public debates2 can affect the gover-nance of urban shrinkage (Haase et al., 2017; Mallach et al., 2017; Nelle et al., 2017). The rise of strong public debate can sometimes be a critical juncture (Pallagst et al., 2019) to induce a “paradigm shift” (Schlappa, 2017) that affects how shrinkage is perceived across many actors in a governance system. However, public debates can also induce incremental change of a governance system. Haase et al. (2017) propose a mechanism of such incremental change through a cumulative interaction between the conditions of shrinkage, public debates on shrinkage, and the mode of governance (and subsequent policy actions). According to these authors, there are five paths in this cumulative interaction (the black arrows [1]– [5] in Fig. 1[A] correspond to the processes [1]–[5] below):
2 Note that the participants in “public debate” include not only formal actors in planning arenas but also informal actors in academia and the public sphere (Haase et al., 2017, p. 96).
[1] A condition induces public debate on shrinkage together with implemented (first) policy actions [condition/policy action ➔ debate] [2] Public debates problematize a set of issues of shrinkage and
in-fluence how governance shapes policy actions (through affecting formal actors’ perception in a governance system) [debate ➔ perception ➔ governance3]. As a result, an adjusted form of policy actions will be taken (the blue arrows in Fig. 1[A]) [3] Actualized policy actions alter the condition as a result of their
success or failure [policy action ➔ condition]
[4] The “altered” condition, together with “changed” governance and “actualized” policy actions, modify public debates through reviewing their efficacy/outcomes, shifting focal points, and replacing priorities [governance, policy action, & conditions ➔ debate] (cf., Nelle et al., 2017, pp. 121–122)
[5] Public debates may affect the condition by altering how it is perceived and defined [debate?➔4 condition] (Haase et al., 2017, p. 99).
Note that the way debates are formed and interact with the condition and governance of shrinkage is embedded in local, regional, and na-tional contexts (Fig. 1[B]), and thus varies from locality to locality and from one nation to another (Haase et al., 2017, p. 98).
2.7. Intermunicipal relations
The governance system of a municipality relationally interacts with the governance system of other municipalities (the black-dotted lines in Fig. 1[B]) and these relations are embedded into regional and national contexts. These intermunicipal relations are often competitive rather than collaborative (Elzerman & Bontje, 2015; Hospers, 2014; Weaver et al., 2017) (the red arrows in Fig. 1[B]). Intermunicipal rivalry—like “parish pump politics” in the UK and “church tower politics” in Germany (Hospers, 2014, p. 1515)—is a typical obstacle to establishing regional collaboration (Weaver et al., 2017; Weck & Beißwenger, 2014). Addi-tionally, competitive relations may be maintained for a variety of rea-sons: professionalism (government officials’ accountability to their local constituencies) (Hospers, 2014, p. 1515), regional politics (the regional fragmentation of cultural backgrounds and a high level of local chau-vinism) (Elzerman & Bontje, 2015), institutions (municipal authorities as self-interested institutions) (Weaver et al., 2017). Hence, these competitive relations could potentially affect all components5 of our model.
In a megacity context, intermunicipal competition could have further implications. Metropolization is increasingly transforming megacities into “networked spaces, combining the resources of various actors, policies, and initiatives” (Weck & Beißwenger, 2014, p.2161, also cf., Brenner, 2019) (the blue field in Fig. 1[B]). As a result, metropolitan municipalities will be exposed to a competitive socio-political landscape to gain positive spill-over effects from these networked spaces (Lang, 2012; Weck & Beißwenger, 2014). Given the complex dynamics of “divergent and convergent” fortunes across municipalities within a shrinking megacity (Ohashi & Phelps, 2020), shrinking municipalities
will want to differentiate their (socially perceived) position to attract particular social groups (e.g. young professionals) and remain compet-itive within the post-growth metropolitan economy (Sweeney & Hanlon, 2017). However, such a social differentiation process increases the dif-ficulty of intermunicipal coordination. Ohashi and Phelps (2020) make the point that this fragmented, competitive socio-political landscape will further increase the difficulties in forging “metropolitcs,” or inter-municipal coordination, in the face of megacity shrinkage.
3. Urban shrinkage in Japan and case description 3.1. Shrinking Japan and the national policy response
Japan is experiencing nation shrinkage. According to MIAC,6 the Japanese population peaked at 127 million in 2007 and will shrink to 88 million by 2065, a decrease of 30%. The proportion of over-65-year-olds to the total working-age population (15–64) will swell from 48% in 2019 to 75% in 2065 (MIAC, 2018). This nationwide declining and aging population already dominates public debate in Japan (D¨oringer et al., 2019; Hattori et al., 2017; Pallagst et al., 2019). As for urban shrinkage, it is acknowledged as a distinct concept for researchers and policy-makers, and is currently shaping a focus on vacant houses and urban decay (D¨oringer et al., 2019; Hattori et al., 2017).
Despite the decentralization of planning authority in Japan, the na-tional government still largely influences the comprehensive strategic planning of municipal development (Pallagst et al., 2019; Sorensen, 2011). Thus far, the national government is fighting shrinkage using the Compact+Network Initiative, which aims to strategically downsize the Table 1
Differences between the optimization plan and networking plan framework.
Location Optimization Plan Framework (Ricchi Tekiseika Keikaku)
Local Public Transportation Networking Plan Framework (Moukeisei Keikaku) Foundational law The Law for Making Partial
Amendments to the Law for Special Measures concerning Urban Reconstruction (2014)
The Law on Revitalization and Rehabilitation of Local Public Transport Systems (2014)
Main features - Aiming at spontaneous rightsizing through designating zones for urbanization and deurbanization. - Within the urbanization zones, municipal governments can designate zones to centralize different urban functions to further promote the rightsizing of cities.
- Aiming at restructuring transport networks by collaboration with private transport operators and community members. - Municipal governments are able to implement restructuring projects of transport services within their municipality subject to the consent of service operators. Regional
coordination In principle, each municipal level. However, spontaneous coordination with neighboring municipalities is not prohibited. Revision of the framework is made to incentivize municipalities to promote regional coordination (2020).
Institutionally, regionally coordinated plans are possible and recommended. Each municipality is even able to implement its own plan together with a regional plan.
Coordination with another framework
It is not necessary to make an optimization plan together with a networking plan,even though it is preferable.
It is preferable to coordinate with planning sections responsible for an optimization plan. No. of plans made 278 out of 1724
municipalities (as of 2019, December). 500 out of 1724 municipalities (as of 2019, March) *Including regionally coordinated plans
3 In the original framework, Haase et al. use “policy and action” instead of “governance.” However, as they noted that public debate (“discourse” in their term) shapes “the framework within which policy response takes place” (p. 99), we assume that public debate influences the perception of formal actors within a governance system, thus the dominant mode of governance. As a result, policy actions, as the product of urban governance, will be planned and implemented differently.
4 Here, ←? mark means that this relation is, as Haase et al. note, weak and subtle compared to other relations in the framework.
5 Note that the condition of shrinkage is hardly confined to a locality—it is often a part of regional shrinkage (Weaver et al., 2017, p. 154). Hence, a competitive view will likely lead planners to an insufficient interpretation of the
urban fabric and transport network of shrinking towns and cities (MLIT, 2014, 2015). To promote this initiative, in 2014 the national govern-ment introduced the Location Optimization Plan (Optimization Plan) framework and the Local Public Transportation Networking Plan (Networking Plan) framework (MLIT;, 2014, 2015, 2018d). These two institutional frameworks enable municipalities to design and implement their own optimization plan and networking plan to promote the transit- oriented compactification of their cities/towns (Hatakeyama, 2017; MLIT, 2018e; Yoshinaka & Enomoto, 2017).
An optimization plan allows planners to designate different types of planning regulation zones within their municipality to strategically induce intracity migrations toward municipal urban centers (MLIT, 2018d). The framework does not, however, provide any institutional instrument to regionally coordinate optimization plans (MLIT, 2018d). On the other hand, the networking plan framework gives planners the legal basis to design and implement local public transport restructuring projects (Restructuring Projects) to strategically downsize the transport network. This is done by, for example, adjusting the timetables of buses and trains, consolidating transport services for depopulating areas, and promoting sharing mobility services (MLIT, 2018a; Yoshinaka & Eno-moto, 2017). In contrast to optimization plans, the networking plan framework allows municipalities to regionally coordinate networking plans (MLIT, 2018b).
Synchronized implementation of the optimization plans and networking plans are not prescribed by the frameworks, nor is coordi-nation between them. The absence of interpolicy (between urban and transport policies) coordination seems to reflect the general lack of an institutional mechanism to coordinate the comprehensive land-use and transport plans at each municipality (Uchiumi, 2013). Table 1 summa-rizes the differences in both frameworks.
3.2. Shrinking Tokyo
Rural villages and local cities/towns have long been the main loca-tion of urban shrinkage in Japan, but with the naloca-tional shrinkage, even the Tokyo Megacity (see Fig. 2) cannot remain immune to post-growth urbanization. Tokyo is the first shrinking megacity in the world (UN, 2018). While the 23 special districts of the Tokyo Metropolis—the central inner-city area of the Tokyo Megacity— will likely experience population growth until 2025 (Tokyo Metropolitan Government, 2017), its inner suburbs have already shown signs of the shrinkage of the property market (Kawai et al., 2019). Urban shrinkage has already been apparent in the metropolitan (outer) suburbs of the Tokyo Megacity since 2010 (MLIT, 2018c; Suzuki & Asami, 2019). Hence, Tokyo’s inner/ outer suburbs are both the frontline and the “frontier” of emerging megacity shrinkage (Ohashi & Phelps, 2020).
The sustainable urban management and future retrofitting of Tokyo’s suburbia are emerging as a governance challenge (Nakano, 2019; Ohashi & Phelps, 2020; Phelps & Ohashi, 2018). Realizing regional governance for such (post-)suburban retrofitting requires the mobilization of various levels of political and institutional capabilities rather than confining suburban governance to a local level (Phelps & Wood, 2011, p.2606). However, this is a tall order for the inner/outer suburbs of Tokyo due to the emerging fragmented socio-spatial land-scape of suburbia. Pioneering academic studies on the shrinkage of Tokyo have revealed that Tokyo failed to achieve a balanced, poly-centric structure in its metropolitan-suburban centers (Kubo, 2020; Nakano, 2019; Phelps & Ohashi, 2018), despite its long planning tradition of developing a polycentric metropolis (Sorensen, 2001). On the contrary, as Tokyo shrinks, the (already subtle) centrality and uni-formity of its inner/outer suburbs seems to be transforming into a more diverse and complex socio-spatial landscape (Nakano, 2019; Ohashi & Phelps, 2020) while central Tokyo is emerging as “the clear winner” (Kubo, 2020, p. 42). This “diversity in decline” will impede the forma-tion of intermunicipal collaboraforma-tion or “metropolitics” (Ohashi & Phelps, 2020, cf., Orfield, 1997).
Tokyo’s suburbs have long been developed as a mixture of functional, transit-oriented suburban centers around the stations of regional transit networks and residential areas surrounding these suburban centers (Chorus, 2009; Chorus & Bertolini, 2016; Yajima & Ieda, 2015). Hence, transit-suburban regions (the blue ellipses in Fig. 2) are a major part of the suburban landscape of Tokyo. However, Nakano (2019) demonstrates that the spatial structure of these regions is “reversing” in the sense that suburban centers are populating and losing urban (business and com-mercial) functionalities, while suburban residential areas are depopulat-ing and gaindepopulat-ing urban functionalities. Kubo (2020) also points to the strategic importance of transit-oriented suburban centers, in stark contrast to the rest of the shrinking metropolitan suburbs. Accordingly, we consider the transit-suburban regions to be an important spatial context in which to observe the complex transformation of the socio-spatial land-scape of suburbs under the megacity shrinkage of Tokyo. The Tsukuba Express (TX) transit-suburban region (the TX suburban region), which we study, is one such transit-suburban regions (see the right panel of Fig. 2). 3.3. Case description of the TX suburban region
The TX line commenced operation in 2005 with a total length of about 58 km with 20 stations. A one-way terminal-to-terminal trip takes 54–60 min. According to the Metropolitan Intercity Railway Company (MIR, 2018), the operator of the TX line, the average daily ridership is 386,000. The TX region consists of seven municipalities: Tsukuba, Tsukuba Mirai, Moriya, Kashiwa, Nagareyama, Misato, and Yashio (cities), and four sub-municipalities (wards) in the Tokyo Metropolis (Fig. 2). Tsukuba City was developed as a satellite technopolis; thus, it is not technically a metropolitan suburb (Miao, 2018). However, for con-sistency, we included Tsukuba in our analysis. Hereafter, we refer to the seven TX-adjacent suburbs as the TX suburban region for brevity. Note that the TX suburban region is a gathering of metropolitan suburbs and does not belong to the urban core (the orange part in Fig. 2).
There are two reasons for selecting the TX suburban region. First, as the region is still in a growing phase, we can observe what mode of perception is dominant among planners and what factors will poten-tially impede the future change of governance mode. Second, most regional transit-oriented developments (TODs) in Tokyo were developed by private railway companies (Chorus, 2009; Yajima & Ieda, 2015), with the result that insights gained might not easily be applicable to the in-ternational context (Chorus & Bertolini, 2016). However, the TX sub-urban region is being developed by a varied group of actors, including private, public, and public-private partnerships, which makes the case more relevant to contexts outside Tokyo.
As of 2018, the region accommodates approximately 1.2 million residents. There are 16 intensive TOD project zones (TX development zones) designated by the Housing and Railway Development Act (Osawa, 2019¯ ). The total area of the TX development zones is about 24 km2, with plans to house 220,000 residents in the pipeline (ibid.). The TODs in the TX development zones represent what Calimente (2012) called “rail-integrated communities.” They are “high density, safe, mixed-use, pedestrian-friendly developments around railway stations that act as community hubs, served by frequent, all-day, rail rapid transit that is accessed primarily on foot, by bicycle, or by public transit” (p. 23). The photographs in Fig. 3 show examples of these rail-integrated communities in the TX development zones.
For analytical purposes, we divided the TX suburban region into three spatial scales: (1) entire TX suburban region, (2) TX-development zones, and (3) non-TX areas.7 The TX development zones consist of the 16 TX development zones plus small administrative areas (SAAs) whose geographical center is contained within a 1000-m radius buffer from each TX station. We consider these 1000-m buffers as a ridership 7 ArcGIS Pro© was used to conduct all spatial operations and process geographical data.
catchment area (ekiseiken) of each TX station. We defined municipal areas other than the TX development zones as non-TX areas. See Fig. 3 for the spatial division.
4. Methods and data 4.1. Mixed-methods strategy
We employed a mixed-methods approach to comprehend the interac-tion between quantitative aspects (the condiinterac-tion of shrinkage) and qualitative aspects (the condition of governance). We used method 1 for spatio-temporal analysis using demographic projection data to identify the spatio-temporal condition of shrinkage in the region. Then we used method 2 to understand the current condition of governance (i.e., perception, current governance strategies, and potential policy chal-lenges) by conducting eight interviews with 21 key actors. Our research strategy uses our model as an analytical framework to analyze the (in) consistency between the conditions of shrinkage and governance. Based on the analytical results, we then discuss how the governance of the TX suburban region can be more shrinkage-adapting.
4.2. Method 1: identifying the spatio-temporal condition of shrinkage 4.2.1. Raw data
We acquired demographic change data for 2015–2045 estimated by the National Institute for Land and Infrastructure Management. These data are estimated by the cohort component method based on the na-tional census in 2015. The spatial resolution of the data is small administrative areas (hereafter called “small areas”), which are the smallest administrative areas (SAAs) in Japan. There are 1105 small areas within the TX suburban region. The estimated populations of age groups older than 65 years were aggregated into a single “over 65” (+65) group.
The estimated total population of the region in 2020 was 1,189,990, while the recorded population was 1,216,313 in January 2020. The
algebraic percent error8 of the estimate is − 2.2%, which means the es-timates are slightly too low. The absolute percent error is 2.2%, which is slightly larger than the median values of the absolute percent error of the entire Japanese population (1.3%), but smaller than the 90-percentile value (4.1%) (Yamauchi & Koike, 2015). Considering the ongoing development around the TX stations, this underestimation is not sur-prising. So, we consider the estimates to offer a reliable overview of the geographical pattern of the shrinkage of the region.
4.2.2. The temporal length and severity of shrinkage
Capturing the condition of shrinkage requires consideration of tem-poral length and severity (magnitude) (Stryjakiewicz & Jaroszewska, 2016; Weaver et al., 2017). For temporal length, we developed a Python script to identify peaks of declining and aging populations at the small- area level to illustrate their spatio-temporal transition. This script de-tects (1) the year that indicates the maximum total population of a small area (i.e., the peak of the population curve), and (2) the year that in-dicates the maximum +65 population of a small area (i.e., the peak of the +65 population curve).
As for the length of depopulation, the earlier the population peak happens, the longer the period of shrinkage over the next 25 years. Accordingly, we labeled small areas whose population peak is in and after 2040 as shrinkage-resistant small areas for Subsection 5.1.2. By contrast, the earlier the aging population peak happens, the milder the population decrease will be over the coming 25 years (e.g., if the peak of +65 population is in 2020, then the number of elderly people will decrease in the next 25 years). Hence, we can consider that small areas whose +65 population peak is in and after 2040 as more aging-prevalent. The peak year information does not, however, tell us the severity of declining and aging populations. To detect the severity, we used the threshold method that operationalizes declining and aging populations Fig. 2. Reference maps of the Tokyo Megacity and the TX suburban region. The blue ellipses in the left-hand figure indicate transit-suburban regions. (For inter-pretation of the references to color in this figure legend, the reader is referred to the web version of this article.)
8 Algebraic Percent Error = (E − R) / R * 100, where E is an estimate and R is a recorded value (Yamauchi and Koike, 2015, p.221).
using pre-specified thresholds (Weaver et al., 2017, p. 8). Although the method can suffer from arbitrariness in the threshold selection, a threshold “depopulation by 25 % over 40 years” (the “25–40 shrinkage” scenario) has been used in various studies to detect severely shrinking areas (Schilling & Logan, 2008; Weaver et al., 2017, pp. 8–15). How-ever, since our data covers only 25 years after 2020, the “25–40 shrinkage” scenario is not directly applicable.
According to Weaver et al. (2017), the annual rate of exponential depopulation to yield “a 25% loss for 40 years” is approximately
− 0.7192%. An exponential population (de)growth function can be formulated as:
Pt=P0×ert
where Pt is the population after t years, P0 is the initial population (say 100%), e is Euler’s constant (~2.718), and r is the annual rate of exponential depopulation (here, − 0.7192% = − 0.007192) (Weaver et al., 2017, p. 15). If we insert t = 25 here and solve the equation for P25, Fig. 3. Examples of transit-oriented development around the TX suburban centers alongside the Tsukuba Express line and a reference map of geographical units of analysis.
we will obtain P25 ~ 83.54%. This percentage is an “intermediate” population share in 2045 to the initial population (in 2020) in the course of the “25–40 shrinkage” scenario (i.e., the final population share will be 75% in 2060). This is equivalent to a decrease of 16.46% in population since 2020.
Hence, we can consider small areas as severely shrinking if they expect to lose 16.5% of their population over the next 25 years (i.e., 2020–2045). Additionally, if a small area satisfies both (i) its estimated population change during 2015–2020 is negative and (ii) it expects to lose 16.5% of its population over the next 25 years, we labeled such small areas as already (severely) shrinking small areas in Subsection 5.1.1.
Similar to the “25–40 shrinkage” scenario, we applied a threshold “+65 population growth by 25 % over 40 years” (the “25–40 growth” scenario) to describe the severely aging population. We can consider small areas as severely aging if they expect their +65 population to grow 15.0% over the next 25 years. Note that the 15% threshold was deter-mined in the same manner as the 16.5% threshold for the detection of severely shrinking small areas. Similar to the already-shrinking criteria, if a small area satisfies both (i) its estimated +65 population change during 2015–2020 is positive and (ii) it expects its +65 population to grow 15.0% over the next 25 years, it is grouped with already (severely) aging small areas in Subsection 5.1.1.
4.3. Method 2: understanding the current governance condition
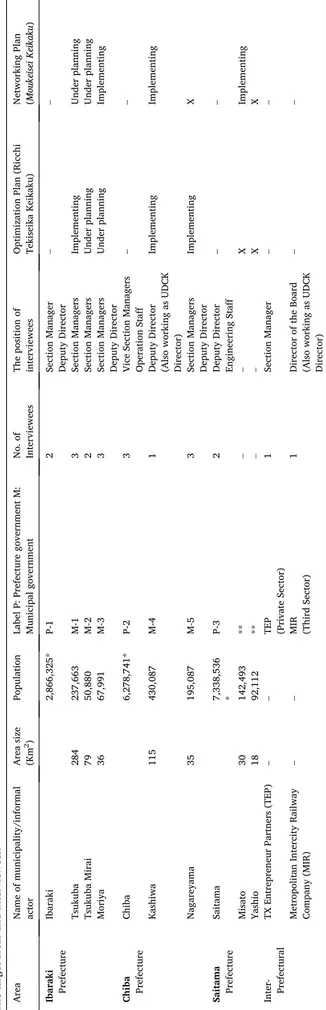
We conducted eight semi-structured interview sessions with 19 planners working in the target municipalities (Tsukuba, Tsukuba Mirai, Moriya, Kashiwa, and Nagareyama) and the prefectures (Saitama, Chiba, and Ibaraki). To enrich our understanding of coordination with informal actors, we also conducted two semi-structured interview ses-sions with two informal organizations. One interview was with a section manager at the Corporate Planning Department at MIR. The other interview was with a director of the board at TX Entrepreneur Partners (TEP) which is a start-up incubator working in the TX suburban region. Two of the experts interviewed also hold director positions at the Urban Design Center of Kashiwa-no-ha (UDCK),9 a multi-actor urban research center in Kashiwa. All interviews were conducted in Japanese between 9 January 2019 and 13 March 2019, and recorded with the permission of the interviewees. We transcribed all recorded materials into text files and translated them into English. Table 2 shows the label (P: Prefectural governments, M: Municipal governments, TEP: TX Entrepreneur Part-ners, MIR: Metropolitan Intercity Railway Company), and the number, and the positions of interviewees.
We prepared eleven guiding questions for the planners and the TEP practitioner, and ten questions for the MIR practitioner. These questions were based on the literature and our model and were aimed at capturing (1) the interviewees’ perception of urban shrinkage, (2) current and future governance/planning actions related to shrinkage, and (3) chal-lenges to urban-transport governance of future shrinkage (such as in-stitutions, coordination, and organization). The questions were slightly adjusted to the type of interviewees. Sample questions are:
•Do you think the shrinkage of Tokyo is relevant to your work and your municipality (e.g., pessimistic, optimistic, not of interest)? •If you think that the shrinkage of Tokyo (and your municipality) is
relevant, do you have any strategies for urban-transport policies to cope with challenges associated with future shrinkage?
•Are there any intramunicipal and intermunicipal governance efforts to coordinate strategies between the TX development zone(s) and other areas for future shrinkage?
•What are the challenges facing the current urban-transport gover-nance of your municipality regarding dealing with potential issues posed by future shrinkage?
Table 2 The target areas and interviewees. Area Name of municipality/informal actor Area size (Km 2) Population Label P: Prefecture government M: Municipal government No. of Interviewees The position of interviewees Optimization Plan (Ricchi Tekiseika Keikaku) Networking Plan (Moukeisei Keikaku ) Ibaraki Prefecture Ibaraki 2,866,325* P-1 2 Section Manager Deputy Director – – Tsukuba 284 237,663 M-1 3 Section Managers Implementing Under planning Tsukuba Mirai 79 50,880 M-2 2 Section Managers Under planning Under planning Moriya 36 67,991 M-3 3 Section Managers Deputy Director Under planning Implementing Chiba Prefecture Chiba 6,278,741* P-2 3 Vice Section Managers Operation Staff – – Kashiwa 115 430,087 M-4 1 Deputy Director (Also working as UDCK Director) Implementing Implementing Nagareyama 35 195,087 M-5 3 Section Managers Deputy Director Implementing X Saitama Prefecture Saitama 7,338,536 * P-3 2 Deputy Director Engineering Staff – – Misato 30 142,493 ** – – X Implementing Yashio 18 92,112 ** – – X X Inter- Prefectural TX Entrepreneur Partners (TEP) – – TEP (Private Sector) 1 Section Manager – – Metropolitan Intercity Railway Company (MIR) – – MIR (Third Sector) 1 Director of the Board (Also working as UDCK Director) – – Notes: [*] Total population of prefecture. [**] No appointments were possible with Misato and Yashio municipalities due to scheduling issues. The population of each municipality and prefecture is as of January 2020. 9 https://www.udck.jp/en/.
Interviews with elite informants present both opportunities and limitations in revealing the power landscape of a local political arena (Cochrane, 1998). However, this article is interested in describing the governance reaction to emerging shrinkage rather than analyzing the power dynamics across local actors (important as that may be.) Thus our set of interviews with planning experts and corporate elites seems suited to our analytical focus. The interviews took a minimum of 1 h. Some of them lasted up to 2 h, mostly with the senior experts (a director of the board, deputy directors, and section managers) from different fields (urban planning, transport planning, general planning, private sector, and third sector) (Table 2). We believe that the length of sessions and the credible mix of experts compensate adequately for the relatively limited number of interview sessions.
As for the missing interviews with the Misato and Yashio municipal governments, we acquired the information of the respective organiza-tions from the planners at the Saitama prefectural government. We also received different types of documents from the interviewees, including urban planning master plans (the comprehensive master plans of municipal urban planning in Japan), internal surveys, brochures explaining the TX development plans, and official maps of land-use planning and zoning. We used these documents to complement the interviews.
5. Results and discussion
Based on our governance system model, we divided our empirical results and analysis into five subsections: (5.1) the conditions of shrinkage, (5.2) the perception of shrinkage, (5.3) policy actions with some findings about institutional path dependency for transport plan-ning, (5.4) the mode of governance, and (5.5) the governance issues around intermunicipal competition. Note that, as explained in subsec-tion 3.1, in Japan public debates on urban shrinkage are already well established among the general public as well as among researchers and policymakers. Thus we here consider the public debates to be a general context rather than a distinct component of the model.
5.1. Condition of shrinkage
5.1.1. The current and future condition of declining and aging populations Our threshold analysis of the demographic estimates at the small- area scale shows a clear spatial duality of shrinking and aging pop-ulations (Fig. 4). In Fig. 4, red small areas depict “already (severely) shrinking” areas, and yellow small areas depict “already (severely) aging” areas. Fig. 4 shows that the ongoing shrinkage seems a more suburban-peripheral phenomenon, while the aging population is a more suburban-central phenomenon. This spatial duality is accentuated by the fact that there is only one small area showing that is both severely declining and aging (the blue small area in Fig. 4 close to the Moriya station). This area consists of a small settlement for agricultural pro-duction. How will this spatial duality evolve over the coming decades?
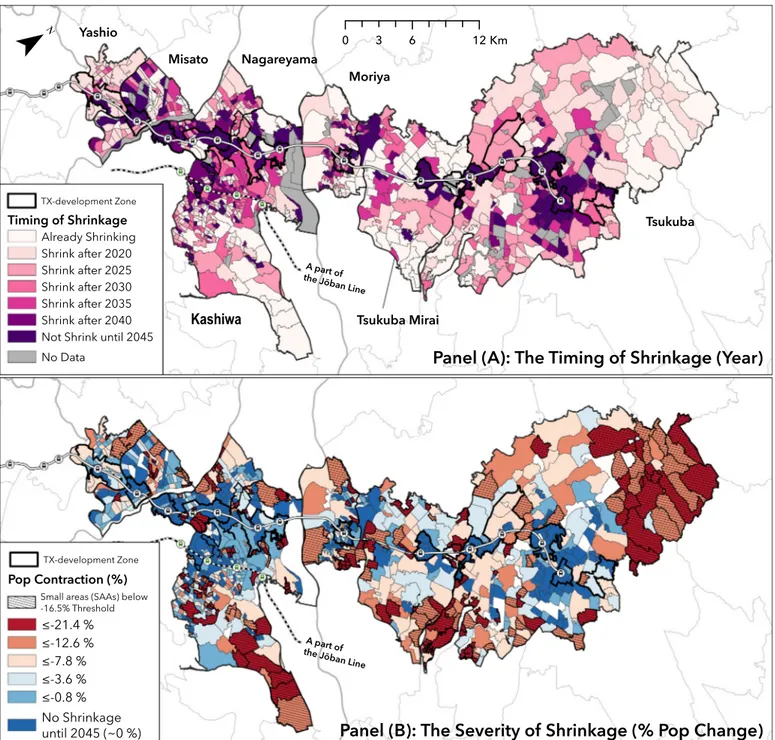
Different colors in Fig. 5 Panel (A) depict when the small areas will start shrinking. Those marked in light pink will start shrinking in the next few years and are thus very shrinkage-prone, while the dark purple small areas will resist shrinkage over the coming decades. The figure reveals that most shrinkage-resistant (dark purple) areas are clustered around the TX development zones and other transit-suburban centers of Kashiwa (Minami-Kashiwa and Kashiwa station-precincts of the J¯oban line) while the most shrinkage-prone areas (light pink) are located in the periphery.
Fig. 5 Panel (B) displays the estimated severity of shrinkage. Black-hatched small areas indicate that their depopulation rate is below the − 16.5% threshold (severely shrinking), while blue small areas indicate almost no shrinkage until 2045. Panel (B) indicates that the shrinkage-prone suburban peripheries, where shrinkage will last over a longer period, will experience more severe shrinkage, while the shrinkage-resistant suburban centers will depopulate at a
milder pace or even grow until 2045. All in all, the two panels illus-trate that the current spatial pattern of shrinkage—mostly a subur-ban-peripheral phenomenon—will continue in the coming decades: the TX suburban region will shrink severely from its peripheries and continue to shrink toward its suburban centers at a much slower pace.
Different colors in Fig. 6 Panel (C) depict when the +65 population of each small area will reach its peak. The small lighter-pink areas will see the peak of their +65 population in the next few years, and the aging of the population will thus soon become milder, or the number of seniors may even diminish. However, the dark purple small areas (i.e., the “Peak in/continues to increase after 2045” group) will experience an enduring increase of the +65 population over the coming decades. The figure reveals that the areas with the most enduring age increase (dark purple) are clustered around the transit-suburban centers, while the areas where the proportion of the elderly is diminishing (light pink) are located in the periphery.
Fig. 6 Panel (D) displays the estimated severity of the aging pop-ulation. Blue small areas depict the de-growth of the +65 population after their peak year. By contrast, red small areas (“severely aging areas”) will experience quicker and sustained increases in the +65 population over the coming decades. Panel (D) illustrates that the transit-suburban centers where the aging population will last over a long time will be a major space for an even older aging population, while the mildly-aging or elderly-diminishing (i.e., the number of elderly is diminishing) suburban peripheries will be gradually released from the pressure of the aging population over the coming decades. The picture of severely aging suburban centers is further accentuated by the fact that about 85% of the age-enduring areas are over the 15% threshold, and some severely aging areas within the TX development zones will have a sharp increase (more than 500%) in the +65 popu-lation. All in all, the two panels illustrate that the current spatial pattern of the aging population—mostly a suburban-central phenom-enon—will last into the coming decades.
5.1.2. Dual planning challenges
The quantitative analysis revealed that the spatio-temporal de-mographic pattern of the TX suburban region will follow a duality, albeit with some gradient between the two: (1) growing and rapidly aging transit-suburban centers, and (2) shrinking and mildly-aging or elderly- diminishing suburban peripheries. What planning challenges will this duality of shrinking and aging populations create?
Our interviewees (M-1, M-2, M-3, M-5, P-3, MIR) clarified that young families (mostly in their 30s) with children constitute the major population flow to the TX development zones. While this flow is creating the livability of these zones and makes them more resistant to shrinkage, it also means that these young families will get older at almost the same pace and will compose enduring and more sharply aging populations in these zones in the coming decades. This is likely to raise a planning challenge concerning how to retrofit “young fam-ily” oriented suburban centers to create more “elder-friendly” spaces under austere budgetary conditions owing to the overall shrinkage on the municipal scale.
On the other hand, some parts of the suburban periphery will lose both total and +65 population at the same time (the black-dotted circles in Panel (D) – “fading areas”). Because the total population is dimin-ishing in these fading areas (the flows of new residents have stopped), there will likely be no ownership renewal of houses owned by the elderly. Hence, the decrease of the elderly in these fading areas will expose housing stocks to under-utilization or even abandonment, as is being gradually observed in some TX suburban municipalities (M-3, M- 4, P-3). Also, these fading areas will likely create complexity for equitable rightsizing strategies, especially as regards public transport restructur-ing. As a transport planner said, “Is it possible to maintain a transport service exclusively for one old person remaining in an area? We are always discussing this” (M-2).
5.2. Perception
How does this emerging condition of shrinkage affect planners’ perception? Planners’ perceptions also seem to be divided due to the spatio-temporal duality of declining and aging populations we have identified.
In the TX development zones, most planners do not consider shrinkage a prioritized issue for now. A municipal planner explicitly argued, “Within the TX development zones, we have no concern about shrinkage” (M-3). Prefectural planners share the same understanding (P- 2, P-3). This is not surprising because, as we have seen, the TX- development zones are growing as a result of the inflows of young families. The increase in young families creates the bulk of urban- transport problems associated with growing cities rather than shrinking cities (P-1; P-3; M-1, M-2, M-5, MIR). One planner contended, “The ‘crisis’ right now is that the development of urban-transport infra-structure does not follow the pace of a rapidly increasing population in the TX development areas” (M-5). This ‘growth’ view seems to be shared by informal actors. The director of the board at TEP admitted, “The TX suburban region is new and growing. So, I have no sense of shrinkage” (TEP). The manager at MIR also emphasized, “The challenge we’re facing now is to increase the capacity of the TX line to serve an increasing ridership. So, shrinkage sounds like far from the reality” (MIR).
At the regional scale, however, our spatial analysis revealed that urban shrinkage is currently progressing in all the municipalities of the region. Under the influence of the national-scale public debate on urban shrinkage (Hattori et al., 2017) most planners recognize that regional scale and municipal scale shrinkage is an issue in their municipality or prefecture (M-3, M-4, M-5, P-3). Despite this recognition, their attitudes toward shrinkage seem to vary. Some planners argued that the time frame of shrinkage does not fit their mindset (M-2, M-5). A planner’s words epitomize this: Given the reality that many things are changing so rapidly nowadays, “to plan things for 30 or 40 years later is a fantasy (k¯usou) from my perspective … thus we do not make plans that contain a longer perspective” (M-5).
However, the planners in Tsukuba think differently. Despite the current growth of the TX development zones, “the entire city will start losing its population after 2036. So, we share strong anxiety about future depopulation” (M-1). This comment is distinctive because planners at
other municipalities also know that their city will start shrinking in the future. Two possible explanations can account for the divergence in their perceptions.
First, as our model suggests (cf. Hartt, 2018), the severity of the shrinkage condition affects the planners’ perception. Tsukuba has the largest administrative area, and a major part of its suburban periphery is already shrinking or will shrink soon. This context seems to create a deeper concern about shrinkage among the planners in Tsukuba. They also recognize that some parts of their municipality are becoming rapidly aging communities. A transport planner problematized the size of the municipality: “Tsukuba has large areas for residential develop-ment. So, there is a dilemma that we cannot provide public transport services elsewhere under the budgetary austerity” (M-1).
Second, the capacity of planning can also affect perception. The growth of the TX development zones is creating many planning tasks and challenges, and so a planner argued that “the issues related to these areas tend to be too much … so, for municipal planners, to deal with these issues can be a burden” (A*10). The planner at Tsukuba empha-sized that “because our city is in the class of ‘special cities,11’ we can afford to establish specialized teams for particular issues” (M-1). For small municipalities where this is not affordable, it is hard to address emerging shrinkage when their planning resources are fully occupied by more striking growth challenges.
5.3. Policy actions
5.3.1. Shrinkage-preemptive growth in the TX development zones All planners confirmed that they strategically position the TX development zones as the suburban centers in their urban planning master plan (M-1, M-2, M-3, M-4, M-5). The zones are considered “the Fig. 4. Estimated “already-severely” declining and aging populations (2015–2020).
10 [A*] Anonymized: Because of the nature of information given, it was desirable to anonymize the source of information.
11 In Japan, Tokurei shi is a class of city. This designation used to be assigned to cities with over 200,000 population with expanded authorities and organiza-tion resources. The category was abolished in 2015. Tsukuba remains in the special condition (Shikouji tokurei shi) and is considering upgrading its status to ‘core city’ (Ch¯ukaku shi).
core of our municipality” (M-1), “the TX development zone is the municipal center” (M-3), and “the gathering point of urban functional-ities” (M-4). Transport planners also strive to enhance the overall accessibility of municipal public transport services in connection with the TX development zones as ‘transport nodes’ (M-1, M-2, M-3, M-4). The planner at Kashiwa emphasized the importance of strengthening the transport connection between transit-suburban centers (Kashiwa-no-ha Campus station and Kashiwa station) to better stimulate economic ac-tivities within these centers (M-4).
Apparently, the optimization and networking plans framework drives these strategic attempts to develop centrality within the TX development zones, even though the implementation phase of these plans varies across municipalities (Table 2). This suggests that, despite the planners’ differing views of shrinkage, the growth planning for the TX development zones is more or less coevolving with the
Compact+Network initiative for urban shrinkage. Thus, even though the planners do not explicitly associate the development of TX transit- suburban centers with future peripheral shrinkage, in effect, the devel-opment is strategically positioned as the convergence point of “folding- up” (Aiba, 2015) or rightsizing (N´emeth & Hollander, 2016) of the urban fabric of each municipality in the future.
However, we should be careful about the municipalities’ motivation behind this “shrinkage-preemptive” growth planning. Some planners explained that their municipality strategically implements the optimi-zation and networking plans to build a more shrinkage-adapting city (A*). However, others doubt the effectiveness of such plan due to (1) their limited legal capacity to induce intramunicipal migration toward the suburban centers (A*), and (2) their strategic inconsistency with the demographic or geographical conditions of a particular municipality (A*). Several planners admitted that the major reason to implement the
Kashiwa
plans, despite their potential ineffectiveness, is to acquire the national grant linked with the optimization and networking plans.
We also observed locally specific shrinkage-preemptive policy ac-tions, which might be called preemptive retrofitting, in Nagareyama and Kashiwa. In Nagareyama, where the largest young family intake in the prefecture has been recorded (M-5), the planners deal with this “growth” problem using a shrinkage-preemptive approach: “We don’t plan to build an elementary school in the same way as before. The idea is to design the school so that it can be ‘converted’ to different functions (e.g., facilities for the elderly) when shrinkage and aging populations progress in the future” (M-5, parenthesis added by the authors). Also, by using the increasing social interactions within the TX development zones, Nagareyama seems to be preemptively diversifying the city’s function from a mere dormitory suburb of Tokyo to a sightseeing destination
within the Tokyo Megacity. This may help to regenerate the city’s eco-nomic base once population growth ceases. A planner explained:
There are some rows of historical houses in this area, so we consider them as local tourism resources and are making efforts in tourism projects targeting people living in Tokyo. The Nagareyama Otaka- no-mori zone has become the nexus of railway transportation, and people are coming to the zone. So, we plan to use the station as a hub for sightseeing activities (M-5).
In Kashiwa, in collaboration with researchers at the Urban Design Center of Kashiwa-no-ha (UDCK), the TX zone barrier-free basic concept was developed and used to design the fast-growing Kashiwa-no-ha campus zone in way that was more walkable and accessible for the Fig. 6. The spatio-temporal condition of the aging population by peak year and severity. For reference, the severely shrinking small areas identified in the previous analysis are mapped as blue-hatched areas.