Effect of stormwater controls on sediment transport in urban streams, The
13
0
0
Full text
(2) Rohrer, Roesner and Bledsoe. Urbonas (1980) described drainage way erosion in semi-arid urbanizing areas. This study evaluates the potential impact of watershed development on sediment transport in a prototype headwater stream subjected to typical residential development.. 2. Study Approach A six-step approach was employed for this study, primarily using programs contained in the USEPA Stormwater Management Model (SWMM) suite of tools. (1) Continuous precipitation data were processed by SWMM Rain for use in SWMM Runoff. (2) SWMM Runoff generated surface runoff based on local precipitation data (continuous and event-based), land use and topography. (3) SWMM Extran routed event based flows through the drainage system and stormwater basins, creating stage-discharge relationships for use in SWMM Transport. (4) SWMM Transport routed continuous and eventbased flows through the drainage system and stormwater basins. (5) The SWMM Statistics block generated flow frequency data from Transport. (6) SAS, a statistical analysis/programming package, was used to calculate sediment transport capacities. 2.1 Precipitation Data Fifty years of continuous precipitation data were used to simulate the impacts of development on flow frequency and to estimate the impact of development on sediment transport potential. Continuous precipitation data were obtained from the National Climatic Data Center (NCDC, 2003) for both Fort Collins and Atlanta. Hourly precipitation values from the Fort Collins, Colorado (NCDC COOP ID: 053005) and Atlanta Hartsfield International Airport (NCDC COOP ID: 090451) rain gauges were examined for a period of record ranging from January 1, 1951 to December 31, 2000. NetSTORM, a program used to process and analyze continuous precipitation data (Heineman, 2004), was used to calculate design storm depths based upon the 50-year records for Atlanta. Design storm hyetographs for the Atlanta analysis were generated by applying Denver Urban Drainage and Flood Control District (UDFCD. 2001) distribution criteria to the total 1-hour storm depths summarized in Table 1. Design storm hyetographs for Fort Collins were provided by the City of Fort Collins-Utilities (1999). Design storm rainfall depths calculated by NetSTORM for Fort Collins are shown in Table 1. Table 1. Design Storm Depths Storm Depth (cm) Location Continuous Atlanta, GA Fort Collins, CO. 2-Yr. 10-Yr. 9.50 4.93. 14.74 9.17. 100-Yr1 22.12 13.21. 1. 1-Hour 2-Yr. 10-Yr. 3.77 2.79. 5.30 5.46. 100-Yr1 7.75 6.48. Note that based upon the 50-year record, Rainmaster calculated an 83.7-year return interval rather than a 100-year return interval. The 83.7-year return interval is used in place of the 100-year event.. 208.
(3) Effect of stormwater control on sediment transport in urban streams. 2.2 Watershed Characteristics The same prototype watershed was used for both the Fort Collins and Atlanta analysis. This prototype, located south of Fort Collins, Colorado, is a subbasin within the Fossil Creek Watershed. Three drainage subwatersheds were manually delineated using two-foot contour maps. Land use in the watershed currently consists of 12.1 ha (30 acres) of low-density residential development in the form of estate lots and 9.9 ha (25 acres) of pastureland. Aerial digital photographs were used to estimate imperviousness for the lowdensity residential areas (13%). The impervious area of the undeveloped pastureland was assumed to be 5%. Potential development within the watershed was simulated by converting the pastureland to a medium-density residential subdivision. Representative lot sizes were modeled after typical existing residential subdivisions in the vicinity of the study watershed. Average lot sizes in the simulated subdivision were 0.15 ha (0.37 ac) including 27 m (87 ft) of frontage. The developed subwatershed was divided into seven subbasins, with an average imperviousness of 25 percent. The remaining watershed was left unchanged. Under “Undeveloped” conditions, runoff from each subwatershed travels overland to grassed swales. Under “Developed” conditions, runoff from each subbasin in the developing subwatershed travels overland to respective gutters and swales. Gutters and swales within the developing subbasins were sized to allow full conveyance of the 100-year storm. Runoff conveyance from the remaining watershed was left unchanged. 2.3 Flow Routing and Stormwater Controls Runoff hydrographs were generated by the SWMM Runoff model. Downstream flow routing and stormwater detention were modeled using version 44h of SWMM Extran and SWMM Transport. Stormwater detention ponds and outlets for the developing portion of the watershed were sized in SWMM Extran, using simulations of the 100- and 2-year design storms. Stage-discharge curves developed from SWMM Extran simulations were used as input data for SWMM Transport, which was run for the 50-year continuous simulations. Three levels of stormwater control within the developing portion of the watershed were examined in this study, and compared to “Undeveloped” and “Developed Uncontrolled” conditions. The first stormwater control examined, referred to as “Developed 2-Yr Pre”, was based upon detention storage requirements in the City of Fort Collins (1997) for areas where master drainage plans are not yet in place. The Fort Collins regulations require that stormwater runoff be released from developments at a rate not greater than the 2-year historic runoff. The amount of runoff to be detained on-site is the difference between the 100-year runoff under developed conditions and the 2-. 209.
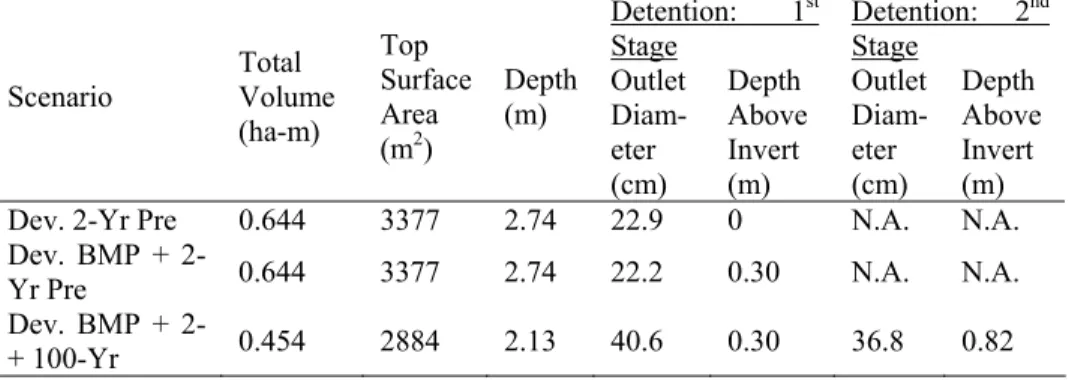
(4) Rohrer, Roesner and Bledsoe. year historic runoff. The second level of stormwater control examined includes the addition of water quality controls to the existing City of Fort Collins detention storage requirements. This is referred to as the “Developed BMP + 2-Yr Pre” scenario. The term BMP represents best management practice, which in this study is the control of the water quality capture volume (WQCV). The third level of stormwater control examined is referred to as the “Developed BMP + 2-Yr + 100-Yr” scenario. This scenario combines control of the WQCV with peak shaving practices for stormwater detention that are frequently observed across the United State, i.e., control of the 100-year post development runoff rate to the 100-year historic rate, and, control of the 2year post development runoff rate to the 2-year historic rate. The WQCV is computed as the product of the mean runoff event and a drawdown coefficient, resulting in the capture of 70-90% of all runoffproducing events in their entirety. The WQCV for Atlanta was calculated using procedures recommended by WEF and ASCE (1998) as a national standard. Using a drain time of 24-hours the resulting WQCV was calculated as: WQCV = a (c P6 ). (1). where, a = drawdown coefficient (1.299), P6 = mean storm precipitation over the watershed (18.0 mm) and c = runoff coefficient. The runoff coefficient was calculated using: c = 0.858i 3 − 0.78i 2 + 0.774i + 0.04. (2). where, i = watershed imperviousness ratio. The WQCV calculated for Atlanta is 0.046 ha-m (0.38 ac-ft.) The WQCV for Fort Collins was calculated using a slightly modified method described by UDFCD (1999). The calculated WQCV for Fort Collins is 0.041 ha-m (0.33 ac-ft.) Orifice outlets for both the Atlanta and Fort Collins water quality ponds were sized to 7.62 cm (3 inches) and are placed in a side headwall at the bottom of the water quality pond. A SWMM Extran model was used to size the detention ponds and outlets for the three stormwater control scenarios examined. To better replicate the predevelopment flow frequency curve, some of the flow control orifices were sized to allow discharge at historical flow rates obtained from the continuous simulation of the undeveloped watershed. Trial and error was used to design appropriate detention volumes as well as orifice outlet sizes and depths. It should be noted that because the total runoff volume of the 2-year design storm was nearly equal in volume to the WQCV in Fort Collins, discharge for the Fort Collins 2-year design storm was less than the historic 2-year discharge. Rather than designing an additional outlet for the 2-year storm, the 2-year storm was allowed to discharge from the WQCV orifice. Characteristics of the detention and/or water quality ponds for each scenario are summarized in Tables 2a and 2b for Atlanta and Fort Collins, respectively.. 210.
(5) Effect of stormwater control on sediment transport in urban streams. Table 2a. Characteristics for Detention and Water Quality Ponds in Atlanta Scenario. Total Volume (ha-m). Dev. 2-Yr Pre 0.644 Dev. BMP + 20.644 Yr Pre Dev. BMP + 20.454 + 100-Yr N.A. = Not Applicable.. Top Surface Area (m2). Depth (m). 3377. 2.74. Detention: 1st Stage Outlet Depth Diam- Above eter Invert (cm) (m) 22.9 0. Detention: 2nd Stage Outlet Depth Diam- Above eter Invert (cm) (m) N.A. N.A.. 3377. 2.74. 22.2. 0.30. N.A.. N.A.. 2884. 2.13. 40.6. 0.30. 36.8. 0.82. Table 2b. Characteristics for Detention and Water Quality Ponds in Fort Collins Scenario. Total Volume (ha-m). Top Surface Area (m2). Dev. 2-Yr Pre Dev. BMP + 2-Yr Pre Dev. BMP + 2-+ 100-Yr. 0.679 0.679 0.407. 3363 3363 2635. Depth (m) 3.05 3.05 2.13. Detention: 1st Stage Depth Outlet Above Diameter Invert (cm) (m) 14.0 0 12.1 0.30 54.6 0.43. Detention pond stage-discharge data generated by SWMM Extran were used to establish relationship equations. These equations were used as input for SWMM Transport, which is not able to calculate detention pond discharge using orifice equations. Simulations in SWMM Transport were then run using the 50-year surface runoff time series generated by SWMM Runoff. 2.4 Flow Frequency Analysis SWMM Statistics was used to examine the frequency of peak flows generated by individual events during the 50-year records. Frequency exceedance curves were developed from the partial duration series of peak flows generated by SWMM Transport. This approach, which is in contrast to the examination of the annual maximum series, was used because it allowed for the analysis of high frequency, low runoff producing storms. A six-hour inter-event time was specified to separate the flow data into individual events. The Cunnane (1978) formula was used to calculate the frequency of an event peak flow, T, as: T=. N +1− 2A M−A. (3). where, T = return interval (years), N = number of years of record, M = rank of the event (in descending order of magnitude), and A = plotting position parameter (0.4).. 211.
(6) Rohrer, Roesner and Bledsoe. The return interval was converted to exceedances per year, E, using: E=. 1 . T. (4). 2.5 Sediment Transport Analysis Sediment transport capacity was evaluated using routines developed in SAS. Simultaneous stage and discharge pairs output from the 50-year continuous simulations in SWMM Transport were used to calculate sediment transport rates using a bedload and a total load equation. Two noncohesive bed materials were evaluated for sediment transport capacities under the “Undeveloped” and the four proposed development scenarios. Bedload was evaluated for a bed material of medium gravel (diameter 8 mm) and total load was evaluated for a bed material of medium sand (diameter 0.25 mm). Bedload (qbv) was calculated as a function of grain size and the difference between the calculated Shield’s parameter, τ * , and the critical Shield’s parameter, τ *c , as described in this simplified form of the Meyer-Peter and Müller (MPM) equation (Julien, 1998):. qbv = 8(τ* − τ*c ) 2 3. (G − 1)gd s3. (5). where, ds = particle size, G = specific gravity, and g = gravitational acceleration. The Shield’s Parameter was calculated using:. τ* =. τ (γ s − γ ) d s. (6). where, γs = specific weight of the sediment particle, γ = specific weight of the fluid mixture (assumed to be same as water), and τ = boundary shear stress. Boundary shear stress was calculated as:. τ = γ Rh S f. (7). where, Rh = hydraulic radius of channel, and Sf = friction slope of channel. Total load, Cppm, was calculated using Brownlie’s method, presented by Julien (1998).. C ppm. ⎛ = 7115 cb ⎜ ⎜ ⎝. V − Vc (G − 1)g d s. 1.978. ⎞ ⎟ ⎟ ⎠. S. 0.6601 f. ⎛ Rh ⎞ ⎜⎜ ⎟⎟ ⎝ ds ⎠. −0.3301. (8). where, cb = Brownlie coefficient, assumed 1.0 for this analysis, V = mean flow velocity, and Vc = critical velocity. Critical velocity was calculated as: Vc =. (G − 1)gd s * 4.596τ *0c.529 S −f 0.1405σ g−0.1606. where, σg = gradation coefficient, assumed to be 1.0 for this analysis. 212. (9).
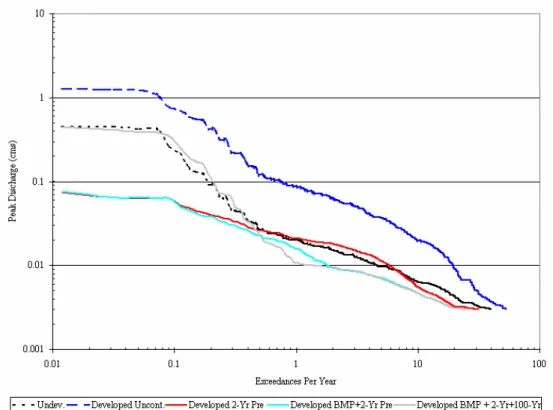
(7) Effect of stormwater control on sediment transport in urban streams. 3 Results and Discussion Figures 1 and 2 show the peak flow frequency curves resulting from continuous simulation of the pre- and post-development conditions examined for Atlanta and Fort Collins, respectively. The peak flows represent discharge from the developing portion of the watershed only. As expected, Figures 1 and 2 show that when the watershed is developed without stormwater controls, the peak discharges for storms of all return intervals are greater than peak discharges in undeveloped conditions. Differences between peak discharges under the “Developed Uncontrolled” and developed with stormwater controls scenarios are evident in both figures.. Figure 1. Stormwater peak flow exceedance frequency: Atlanta, developing watershed.. The “Developed 2-Yr Pre” and “Developed BMP + 2-Yr Pre” scenarios show that peak discharges for the 83.7 year storms (0.011 exceedances per year) do not exceed the 2-year peak discharge (0.5 exceedances per year) value for the “Undeveloped” condition. When the “Developed Uncontrolled” 83.7-year peak discharge is controlled to the “Undeveloped” 2-year level, peak discharges for all storms greater than the 2-year storm are significantly lower than “Undeveloped” conditions, as shown in Figures 1 and 2. Peak discharges from the “Developed 2-Yr Pre” scenarios are greater than “Undeveloped” peak discharges that are exceeded between 1.3 – 11.5 times a year for Atlanta and 0.5 – 6.2 times a year for Fort Collins. This means that peak discharges are uncontrolled for storms with return intervals between 0.8 – 0.1 years for Atlanta and 2.0 – 0.2 years for Fort Collins. “Developed 2-Yr. 213.
(8) Rohrer, Roesner and Bledsoe. Pre” peak discharges that occur more than 11.5 times a year for Atlanta and more than 6.2 times a year in Fort Collins are smaller than those that occur in “Undeveloped” conditions.. Figure 2. Stormwater peak flow exceedance frequency: Fort Collins, developing watershed.. Peak discharges from the “Developed BMP + 2-Yr + 100-Yr” scenarios track fairly close to the “Undeveloped” peak discharges from the 83.7-year to the 2-year return intervals for both Atlanta and Fort Collins. For Atlanta, peak discharges from the “Developed BMP + 2-Yr + 100-Yr” and “Developed BMP + 2-Yr Pre” scenarios become nearly the same for all storms that occur more than 5 times a year, indicating that the BMP is effective for storms with a return interval of 0.2 years. Peak discharges from storms that occur more than 5 times a year in the BMP scenarios are less than the peak discharges in the “Undeveloped” scenario. For Fort Collins, peak discharges from the “Developed BMP + 2-Yr + 100Yr” and “Developed BMP + 2-Yr Pre” scenarios become nearly the same for all storms that occur more than 2 times a year. Peak discharges that occur more than 0.3 times a year in the “Developed BMP + 2-Yr + 100-Yr” scenario are less than the peak discharges in the “Undeveloped” scenario. From Figure 2 it can be seen that the Fort Collins “Developed BMP + 2-Yr + 100-Yr” peak discharge at the 2-year return interval is less than the peak discharge at the “Undeveloped” condition. The “Undeveloped” 2-year peak discharge could not be reached for because the WQCV was nearly equal to the volume of water generated by the 2-year storm.. 214.
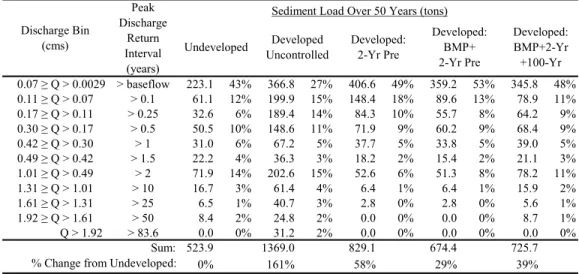
(9) Effect of stormwater control on sediment transport in urban streams. Tables 3 through 6 summarize the mass of sediment transported over the 50-year continuous simulations for all scenarios examined. Results are tabulated in discharge bins that represent peak discharge return intervals from the “Undeveloped” scenario. The results of the sediment transport analysis are for stream channel conditions downstream of the entire watershed including discharge from the developing and developed subwatersheds. These results evaluate which scenarios mostly closely mimic sediment transport potential in the “Undeveloped” scenario and thus do not take into account geomorphic changes that would potentially occur within the stream channel over the 50year period. For this exercise, only sediment load transported by flows greater than baseflow are reported. Baseflow is represented by discharges less than 0.0029 cms. The percent of change in total sediment load between “Undeveloped” conditions and each level of post development stormwater control is presented for each scenario. This method is similar to the erosion potential indices suggested by MacRae (1993) and Bledsoe (2002), although it uses the mass of sediment transported rather than sediment transport capacities and compares these values as a percent change rather than an index value. Tables 3 and 4 summarize sediment transport potential for medium sand. Results in these tables demonstrate that the “Developed BMP + 2-Yr Pre” scenarios yield a total sediment load that is closest to the “Undeveloped” conditions. However, the “Developed BMP + 2-Yr Pre” scenarios still create a 29% increase in sediment transport in Atlanta and an 11% increase in Fort Collins. Traditional geomorphic estimates (Leopold et al., 1964) indicate that storms at a 1.5 – 2-year recurrence interval are responsible for the form of an active channel. In Atlanta, at least 88% of all sediment load in each scenario is transported by storms with an “Undeveloped” peak discharge return interval of 2 years. From Table 3, it can be seen that storms with an “Undeveloped” peak discharge return interval of less than 0.25 years account for 55% or more of the sand transported over the 50-year continuous simulation in all Atlanta scenarios. This indicates that the high duration of low discharge values account for more than half of all sediment transported. This indicates that in a southeastern climate, smaller discharges may contribute more to erosion in sandbed streams than the traditional 1.5 – 2-year storm. Results for Fort Collins in Table 4 show a different trend because peak discharges are smaller than those for Atlanta, but the size of the material being transported remains the same. Storms with longer return intervals for “Undeveloped” conditions contribute significantly to the 50 year sediment load, with “Undeveloped” peak discharge return intervals less than or equal to Table 3. Transport of Medium Sand: Atlanta.. 215.
(10) Rohrer, Roesner and Bledsoe. Peak Sediment Load Over 50 Years (tons) Discharge Discharge Bin Developed: Return Developed Developed: (cms) Undeveloped BMP+ Interval Uncontrolled 2-Yr Pre 2-Yr Pre (years) 0.07 ≥ Q > 0.0029 > baseflow 223.1 43% 366.8 27% 406.6 49% 359.2 53% 0.11 ≥ Q > 0.07 > 0.1 61.1 12% 199.9 15% 148.4 18% 89.6 13% 0.17 ≥ Q > 0.11 > 0.25 32.6 6% 189.4 14% 84.3 10% 55.7 8% 0.30 ≥ Q > 0.17 > 0.5 50.5 10% 148.6 11% 71.9 9% 60.2 9% 0.42 ≥ Q > 0.30 >1 31.0 6% 67.2 5% 37.7 5% 33.8 5% 0.49 ≥ Q > 0.42 > 1.5 22.2 4% 36.3 3% 18.2 2% 15.4 2% 1.01 ≥ Q > 0.49 >2 71.9 14% 202.6 15% 52.6 6% 51.3 8% 1.31 ≥ Q > 1.01 > 10 16.7 3% 61.4 4% 6.4 1% 6.4 1% 1.61 ≥ Q > 1.31 > 25 6.5 1% 40.7 3% 2.8 0% 2.8 0% 1.92 ≥ Q > 1.61 > 50 8.4 2% 24.8 2% 0.0 0% 0.0 0% Q > 1.92 > 83.6 0.0 0% 31.2 2% 0.0 0% 0.0 0% Sum: 523.9 1369.0 829.1 674.4 % Change from Undeveloped: 0% 161% 58% 29%. Developed: BMP+2-Yr +100-Yr 345.8 78.9 64.2 68.4 39.0 21.1 78.2 15.9 5.6 8.7 0.0 725.7 39%. 48% 11% 9% 9% 5% 3% 11% 2% 1% 1% 0%. Table 4. Transport of Medium Sand: Fort Collins. Peak Discharge Discharge Bin Return (cms) Undeveloped Interval (years) 0.01 ≥ Q > 0.0029 > baseflow 7.1 7% 0.03 ≥ Q > 0.01 > 0.1 19.2 18% 0.05 ≥ Q > 0.03 > 0.25 8.8 8% 0.06 ≥ Q > 0.03 > 0.5 2.6 3% 0.06 ≥ Q > 0.08 >1 3.5 3% 0.09 ≥ Q > 0.08 > 1.5 1.1 1% 0.64 ≥ Q > 0.09 >2 27.2 26% 1.17 ≥ Q > 0.64 > 10 30.3 29% 1.20 ≥ Q > 1.17 > 25 2.2 2% 1.26 ≥ Q > 1.20 > 50 2.5 2% Q > 1.26 > 83.6 0.0 0% Sum: 104.7 % Change from Undeveloped: 0%. Sediment Load Over 50 Years (tons) Developed Uncontrolled. Developed: 2-Yr Pre. Developed: BMP+ 2-Yr Pre. Developed: BMP+2-Yr +100-Yr. 8.3 34.1 27.2 12.1 14.8 4.7 58.3 38.1 0.0 0.0 50.1 247.7 136%. 15.4 36.2 22.0 7.1 6.8 1.7 25.1 15.5 0.0 0.0 0.0 130.0 24%. 21.2 28.9 14.7 5.7 5.1 1.3 23.9 15.5 0.0 0.0 0.0 116.4 11%. 21.6 27.2 10.2 3.5 3.5 1.2 35.7 38.7 2.2 0.0 0.0 143.8 37%. 3% 14% 11% 5% 6% 2% 24% 15% 0% 0% 20%. 12% 28% 17% 5% 5% 1% 19% 12% 0% 0% 0%. 18% 25% 13% 5% 4% 1% 21% 13% 0% 0% 0%. 15% 19% 7% 2% 2% 1% 25% 27% 2% 0% 0%. the 10-year storm contributing 95% of the 50 year sediment load in “Undeveloped” conditions. This indicates that the traditional 1.5 – 2-year “channel forming” estimate may be low for sandbed channels in a semiarid climate with convective storms. Tables 5 and 6 summarize sediment transport potential for medium gravel. Comparison of “Undeveloped” 50 year sediment loads to the “Developed 2Yr Pre” and “Developed BMP + 2-Yr Pre” 50 year sediment loads shows that when the 100-year storm is controlled to the 2-year predevelopment level sediment transport potential is decreased in gravelbed channels. This over control may lead to streambed aggradation. The “Developed BMP + 2-Yr + 100-Yr” scenario causes a 16% increase in sediment transport potential for Atlanta and a 22% increase in sediment transport potential for Fort Collins. For Atlanta, the 5% decrease in cumulative sediment load in the “Developed 2-Yr Pre” scenario most closely matches the cumulative sediment load in the “Undeveloped” scenario. For Fort Collins, the cumulative sediment load in the “Developed BMP + 2-Yr + 100-Yr” scenario most closely matches the. 216.
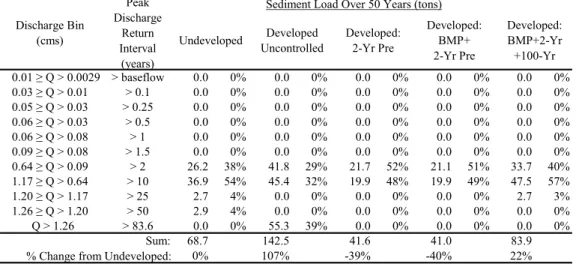
(11) Effect of stormwater control on sediment transport in urban streams. cumulative sediment load in the “Undeveloped” scenario, with a 22% increase in sediment transport. Table 5 shows that a 0.1-year “Undeveloped” peak discharge return interval is required to initiate sediment transport in a gravelbed channel in Atlanta. The largest percentage of sediment is transported in the 2-year “Undeveloped” peak discharge return interval bin across all scenarios examined. Seventy-eight to 87% of all sediment is transported in the 0.5- to 2year “Undeveloped” peak discharge return intervals. Table 5. Transport of Medium Gravel: Atlanta. Peak Discharge Discharge Bin Return Undeveloped (cms) Interval (years) 0.07 ≥ Q > 0.0029 > baseflow 0.0 0% 0.11 ≥ Q > 0.07 > 0.1 0.2 0% 0.17 ≥ Q > 0.11 > 0.25 9.8 4% 0.30 ≥ Q > 0.17 > 0.5 46.3 19% 0.42 ≥ Q > 0.30 >1 36.4 15% 0.49 ≥ Q > 0.42 > 1.5 27.9 11% 1.01 ≥ Q > 0.49 >2 90.3 37% 1.31 ≥ Q > 1.01 > 10 20.2 8% 1.61 ≥ Q > 1.31 > 25 6.9 3% 1.92 ≥ Q > 1.61 > 50 9.2 4% Q > 1.92 > 83.6 0.0 0% Sum: 247.3 0% % Change from Undeveloped:. Sediment Load Over 50 Years (tons) Developed Uncontrolled. Developed: 2-Yr Pre. Developed: BMP+ 2-Yr Pre. Developed: BMP+2-Yr +100-Yr. 0.0 0.9 60.9 125.4 80.0 44.4 254.1 71.1 47.0 26.1 30.8 740.9 200%. 0.0 0.4 22.4 65.2 45.3 22.6 66.9 7.6 3.2 0.0 0.0 233.7 -5%. 0.0 0.2 15.8 54.7 40.3 19.3 65.3 7.6 3.2 0.0 0.0 206.4 -17%. 0.0 0.2 19.2 62.4 46.3 26.4 98.8 18.4 6.9 9.0 0.0 287.7 16%. 0% 0% 8% 17% 11% 6% 34% 10% 6% 4% 4%. 0% 0% 10% 28% 19% 10% 29% 3% 1% 0% 0%. 0% 0% 8% 26% 20% 9% 32% 4% 2% 0% 0%. 0% 0% 7% 22% 16% 9% 34% 6% 2% 3% 0%. Table 6. Transport of Medium Gravel: Fort Collins. Peak Discharge Return Undeveloped Interval (years) 0.01 ≥ Q > 0.0029 > baseflow 0.0 0% 0.03 ≥ Q > 0.01 > 0.1 0.0 0% 0.05 ≥ Q > 0.03 > 0.25 0.0 0% 0.06 ≥ Q > 0.03 > 0.5 0.0 0% 0.06 ≥ Q > 0.08 >1 0.0 0% 0.09 ≥ Q > 0.08 > 1.5 0.0 0% 0.64 ≥ Q > 0.09 >2 26.2 38% 1.17 ≥ Q > 0.64 > 10 36.9 54% 1.20 ≥ Q > 1.17 > 25 2.7 4% 1.26 ≥ Q > 1.20 > 50 2.9 4% Q > 1.26 > 83.6 0.0 0% Sum: 68.7 0% % Change from Undeveloped: Discharge Bin (cms). Sediment Load Over 50 Years (tons) Developed Uncontrolled. Developed: 2-Yr Pre. Developed: BMP+ 2-Yr Pre. Developed: BMP+2-Yr +100-Yr. 0.0 0.0 0.0 0.0 0.0 0.0 41.8 45.4 0.0 0.0 55.3 142.5 107%. 0.0 0.0 0.0 0.0 0.0 0.0 21.7 19.9 0.0 0.0 0.0 41.6 -39%. 0.0 0.0 0.0 0.0 0.0 0.0 21.1 19.9 0.0 0.0 0.0 41.0 -40%. 0.0 0.0 0.0 0.0 0.0 0.0 33.7 47.5 2.7 0.0 0.0 83.9 22%. 0% 0% 0% 0% 0% 0% 29% 32% 0% 0% 39%. 0% 0% 0% 0% 0% 0% 52% 48% 0% 0% 0%. 0% 0% 0% 0% 0% 0% 51% 49% 0% 0% 0%. 0% 0% 0% 0% 0% 0% 40% 57% 3% 0% 0%. Table 6 shows that sediment transport is not initiated in a gravelbed channel for Fort Collins storms smaller than those with a peak discharge return interval of 2 years for “Undeveloped” conditions. 92% of the sediment transport occurs with storms between the 2-year and 10-year return interval in “Undeveloped” conditions. 100% of the sediment transport occurs between the 2- and 10-year “Undeveloped” peak discharge return intervals for the “Developed 2-Yr Pre” and “Developed BMP + 2-Yr Pre” scenarios and 217.
(12) Rohrer, Roesner and Bledsoe. between the 2- and 25-years for the “Developed BMP + 2-Yr + 100-Yr” scenario.. 4 Conclusions The results presented in this paper indicate that there is not a “one size fits all” solution to stormwater control as it pertains to sediment transport for the control of instream channel erosion. Precipitation patterns and bed material both play a large role in what type of control is most appropriate. It is clear that further study needs to take place to expand the research summarized in this paper. This study evaluated the effects of stormwater controls for two climate types in one watershed. Sediment transport effects for one stream with two potential bed materials were examined. The effects of stormwater controls should be evaluated for watersheds with different hydrologic characteristics including varied size, shape, slope, infiltration parameters and additional climate areas such as those with frequent, low-intensity storms like those found in the Pacific Northwest. Additionally, receiving streams with different levels of entrenchment and bed materials need to be evaluated. Methods to simulate the transport of noncohesive bed materials such as clays should be developed and evaluated.. References Bledsoe, B.P. 2002. Stream Erosion Potential and Stormwater Management Strategies. Journal of Water Resources Planning and Management. 128(6):451-455. City of Fort Collins – Water Utilities. 1997. Memorandum: Update to the Stormwater Drainage Design Criteria and Construction Standards. Memorandum to all manual owners. April 29, 1997. City of Fort Collins – Utilities. 1999. Memorandum: New Rainfall Criteria. Memorandum to Storm Drainage Design Criteria Users. April 12, 1999. Cunnane, C. 1978. Unbiased Plotting Positions – A Review. Journal of Hydrology. 37: 205222. Graf, William L. 1975. The Impact of Suburbanization on Fluvial Geomorphology. Water Resources Research. 11:690-692. Hammer, T. R. 1972. Stream Channel Enlargement Due to Urbanization. Water Resources Research. 8:1530-1540. Heineman, M. 2001. NetSTORM. Version 2004.2. Developed for Camp Dresser & McKee Inc., Cambridge, Massachusetts. Julien, P.Y. 1998. Erosion and Sedimentation. Cambridge University Press. New York, New York. Leopold, L.B, Wolman, M.G. and Miller, J.P. 1964. Fluvial Processes in Geomorphology. W.H. Freeman and Co. San Francisco, CA. MacRae, C.R. 1993. An alternative design approach for the control of stream erosion potential in urbanizing watershed. 6th International Conference on Urban Storm Drainage. Niagara Falls, Ontario. Neller, R. J. 1988. A Comparison of Channel Erosion in Small Urban and Rural Catchments, Armidale, New South Wales. Earth Surfaces Processes and Landforms. 13:1-7 Neller, R. J. 1989. Induced Channel Enlargement in Small Urban Catchments, Armidale, New South Wales. Environ. Geol Water Sci. 14:167-171. National Climatic Data Center (NCDC). 2003. Hourly precipitation data for Atlanta, GA and Fort Collins, CO. http://www.ncdc.noaa.gov/oa/ncdc.html (9/8/2003). Urban Drainage and Flood Control District. (UDFCD) 1999. Urban Storm Drainage Criteria Manual - Volume 3. Denver, Colorado.. 218.
(13) Effect of stormwater control on sediment transport in urban streams. Urban Drainage and Flood Control District. (UDFCD) 2001. Urban Storm Drainage Criteria Manual - Volume 1. Denver, Colorado. Urbonas, B. 1980. Drainageway Erosion in Semi-Arid Urbanizing Areas. Flood Hazard News. 10:1:1-2. Water Environment Federation (WEF) and the American Society of Civil Engineers (ASCE). 1998. Urban Runoff Quality Management. WEF Manual of Practice No. 23 and ASCE Manual and Report on Engineering Practice No. 87. WEF/ASCE, Alexandria, VA. Wolman, M.G. 1967. A Cycle of Sedimentation and Erosion in Urban River Channels. Geografiska Annaler. 49A:385-394.. 219.
(14)
Figure

+2
Related documents
By combining (a) In vitro experimental data on T cell proliferation (b) 6-parameter model of T cell proliferation In vitro, (c) In vitro experimental data on IFNγ production
The results suggest that countries with very poor financial markets, such as the African countries, should experience a larger positive effect on current account as a result
In: Anders Brändström and Lars-Göran Tedebrand (ed.), Society, Health and Population during the Demographic Transition (pp. Stockholm: Almqvist and
Overall the objectives of this research are multifold: a investigate how specific factors, either related to job characteristics, the working environment or the crisis-results, help
The resulting error after time stepping the constant solution (5.1–5.1) using the standard Yee method on a N 3 grid.. Given in the column p is the
The two main research questions (RQ1 and RQ2) aim at highlighting the conditions for resource-efficient production of biofuels for transport from two different perspectives:
Linköping Studies in Science and Technology, Licentiate Thesis No 1662 Linköpings universitet 581 83 Linköping www.liu.se Ca roli na E rss on Co nd itio ns f or r eso urc
After adjusting for sex, age, smoking habits, and food qual- ity, the associations between economic situation, educational level, or PA and the outcome variable SRH remained
