Evaluation of sedimentation and erosion trends in the Sacramento River
near the M&T/Llano Seco Pump Station
James L. Woidt1, Amanda L. Cox and Christopher I. Thornton Department of Civil and Environmental Engineering, Colorado State University
Abstract. Since the movement of the M&T/Llano Seco Pump Station and Fish Screening Facility
from its previous location to a position downstream on the Sacramento River, changes in channel morphology have been studied by TetraTech, Inc., and their research showed lateral migration of the west bank and formation of a large gravel bar that is migrating downstream and impairing pump function. Colorado State University Hydraulics Laboratory was contracted to construct a 1:100 Froude-scale physical model to evaluate hydraulic conditions and long-term sedimentation patterns near the current pump intake location and two alternative relocation sites across a variety of discharges and river configurations. Mobile-bed sediment in the model was scaled based on an analysis of Shields parameter ratios, Rouse number ratios, and critical velocity ratios. Three channel configurations were modeled: existing channel conditions, current conditions with the inclusion of a gravel dredge material stockpile on the west bank, and realignment of a section of the east bank. Model results showed continued aggradation near the current M&T Pump intake if current conditions were not changed. Testing of the modeled gravel stockpile yielded negligible changes in hydraulic and sedimentation patterns. Straightening of the east bank of the river resulted in minor degradation near the current intake and aggradation in the vicinity of the upstream proposed pump alternative and the City of Chico Wastewater Outfall. Across all tests and discharges, the downstream proposed pump alternative remained the most stable, with negligible sedimentation and change in hydraulic conditions.
1. Introduction
In 1997, the M&T/Llano Seco Pumping (M&T) and Fish Screening Facility was moved from its previous location on Big Chico Creek to a site further downstream on the east bank of the Sacramento River. TetraTech, Inc. (TTI), has concluded that since this time, changes in channel morphology have resulted in lateral migration of the west bank and the formation of a large gravel bar that is actively migrating downstream from its present location directly upstream of the M&T pump intake. The combined morphological changes have resulted in sedimentation in the locale of the pump intake, placing facility operation in jeopardy and triggering substantial maintenance costs in the form of channel dredging (Cox et al, 2008). Mussetter Engineering, Inc., now TTI, concluded that
conditions favoring deposition will intensify due to west bank migration and continue to threaten pump function (MEI, 2006).
Prior physical model testing in 2007 investigated various maintenance and structural solutions, but none of these options were deemed feasible. To assist in identifying a solution to the problem of sedimentation at the current pump intake, the Colorado State University (CSU) Hydraulics Laboratory was contracted under TTI to design and construct a mobile-bed physical model to investigate hydraulic, morphologic, and sedimentation
1 Hydraulics Laboratory, Colorado State University 1320 Campus Delivery
Fort Collins, CO 80523 Tel: (970) 491-8260
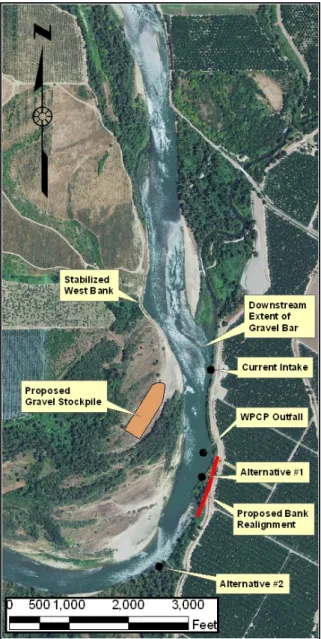
conditions at the current pump intake and two proposed pump relocation sites, located approximately 2,200 feet and 3,500 feet downstream of the current pump intake. A locus map of the study reach is shown in Figure 1.
The physical model included a rigid west bank as the previously migrating west bank has been stabilized in the prototype by revetment. The main objective of the physical model study was to investigate the changes in hydraulic, morphologic, and sedimentation conditions associated with the current condition and two potential channel alterations: the construction of a gravel stockpile on the west floodplain and straightening of the east bank approximately 2,500 feet below the current pump intake.
2. Physical Model Development
A non-tilted 1:100 Froude-scale model, spanning approximately 10,300 prototype feet of the Sacramento River, was
constructed at the CSU Hydraulics
Laboratory. To model sediment transport conditions, two types of sediment were used. A cohesive loam soil was used to model cohesive banks along the
downstream portion of the east bank of the Sacramento River to allow the attainment of steeper bank slopes observed in the prototype. The cohesive sediment was chosen as the most appropriate available material to simulate cohesive erodible material and was not scaled. However, the mobile gravel bed and floodplain material observed in the prototype was scaled and subsequently modeled with non-cohesive sand to simulate the channel sediment transport characteristics.
To achieve sediment transport similitude, non-cohesive sediment was scaled according to an analysis of the Rouse number, critical velocity ratio, and Shields Parameter-to-critical Shields Parameter ratio. Rouse number similitude ensured sediment transport primarily as bedload, and the other two parameters were used to model bedload transport of the prototype gravel (Julien, 2002). Based on the similitude analyses, a very fine silica sand with a d50 = 0.150 mm was used to
model the 40 mm gravel bed material observed in the prototype. The model-to-prototype ratios of Rouse Number, critical
velocity ratio, and Shields Parameter ratio were 3.927, 0.721, and 0.756, respectively. The sediment time scale ratio, derived from the Exner equation (Paola, 2005), was determined to be 22.9, e.g. one hour of model testing would represent 22.9 prototype hours.
Topographic data, provided to CSU by TTI in HEC-RAS, Microsoft Excel, and Digital Terrain Model formats, was used to construct the physical model topography. A series of 30 cross sections, spanning the prototype East-West direction, were constructed of
plywood to achieve proper model elevations and coordinates. The model X-coordinates were set by longitudinal stationing along both sides of the flume, with the flume walls serving as the left and right cross-section extents, thus establishing Y-coordinate control. A total station was used to survey the cross sections to ensure accurate model elevation and Z-coordinates. All cross sections were backfilled, stabilized, and capped with a broom-roughened 2-inch concrete layer that was set below final model bed-elevation to allow for placement of the mobile-bed material. In cases where no mobile material was to be placed, the concrete cap was set to the proper model bed-elevation and served as a rigid boundary.
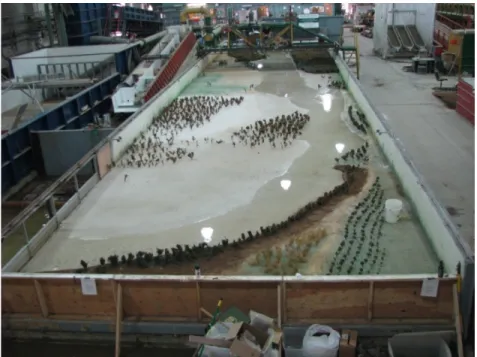
Mobile material was placed to final bed-elevations by establishing a network of surveyed nail heads interconnected with nylon string, reminiscent of TIN lines. A Light Detection and Ranging (LiDAR) surveying instrument was used to measure the finished surface to an accuracy of ± 0.001 ft. Subsequently, LiDAR results were used to adjust the bed as necessary to obtain accurate model topography before testing. The adjustment process was repeated in between each round of testing, e.g. between stockpile and realigned channel testing. After confirmation of accurate model construction, vegetation was placed in the model consistent with prototype conditions. An adjustable downstream gate was used as a downstream control to establish appropriate water surface levels. Figure 2 provides a photograph of the finished physical model.
Figure 2. Constructed model during testing of baseline conditions
The aforementioned gravel stockpile was constructed after conclusion of existing conditions testing. As the prototype gravel stockpile was to be constructed of dredge spoil
material, the fine silica sand used for the mobile bed was used to construct the gravel stockpile. Gravel stockpile extents and elevations were determined from areal extents of the gravel stockpile and stockpile dimensions provided by TTI.
Realignment of the east bank, based on cross sections supplied by TTI, followed the gravel stockpile configuration testing. In total, 5 cross sections were altered to
accommodate changes in channel realignment. Primarily, the cross sections straightened the east bank and deepened the channel along the realigned bank.
3. Hydraulic Modeling Procedures
Three prototype discharges, 10,000-, 90,000-, and 145,000-cfs, were modeled to represent a low flow condition, bank full discharge, and a 10-year recurrence flow,
respectively. The 10,000-, 90,000-, and 145,000-cfs tests were run on average for 8 hours, 145 hours, and 8 hours, respectively, to evaluate hydraulic and sediment transport
conditions.
Volumetric discharge was scaled using Froude scaling criteria and measured using a Venturi meter for low-discharge measurement and a full-bore magnetic flow meter for high-discharge measurement. Water surface elevations for each discharge were supplied by TTI for a given model coordinate. Downstream gates were adjusted to maintain the proper water surface elevation for each discharge.
The baseline condition, which represented the existing conditions, was tested at the 10,000-, 90,000-, and 145,000-cfs discharges. Following baseline testing, the gravel stockpile was constructed and tested at 145,000 cfs only, as the stockpile was inundated only at this flow due its location on the floodplain. Subsequently, the gravel stockpile was removed and the east bank realigned. The realigned bank was tested at the 10,000-, 90,000-, and 145,000-cfs discharges. Several tests of 145,000-cfs were conducted to quantify time scales of channel readjustment to the straightened east bank.
4. Data Collection and Analysis Procedures
Collected data included flow-velocity, and bed and water surface elevation
measurements. Bed-elevation data were collected prior to each test using both the LiDAR scanner and a Vernier point gage. During testing, a Marsh-McBirney velocimeter was used to collect two-dimensional point measurements of flow-velocity at over 200 locations when sufficient flow depth was present. The point gage was also used during testing to record water surface levels throughout the model. After testing, the model was drained and the LiDAR unit was used to collect high-density bed-elevation data (approximately 4 million data points) for the entire model bed.
At the conclusion of testing, all data were input into computer software programs to convert model measurements to representative prototype values, utilizing Froude scaling criteria. Flow-velocity data were analyzed using Environmental Systems Research Institute ArcGIS software. The individual point flow-velocity measurements were analyzed and interpolated using a spline interpolation method to provide continuous data coverage of the study reach. ArcGIS provided visual displays of the results of this
interpolation allowing flow-velocity trends and areas of localized flow-velocity change to be easily identified.
Bed-elevation data were analyzed using Cyclone, a LiDAR software, MS Excel, and Matlab to scale the bed-elevation data to prototype values. Due to the high point density,
bed-elevation measurements were interpolated by an inverse-distance weighting method to provide continuous bed-elevation data coverage over the study reach. ArcGIS displayed the bed-elevation data in a raster format that allowed for raster arithmetic. Raster
arithmetic was used to subtract post-test bed-elevation rasters from pre-test bed-elevation rasters thereby calculating the changes in the bed-elevation across the test duration and quantifying the sedimentation and erosion trends in the model.
5. Results
Before deduction of sedimentation trends, measurements collected during the 10,000- and 90,000-cfs flows were analyzed to ensure proper model construction and function. Results of the 10,000- and 90,000-cfs tests were compared to prior test results conducted in 2007, and correlated well with measurements from the previous model study.
Additionally, flow-velocity and sedimentation trends observed during the initial tests correlated well with observed prototype conditions.
5.1 Baseline Conditions
Baseline testing results indicated aggradation at the current pump intake location during the 90,000- and 145,000-cfs flows, reflecting known prototype conditions.
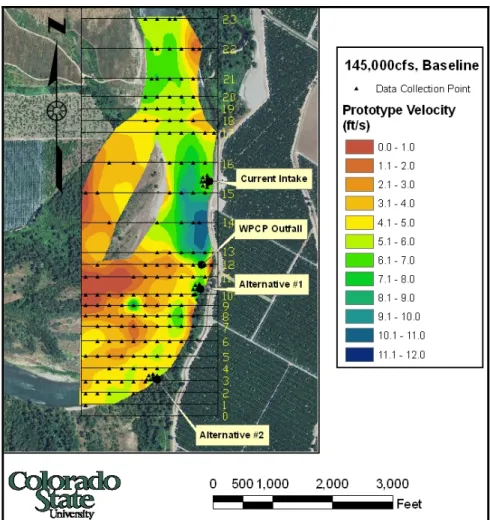
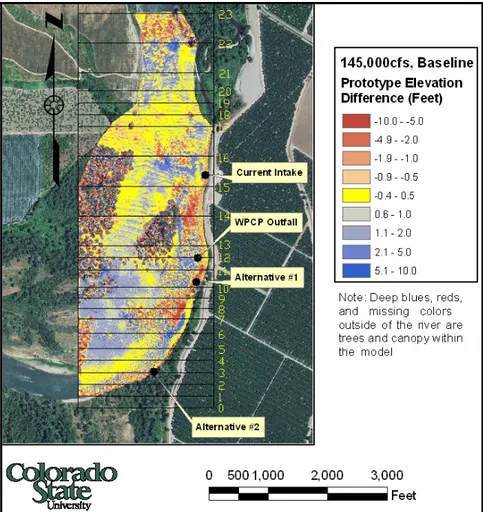
Decreases in local flow-velocities observed at the pump station intake primarily caused the observed aggradation. Figure 3, the flow-velocity raster plot generated from the measured data, illustrates the local flow-velocity reduction at the pump intake during the 145,000-cfs flow. Prototype aggradation and degradation, based on model measurements, are
illustrated in Figure 4. A range of 2 to 5 ft of prototype aggradation is expected in the vicinity of the pump intake. A prototype flow-velocity of 2.30 feet-per-second (ft/s) and a flow depth of 10.80 ft at 10,000-cfs were measured at the current pump intake location.
Baseline testing of the 10,000- and 90,000-cfs discharges yielded minor bed-elevation changes near the first proposed pump alternative and negligible bed-elevation changes at current pump intake and second proposed pump alternative. Testing at 145,000 cfs yielded degradation in the range of 2 to 5 ft in the area of the first proposed pump alternative, due to a localized velocity increase during the 145,000-cfs flow. The localized flow-velocity increase at 145,000 cfs near the first proposed pump alternative is a result of the narrower channel upstream and the presence of a protrusion along the east bank further constricting flow near the first proposed pump alternative. The protrusion also directs the channel thalweg towards the west floodplain causing dissolution of higher flow-velocities and sedimentation downstream of the first proposed pump alternative and the west
floodplain. Flow-velocities and flow depths were greater at the first proposed pump alternative than at the current pump intake, but were within the range of suitable pump operation.
Figure 3. Prototype flow-velocity trends during baseline 145,000-cfs testing
Negligible changes in flow-velocity and bed-elevation were observed at the second proposed pump alternative. Low flow depths, approximately 7.0 ft, observed during the 10,000-cfs discharge may not be sufficient for operation of the current pump intake configuration and may require a different type of intake to allow pump operation.
5.2 Existing Conditions with Gravel Stockpile
Testing of the gravel stockpile option at the 145,000-cfs discharge yielded negligible differences compared to the 145,000-cfs testing of the baseline configuration. Low flow-velocities and relative discharge over the west floodplain resulted in minimal changes to channel hydraulics and sediment transport with the inclusion of the stockpile. Flow-velocities and flow depths for pump operation were not evaluated for this configuration as the 10,000-cfs flow did not inundate the gravel stockpile; therefore, no differences from the baseline configuration were expected.
Figure 4. Prototype sedimentation trends after baseline 145,000-cfs testing
5.3 Channel Realignment
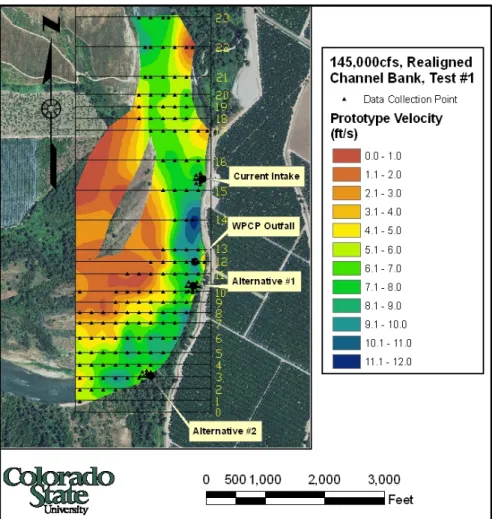
Testing of the realigned channel resulted in flow-velocity and sedimentation trends that deviated from those measured during testing of the baseline configuration in the area near and downstream of the realigned channel section. The channel thalweg, identified by higher flow-velocities, was observed to have migrated closer to the east bank compared to the baseline configuration where the thalweg was less defined and moderate
flow-velocities were spread out across the main channel.
Hydraulic and sedimentation trends at the current pump location were negligibly
different from the baseline configuration testing. Figure 5 provides the flow-velocity raster plot generated from the measured channel realignment data and prototype aggradation and degradation are visually depicted in Figure 6. Prototype sedimentation in the range of 2 to 5 ft was measured and measured flow-velocities and flow depths were consistent with baseline conditions at the current pump location.
Figure 5. Prototype flow-velocity trends during realigned bank 145,000-cfs testing
Straightening of the east bank resulted in increased sedimentation in the vicinity of the realignment modifications, namely the first proposed pump alternative and the City of Chico Outfall (WPCP). The increased sedimentation is due to a wider cross section that resulted in lower flow-velocities, thus promoting sedimentation. Flow-velocities increased in the constricted channel reach between the current pump intake location and the first proposed pump alternative as a result of realignment and tightening of the channel
thalweg. In turn, increased flow-velocities, which promoted degradation, were observed in the constricted reach downstream of the current pump intake location.
Hydraulic conditions at the first proposed alternative were observed to deviate from baseline conditions. At the 10,000-cfs discharge, flow depths significantly increased in this location, although a majority of this increase was due to deepening of the channel as part of the proposed realignment. Negligible changes in flow-velocity near the first proposed pump intake were observed; however, an increase in channel flow-velocity near the east bank was observed due to thalweg migration. Differences in sedimentation trends compared to baseline conditions were observed with the realignment which resulted in prototype aggradation of up to 2 ft near the first proposed alternative and prototype aggradation of less than 1 ft near the WPCP outfall.
Figure 6. Prototype sedimentation trends after bank realignment, 145,000-cfs testing Negligible changes in bed-elevation were observed near the second proposed pump location. However, due to channel realignment and shift of the channel thalweg, higher flow-velocities were measured at the second proposed pump alternative as compared to the baseline configuration.
Subsequent tests of the 145,000-cfs discharge correlated well with the original 145,000-cfs test of the realigned condition. Aggradation occurred near the first proposed pump alternative across each of the subsequent 145,000-cfs tests, suggesting initial
readjustment in this location as a result of the channel realignment. When compared to the baseline configuration, a net aggradation of less than 2 ft was expected near the first proposed pump alternative and a net aggradation of 1 ft from baseline conditions was expected in the vicinity of the WPCP outfall.
6. Conclusions
Results from the physical model study indicated that undeterred operation of the current pump intake is not feasible without significant maintenance, such as dredging, as sedimentation near the intake was measured across all channel configurations.
Additionally, localized flow-velocity decreases measured in the model in the vicinity of the current pump station indicate trends of long-term bed aggradation.
The first proposed alternative may be a promising location for pump relocation as degradation is expected in this area if existing conditions were maintained. However, relative proximity to the existing pump location limits the viability of the first proposed pump alternative as continued downstream migration of the existing gravel bar may impair long-term operation. Aggradation of 1 to 2 ft at the first proposed pump alternative
following bank realignment warrants further concerns regarding the risk of pump relocation to the first alternative site.
The second proposed alternative was the most consistent with negligible bed-elevation changes measured during all channel configurations, suggesting long-term stability. However, downstream migration of the gravel bar should be considered, as the second proposed pump alternative will likely be impacted at some future point. Flow-velocity was relatively consistent across all configurations, with the exception of the realigned bank configuration which increased flow-velocities due to the migration of the thalweg. Flow depths lower than flow depths at the present intake location were observed indicating that different types of fish screens and inlets may be required for the second proposed
alternative pump location.
In conclusion, continued aggradation at the current pump intake limits the long-term viability of operating the pump in its current location. Continued downstream migration of the gravel bar induces risk and uncertainty for all investigated relocation options, although sites further downstream are considered to be more viable than the current pump intake. The second proposed pump intake offers the greatest stability in sedimentation trends and promise for long-term operation.
Acknowledgements. The authors would like to acknowledge the staff of TetraTech, Inc. for their
contributions to the model and for funding of the project on behalf of Ducks Unlimited. Additionally, the authors would also like to acknowledge the hard work and time put into constructing the model and collecting data that undergraduate employees at the CSU Hydraulics Laboratory provided.
References
Cox, A., Scurlock, S. M., Thornton, C., 2008: M&T Pump Station Intake Physical Model Report. Colorado State University Hydraulics Laboratory, Fort Collins, CO.
Mussetter Engineering, Inc., 2006: Two-dimensional Modeling to Evaluate Potential River Training Works
at M&T Pumping Plan Sacramento River, RM 192.5 (2005 Topography and Bed Material).
Julien, P. Y., 2002: River Mechanics, 2nd edition. Cambridge University Press, UK. 371 pages.
Paola, C., and Voller, V.R., 2005: A generalized Exner equation for sediment mass balance. St. Anthony Falls Laboratory, Minneapolis, MN.