ADVANCED THERMOPLASTIC COMPOSITES FOR WIND TURBINE BLADE MANUFACTURING
by
© Copyright by Dylan S. Cousins, 2018 All rights reserved
ii
A thesis submitted to the Faculty and Board of Trustees of the Colorado School of Mines in partial fulfillment of the requirements for the degree of Doctor of Philosophy (Chemical Engineering). Golden, Colorado Date _____________________ Signed: ___________________________ Dylan S. Cousins Signed: ___________________________ Dr. Joseph R. Samaniuk Thesis Advisor Signed: ___________________________ Dr. John R. Dorgan Co-Thesis Advisor Golden, Colorado Date _____________________ Signed: ___________________________ Dr. Anuj Chauhan Professor and Head Department of Chemical and Biological Engineering
iii ABSTRACT
Fiber-reinforced polymer composites are an intriguing class of engineering materials that are increasingly exploited in the construction, aerospace, and energy sectors. Their high specific properties make them an ideal design choice where traditional engineering materials like metals are too heavy, or where unreinforced polymers are not stiff or strong enough. Furthermore, their anisotropic nature can be exploited for unique applications such as airfoils in aircraft wings or wind turbines. However, most structural composites use thermosetting polymers as their matrix, which presents several issues. Foremost is that thermosets cannot be easily recycled, so massive amounts of composite waste are landfilled at the end of a part’s service life. Secondly, thermoset subcomponents of a larger structure can only be joined using adhesives. Conversely, thermoplastic composites enable recycling after a part is retired from service and facilitate thermal joining of multi-part structures.
Liquid infusible thermoplastic resins are beginning to emerge for use in vacuum-assisted resin transfer molding, which is the method of manufacture for wind turbine blades. While infusible thermosetting resins have been well characterized, basic characterization of rheological and kinetic behavior for thermoplastic resins is lacking. The present work provides important experimental development and data aimed at characterization of infusible thermoplastic resin systems. A novel thermoplastic biobased resin system is also developed, which has potential for commercial use.
iv
TABLE OF CONTENTS
ABSTRACT ... iii
LIST OF FIGURES ...x
LIST OF TABLES ... xvi
ACKNOWLEDGEMENTS ... xviii
CHAPTER 1: INTRODUCTION ...1
CHAPTER 2: INFUSIBLE THERMOPLASTIC RESINS: TAILORING OF CHEMORHEOLOGICAL PROPERTIES ...10
2.1 Abstract ... 10
2.2 Introduction ... 11
2.3 Experimental ... 14
2.3.1 Materials ... 14
2.3.2 Steady shear rheology ... 14
2.3.3 Exotherm measurement ... 15
2.3.4 Chemorheology ... 16
2.3.5 Fabrication and mechanical testing of composite test panels ... 18
2.3.6 Gel permeation chromatography... 19
2.4 Results and discussion ... 19
2.4.1 Steady shear rheology ... 19
2.4.1.1 Temperature dependence of viscosity ... 19
2.4.1.2 Shear rate dependence of viscosity ... 21
2.4.1.3 Formulation of c[η] caster curve ... 22
2.4.2 Exotherm measurements ... 24
v
2.4.4 Molecular weight distributions of composite panels ... 34
2.4.5 Mechanical testing of composite panels ... 34
2.5 Conclusions ... 39
CHAPTER 3: MISCIBLE BLENDS OF BIOBASED POLY(LACTIDE) WITH POLY(METHYL METHACRYLATE): EFFECTS OF CHOPPED GLASS FIBER INCORPORATION...43 3.1 Abstract ... 43 3.2 Introduction ... 44 3.3 Experimental ... 47 3.3.1 Materials ... 47 3.3.2 Blend Processing ... 47 3.3.3 Injection Molding... 49
3.3.4 Molecular Weight Characterization ... 50
3.3.5 Thermal Characterization ... 50
3.3.6 Mechanical Properties ... 51
3.3.7 Morphological Characterization ... 51
3.4 Results and Discussion ... 52
3.4.1 Molecular Weight Characterization ... 52
3.4.2 Thermal Characterization ... 53
3.4.3 Mechanical Characterization ... 57
3.4.4 X-ray CT Scanning ... 64
3.4.5 Electron Microscopy ... 65
3.5 Conclusions ... 67 CHAPTER 4: THERMOPLASTIC COMPOSITES USING VACUUM-ASSISTED RESIN
vi
RHEOLOGICAL PROPERTIES AND PRELIMINARY PANEL
FABRICATION. ...69 4.1 Abstract ... 69 4.2 Introduction ... 70 4.3 Experimental ... 73 4.3.1 Materials ... 73 4.3.2 Solubility Testing ... 73
4.3.3 Dilute Solution Viscometry ... 74
4.3.4 Solution Rheology ... 75
4.3.5 Multi-Angle Laser Light Scattering ... 75
4.3.6 Fabrication of Prototypical Test Panel ... 76
4.4 Results and Discussion ... 77
4.4.1 Dilute Solution Viscometry ... 77
4.4.2 Multi-Angle Laser Light Scattering (MALLS)... 82
4.4.3 Determination of the Flory-Huggins Interaction Parameter from MALLS . 83 4.4.4 Comparison of Molecular Size as Determined by DSV and MALLS ... 85
4.4.5 Solution Rheology ... 86
4.4.5.1 Shear Rate Sweeps ... 86
4.4.6.2 Temperature Sweeps ... 87
4.4.7 Fabrication of Prototypical Test Panel ... 91
CHAPTER 5: RECYCLING GLASS FIBER THERMOPLASTIC COMPOSITES ...92
5.1 Abstract ... 93
5.2 Introduction ... 94
vii
5.3.1 Thermal degradation ... 96
5.3.2 Mechanical grinding ... 97
5.3.3 Thermoforming ... 98
5.3.4 Solvolysis and dissolution... 99
5.4 Methods... 99
5.4.1 Materials ... 99
5.4.2 Fabrication of spar cap component ... 100
5.4.3 Fabrication and thermoforming of thermoplastic test panels ... 101
5.4.4 Simultaneous thermal analysis ... 102
5.4.5 Mechanical testing of injection molded regrind ... 102
5.4.6 Dissolution of spar cap component ... 104
5.4.7 Tensile testing of recovered glass fiber rovings ... 106
5.4.8 Thermogravimetric analysis of recovered fibers ... 107
5.5 Results and Discussion ... 107
5.5.1 Simultaneous thermal analysis: energy requirements ... 107
5.5.2 Grinding and injection molding: tensile properties ... 109
5.5.3 Thermoforming thermoplastic spar cap and test panels ... 110
5.5.4 Dissolution of spar cap component ... 113
5.5.5 Tensile properties of recovered fiberglass rovings ... 115
5.5.6 Thermogravimetric analysis of recovered fibers from dissolution ... 117
5.5.7 Economic analysis and recycling facility model ... 117
5.6 Conclusions ... 121
CHAPTER 6: MECHANICAL PROPERTIES OF THERMOPLASTIC COMPOSITES FOR WIND TURBINE BLADE MANUFACTURING ...124
viii
6.1 Abstract ... 124
6.2 Introduction ... 125
6.3 Materials and methods ... 126
6.3.1 Preparation of test coupons ... 127
6.3.2 Mechanical Testing ... 128
6.3.3 X-ray Computed Tomography Scanning ... 129
6.4 Results ... 129
6.4.1 Mechanical Testing ... 129
6.4.1.1 Tensile ... 129
6.4.1.2 Compression ... 130
6.4.1.3 Flexural ... 131
6.4.1.4 Short Beam Shear ... 132
6.5 Discussion ... 132
6.5.1 Comparison of coupon mechanical properties ... 132
6.5.2 Feasibility of Elium for composite construction ... 134
CHAPTER 7: CONCLUSIONS AND RECOMMENDATIONS ...135
7.1 Overall Conclusions ... 136
7.2 Recommendations ... 136
7.3 Contribution of experimental development ... 140
REFERENCES ...141
APPENDIX A : SUPPORTING INFORMATION FOR: INFUSIBLE THERMOPLASTIC RESINS: TAILORING OF CHEMORHEOLOGICAL PROPERTIES ... 161
APPENDIX B : SUPPORTING INFORMATION FOR: MISCIBLE BLENDS OF BIOBASED POLY(LACTIDE) WITH POLY(METHYL METHACRYLATE): EFFECTS OF CHOPPED GLASS FIBER INCORPORATION ... 166
ix
APPENDIX C : SUPPORTING INFORMATION FOR: THERMOPLASTIC COMPOSITES USING VACUUM-ASSISTED RESIN TRANSFER MOLDING WITH A STYRENE FREE BIOBASED SYSTEM. I. RHEOLOGICAL PROPERTIES AND PRELIMINARY PANEL FABRICATION. ... 167 APPENDIX D : COPYRIGHT PERMISSIONS ... 175
x
LIST OF FIGURES
Figure 1.1. Wind energy installations and cumulative capacity in the United States by year.1
...2 Figure 1.2. VARTM of a composite test panel (left) and setup of VARTM for infusion of
a 13 m prototypical thermoplastic wind turbine blade...4 Figure 1.3. Effect of solvent quality on polymer coil size in a dilute solution. Polymers in
a theta solvent have an ideal random walk end-to-end distance of R0 = bN0.5, while the polymer in good solvent is self-avoiding with a Flory end-to-end distance of RF = bN0.588, where N is the average repeat unit length and b is
the Kuhn monomer size. Adapted from Colby 2010.2 ...5 Figure 2.1. Experimental setup for exotherm measurements. The scintillation vials
containing the reactants are placed in an oil bath. Thermocouples are fed
through a hole in the lid which is then sealed with yellow vacuum tape. ...15 Figure 2.2. Viscosity as a function of temperature for 80k(a) PMMA in MMA. Lines
represent a fit to the Andrade-Eyring equation (Eq. (2.2)). ...20 Figure 2.3. Parameters for the Andrade-Eyring equation as a function of intrinsic viscosity
normalized concentration, c[η], for 80k(a) PMMA in MMA. The line
represents a fit to Eq. (2.3). ...21 Figure 2.4. Shear rate sweeps for (a) 30 wt%, (b) 35 wt%, (c) 40 wt% and (d) 45 wt%
80k(a) PMMA in MMA. Lines represent a fit to the Carreau-Yasuda
equation (Eq. (2.4)). ...23 Figure 2.5. Shear rate sweeps for (a) 15 wt%, (b) 20 wt% and (c) 25 wt% 500k PMMA in
MMA. Lines represent a fit to the Carreau-Yasuda equation (Eq. (2.4)). ...26 Figure 2.6. Master curve of PMMA in MMA fit to a third order polynomial according to
Eq. (2.9) with constant values C1 = 1.17820, C2 = 1.7865, C3 = 0.8759, and
C4 = 0.3136. ...27 Figure 2.7. Temperature profiles of reacting solutions of PMMA dissolved in MMA. The
solid lines depict the solution with 10.5 wt% 500k pre-dissolved PMMA and the dotted lines depict the solution with 30 wt% 30k pre-dissolved
PMMA. ...28 Figure 2.8. Viscosity profiles of reacting solutions of PMMA dissolved in MMA at 20 °C.
In each plot, the concentration of the initiator is changed. The profiles are plotted with the same time scale to highlight the difference in onset of the Trommsdorff effect despite starting at the same initial viscosity of 0.145 Pa∙s. ...30
xi
Figure 2.9. Viscosity profiles of reacting solutions of PMMA dissolved in MMA at 20 °C. Within each plot, the resin type (concentration and molecular weight of pre-dissolved PMMA) is changed but the ratio of reactive species is the same. The profiles are plotted with the same scale to highlight the difference in onset of the Trommsdorff effect despite starting at the same initial viscosity.
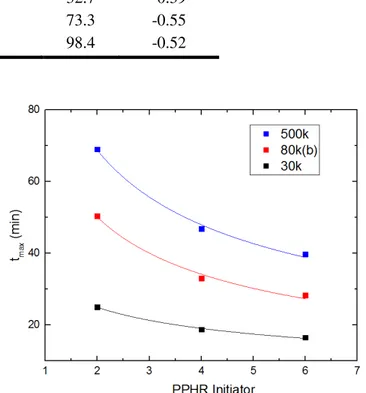
...31 Figure 2.10. Times of maximum viscosity change during curing profiles of PMMA in
MMA. Lines represent a fit to a power law with form tmax = Acib (Eq.
(2.10))...32 Figure 2.11. Viscosity as a function of reduced time for the various solutions of PMMA in
MMA. For each line color, 2 PPHR initiator is depicted by the solid lines, 4 PPHR initiator is depicted by the dashed lines, and 6 PPHR initiator is
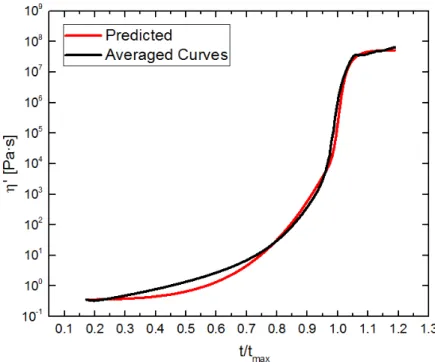
depicted by the dotted lines. ...33 Figure 2.12. Viscosity predicted by Eqs. (2.11) through (2.13) as a function of reduced
time. ...33 Figure 2.13. Molecular weight distribution of the PMMA taken from the 30k panel
compared to that of the 500k panel. Shown in the inset are the distributions
of the pre-formed PMMAs (30k, 80k(a), 80k(b), and 500k). ...35 Figure 2.14. Modulus of varying unidirectional geometries and loading types. [0-0-0-0]
denotes that the orientation of the fibers is parallel (or longitudinal) to the testing axis and [90-90-90-90] indicates that the fibers are perpendicular (or transverse) to the testing axis. The center point (○) represents the mean, the center line the median, the box is the inter-quartile range, the whiskers are 1.5 times the standard deviation and outliers are plotted as closed circles (●).
...40 Figure 2.15. Strength of varying unidirectional geometries and loading types. [0-0-0-0]
denotes that the orientation of the fibers is parallel (or longitudinal) to the testing axis and [90-90-90-90] indicates that the fibers are perpendicular (or transverse) to the testing axis. The center point (○) represents the mean, the center line the median, the box is the inter-quartile range, the whiskers are 1.5 times the standard deviation and outliers are plotted as closed circles (●).
...41 Figure 3.1. GPC voltage traces from the 90° light scattering detector for the polymer blend
(left) and the composite (right). (+ gf) denotes blends with 40 wt% glass fiber. Samples are listed in the legends in order of decreasing voltage peak. The unprocessed homopolymers (denoted vPLA and vPMMA) are included
in both figures for comparison. ...52 Figure 3.2. TGA scans of PLA/PMMA blends (left) and the composite system with 40 wt%
xii
Figure 3.3. DSC scans (Endo Up) of PLA/PMMA blends (left) and composite system
(right). (gf) denotes blends with 40 wt% glass fiber. ...55 Figure 3.4. Glass transition temperatures for polymer blends (left) and the composite
system (right) as a function of weight fraction of PLA for the blends and
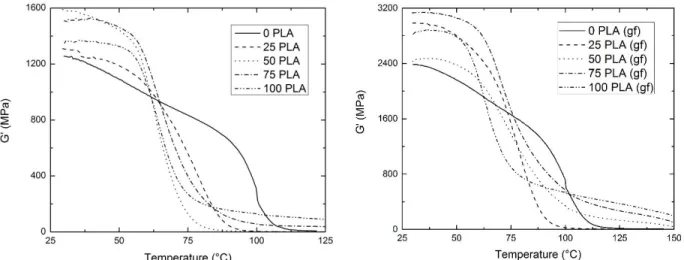
composite systems. (gf) denotes systems with 40 wt% glass fiber...56 Figure 3.5. Shear storage moduli for PLA/PMMA blends (left) and the composite system
(right) as a function of temperature. (gf) denotes blends with 40 wt% glass
fiber. ...57 Figure 3.6. Heat distortion temperature for polymer blends and the composite system as a
function of PLA content. (gf) denotes systems with 40 wt% glass fiber. ...58 Figure 3.7. Impact strength for PLA/PMMA blends. (gf) denotes blends with 40 wt% glass
fiber. ...59 Figure 3.8. Tensile modulus of PLA/ PMMA blends and composites as a function of PLA
content from tensile tests. (gf) denotes blends containing 40 wt% glass fiber.
...60 Figure 3.9. Toughness of polymer blends and the composite systems as a function of PLA
content. (gf) denotes systems with 40 wt% glass fiber. ...61 Figure 3.10. % Strain at break for polymer blends and the composite system as a function
of PLA content. (gf) denotes systems with 40 wt% glass fiber. ...61 Figure 3.11. Stress at break of PLA/ PMMA blends as a function of PLA content. (gf)
denotes blends containing 40 wt% glass fiber. ...62 Figure 3.12. DSC first heating scans (Endo Up) of tensile specimens. Samples taken from
the fracture surface. ...63 Figure 3.13. X-Ray CT scan of 50 wt% PLA with glass fiber tensile specimen in the gauge
region of the dog-bone bar. Fibers are generally oriented in the direction of
injection molding and tensile loading. ...65 Figure 3.14. SEM images of (a) 25 wt% PLA, (b) 50 wt% PLA, (c) 75 wt% PLA, and (d)
50 wt% PLA with glass fiber. ...66 Figure 4.1. Huggins (left axis) and Kramer (right axis) extrapolations for SH-PLA-19
dissolved in MMA. ...77 Figure 4.2. Intrinsic viscosity as a function of viscosity-averaged molecular weight. Error
bars on the intrinsic viscosity values are smaller than the plotting symbol
xiii
Figure 4.3. Intrinsic viscosity plotted as a function of the viscosity-averaged molecular
weight normalized by the polydispersity index (PDI) of the sample...80 Figure 4.4. Stockmayer-Fixman plot of amorphous PLA dissolved in MMA. The red arrow
indicates the anomalous data point as described in the text. ...81 Figure 4.5. Berry plot for PLA (sample SH-PLA-13) dissolved in methyl methacrylate. ...84 Figure 4.6. Expansion factor, α, of PLA in MMA as a function of molecular weight. ...85 Figure 4.7. Viscosities of PLA 4060D in MMA over various weight loadings of polymer
as a function of shear rate at 30 °C. The lines represent a fit to the
Carreau-Yasuda viscosity model. ...87 Figure 4.8. Temperature dependence of the zero shear viscosity of solutions of PLA 4060D
in MMA. Lines represent a fit to the Andrade-Eyring viscosity equation...88 Figure 4.9. Parameters of the Andrade-Eyring equation as a function of polymer
concentration. ...89 Figure 4.10. Specific viscosity as a function of concentration of polymer multiplied by the
intrinsic viscosity. The data for the specimen labeled 30 °C are from the steady shear measurement of a solution of PLA 4060D. The other types of PLA are from DSV experiments conducted at 30 °C. The solid line represents a double logarithmic, third-order polynomial fit to Eq. (4.15)
with coefficients C1 = 0.23, C2 = 1.0, C3 = 2.1, and C4 = 0.38. ...91 Figure 4.11. Two prototypical panels for fabrication of mechanical testing specimens. The
panel on the left was infused with high viscosity resin and was unable to fill completely before curing. The panel on the right was infused with a tuned
low viscosity resin and filled completely. ...92 Figure 5.1. Elium spar cap component infused at the National Wind Technology Center. ...100 Figure 5.2. Elium spar cap component after de-molding...101 Figure 5.3. Strips of spar cap component (left) and subsequent ground composite material
passed through a 3.5 standard mesh screen (foil pan) and a 7 standard mesh
screen (round bucket). ...103 Figure 5.4. Dog bones fabricated for tensile testing of the regrind material. ...104 Figure 5.5. Thermoplastic Elium composite (top) can be separated into fibers (left) and the
polymer resin (right) by dissolution. This separation and recovery is not
possible with thermoset composites...105 Figure 5.6. Fiber roving specimens for tensile testing from the dissolution experiment (left)
xiv
Figure 5.7. Heat flow as a function of temperature for Elium (black) and epoxy (red). ...108 Figure 5.8. Mass loss profiles and mass loss derivative of Elium (black) and epoxy (red) as
a function of temperature. ...109 Figure 5.9. Tensile modulus (top) and tensile strength (bottom) of PMMA blended with
recyclate (vPMMA + Recyclate) compared to virgin PMMA (vPMMA) and virgin PMMA plus chopped fibers (vPMMA + Fibers). Error bars represent standard deviations. All values have been normalized to a fiber volume fraction of 0.22 according to Eq. (5.1). The center point (○) represents the mean, the center line the median, the box is the inter-quartile range, the whiskers are 1.5 times the standard deviation, and outliers are represented by closed circles (●). ...111 Figure 5.10. A prototypical skateboard fabricated in part by thermoforming an Elium/ glass
fiber test panel as reinforcement. ...112 Figure 5.11. A section of the prototypical thermoplastic spar cap that has been
thermoformed into a straight shape. In this way, the material can be planed
into strips that have maximum fiber continuity. ...112 Figure 5.12. Process flow diagram for pressure swing distillation of a chloroform/methanol
mixture. ...114 Figure 5.13. Mass normalized tensile properties of glass fiber rovings recovered from
dissolution of the thermoplastic part compared to those of virgin JM 086
StarRov fibers. ...116 Figure 5.14. Cost per wind turbine blade for variation in the knockdown rate of fibers and
resin given the figures in Table 5.2. The bold line ($0) represents the
break-even point for the recycling operation. ...122 Figure 6.1. Side view of one-quarter of the spar cap component that was fabricated at the
NWTC. The samples were cut through the thickness of the spar cap as
indicated here. ...127 Figure 6.2. View from the top of a sectioned tensile specimen. The enlarged image
highlights some of the fiber bundles that are discontinuous by outlining them in red. The minor crossing fiber bundles can also be easily
distinguished. ...128 Figure 6.3. Cross section of three-point bend specimen with fiber bundle cross-sections
highlighted in black. The red edges denote places where the fiber bundles
are cut in the longitudinal direction. ...128 Figure 6.4. Tensile properties of panel coupons and coupons cut from a spar cap component
for Elium and epoxy resin systems. The Elium spar cap coupons have a
xv
Figure 6.5. Compressive modulus (left) and compressive stress (right) of Elium panel coupons, epoxy panel coupons, and coupons cut from an Elium spar cap. The Elium spar cap coupons have a higher percentage of discontinuous
fibers. ...130 Figure 6.6. Flexural tangent modulus (left) and flexural strength (right) of Elium panel
coupons, epoxy panel coupons, and coupons cut from an Elium spar cap. The Elium spar cap coupons have a higher percentage of discontinuous
fibers. ...131 Figure 6.7. Short beam strength of Elium coupons, epoxy coupons, and coupons cut from
an Elium spar cap. The Elium spar cap coupons have a higher percentage of
discontinuous fibers. ...132 Figure 6.8. Schematic demonstrating the accelerated failure mechanism for the spar cap
components that yield a lower strength. The process is described further in the text. A. Specimen under no load. B. Specimen loaded, but not to the point of failure. C. Specimen fails at discontinuous fiber bundle. D. Specimen fails catastrophically initiated at discontinuous fiber bundle
detatchment. ...133 Figure 6.9. X-ray CT scan of a compression coupon specimen cut from an Elium spar cap
section. The red oval indicates an area with a discontinuous fiber bundle
xvi
LIST OF TABLES
Table 1.1. Specific modulus and strength (property/mass) for various engineeing
materials.5...1 Table 2.1. Absolute molecular weights of PMMAs determined by gel permeation
chromatography with light scattering detection. ...14 Table 2.2. Parameters for the predicting flow-activation energy according to Eq. (2.3).
...21 Table 2.3. Parameters of the Carreau-Yasuda equation (Eq. (2.4)) for solutions of
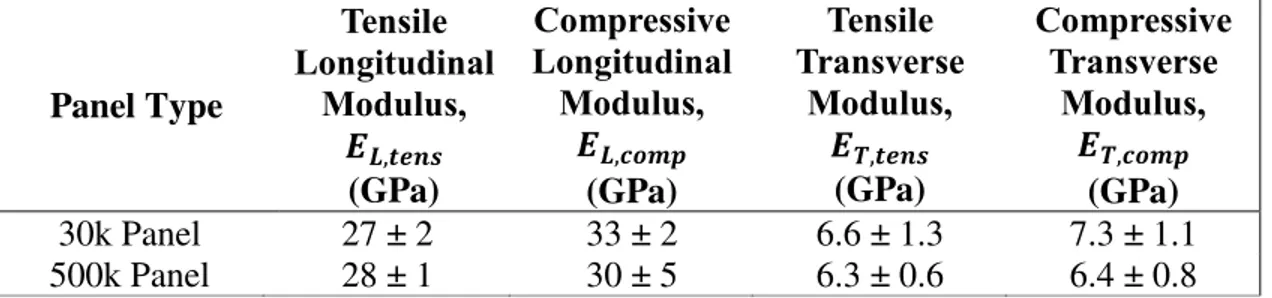
PMMA in MMA for various concentrations and molecular weights. ...23 Table 2.4. Parameters of Eq. (2.10) for various molecular weights of PMMA. ...32 Table 2.5. Young’s modulus of unidirectional glass fiber reinforced PMMA
composites fabricated with two different resins for various fiber orientations.
...37 Table 2.6. Strength of unidirectional glass fiber reinforced PMMA composites
fabricated with two different resins for various fiber orientations. ...39 Table 3.1. Compositions of blends in the present study by weight percent. ...47 Table 3.2. Processing parameters for blend extrusion. (gf) denotes blends with 40 wt%
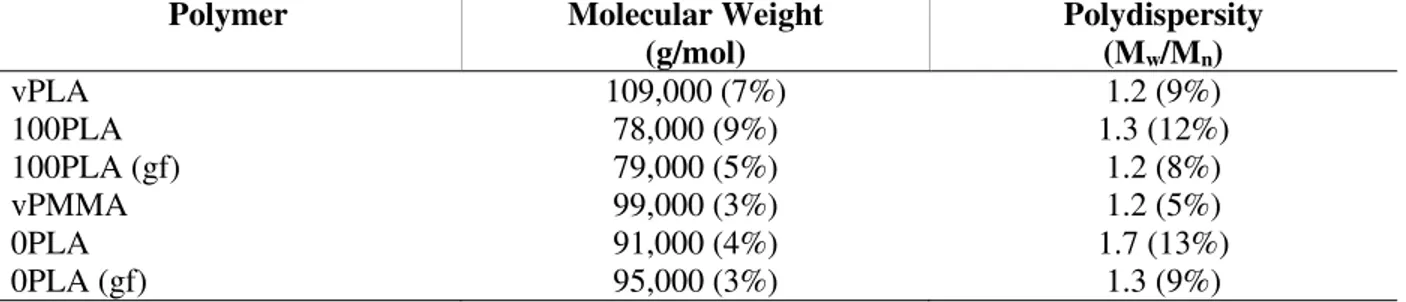
glass fiber. ...49 Table 3.3. Weight average molecular weights of homopolymers before and after
processing. Statistical uncertainties due to detector fluctuation are given in
parentheses. ...53 Table 3.4. Parameters determined from TGA. Onset temperature (To), peak
degradation rate temperature (Td), and final degradation temperature (Tf). ...54 Table 3.5. Mechanical property comparison of short glass fiber reinforced
thermoplastics. Values are normalized by the volume fraction of glass fiber
in the composite part. ...64 Table 4.1. Amorphous PLA samples used for DSV measurements (SH-PLA-xx) and
panel fabrication (PLA 4060D). ...74 Table 4.2. Weight-averaged molecular weights, root-mean-square radii of gyration
(s21/2), and second virial coefficients (A2) for PLA in MMA determined
by MALLS. ...83 Table 4.3. Values of the Flory Interaction parameter determined by MALLS. ...84
xvii
Table 4.4. Carreau-Yasuda parameters for PLA 4060D in MMA at 30 °C. ...87 Table 5.1 Primary energy costs for various recycling methods for acrylic-based
composites...117 Table 5.2. Thermoplastic blade recycling facility inputs and cost summary. ...120 Table 5.3. Advantages and disadvantages for potential thermoplastic composite
recycling methods. ...123 Table 7.1. Proposed fatigue testing for comparison between Elium and epoxy
composites...139 Table B.1. Conditions for injection molding of PLA/PMMA blends. (gf) denotes
blends with 40 wt% glass fiber. ...166 Table C.1. Intrinsic viscosity values determined from the Huggins and Kraemer
xviii
ACKNOWLEDGEMENTS
My immense gratitude is given to my thesis advisors: Aaron Stebner, John Dorgan, and Joe Samaniuk. Each contributed in his own substantial and insightful way to this work and to my professional development. I am eternally thankful for my lab mates: Peter Caltagirone, for our excellent collaboration on composites research; Professor Yasuhito Suzuki, for many fruitful discussions, advice, and collaboration during our time at Mines; Dr. Christopher Moran, who helped me with the poly(lactide) work presented here and who was always game for some skiing; Aaron Frary, for his longtime friendship and continued composites collaboration; Emily Campion, for her wonderful and distinct Minnesota personality; and Nic Rorrer, for lending perspective to a budding graduate student. Thank you to the undergraduate students who helped with this work over the years: Corinne Lowe, Jackie Moreno, Jackson Howell, and Dave Briddle.
Many thanks to our department office staff over the years: Deanna Jacobs, Anne Messerli, Kim Luzeckyj, Erika Schoonmaker, and Kelsey Tennett. I give special thanks in particular to Amy Brice of the Stebner group for her support over the past year and a half. Katie Woslager with Colorado OEDIT deserves special recognition for coordinating funding for this work under the IACMI consortium.
Of course, none of this work would have been possible without the continuous support of my loving parents, sister, and girlfriend, Sarah. I love you all immeasurably.
1
CHAPTER 1: INTRODUCTION
Composites are an essential material class because of their high specific properties brought about by their heterogeneous nature. Particularly, fiber-reinforced polymer composites (FRPCs) are important for automotive and aerospace construction, wind and marine hydrokinetic energy, and recreational products. Carbon fiber-reinforced composites are particularly useful because of their high specific mechanical properties (property/mass). The tensile modulus for 6061 T6 aluminum is on the order of 70 GPa compared to 144 GPa for carbon fiber/epoxy composite.3,4 Table 1.1 presents specific properties for polymer composites versus other engineering materials.5 Polymer composites have excellent corrosion resistance, are less energy-intensive to produce, and are less dense compared to engineering metals.6 Moreover, polymer composites can be used to fabricate large airfoils such as those used for wind turbine blades and aircraft wings where traditional engineering metals are prohibitively massive or otherwise infeasible to manufacture. Furthermore, FRPCs can be strategically fabricated to exploit anisotropy to better manage anticipated stress compared to homogeneous materials like metals.
Table 1.1. Specific modulus and strength (property/mass) for various engineeing materials.5 Material Specific Modulus (in.) Specific Strength (in.)
Aluminum 1 × 10⁸ 1 × 10⁵
Stainless steel 1.1 × 10⁸ 8.8 × 10⁵
Glass-epoxy composite 9.2 × 10⁷ 2.6 × 10⁶
2
Wind energy installation has remained consistent in the United States over the past decade with approximately 7.3 GW installed annually as shown in Figure 1.1.1 Wind energy accounted for 6% of electricity generation in the United States in 2017.7 Worldwide installed wind power capacity reached 539 GW through 2017,8 which accounted for 1,050 TWh of generation.9 Increased wind energy utilization can be attributed to larger wind turbine blades. The power generated from a wind turbine scales with the cross-sectional area swept by the rotor, so it is desirable to increase the length of wind turbine blades.10 This increased length also leads to more massive blades; the blades of modern industrial turbines are 50 to 60 m in length and weigh 15 to 20 metric tons.11Today’s blades, and most FRPCs used in high-performance applications, have a thermosetting polymer matrix; thermosets account for two-thirds of polymer composite materials.12 Common thermosetting systems for structural manufacturing include epoxy, poly(vinyl ester), poly(urethane), and poly(imide). These polymers are cross-linked so that the
polymer matrix is a covalently bonded network. The cross-linked thermosetting nature of the Figure 1.1. Wind energy installations and cumulative capacity in the United States by year.1
3
polymer matrix renders these materials essentially unusable at the end of their service lives; therefore, most wind turbine blades are landfilled.13 FRPCs constructed with a thermoplastic polymer matrix present a solution by which wind turbine blades could be recycled at the end of their service lives, because these materials can be more economically reprocessed. Rather than being cross-linked, thermoplastic composites consist of entangled chains. It is this architecture that allows thermoplastics to be thermally remolded or dissolved; these techniques are not available to thermosets. Furthermore, thermoplastic resins enable thermal joining of separate parts and facilitate recycling techniques different from those available to thermosets.14,15 A complete review of the state of the art of composites recycling techniques is provided in Chapter 5.
While thermoplastics are able to flow with sufficient heat, these polymers are too viscous to effectively infuse using vacuum-assisted resin transfer molding (VARTM), which is the technique used to manufacture wind turbine blades.16 In the VARTM process, a flexible vacuum bag is placed over fibers, breather cloth, and flow media. Vacuum and inlet ports are strategically positioned to fill the part during infusion. Generally, vacuum is pulled through port(s) on one side of the part and a reactive monomeric liquid is pulled through inlet port(s). Once filled, the part cures into a solid FRPC.17 Figure 1.2 shows a test panel in the middle of the VARTM infusion (left) and a 13 m wind turbine blade being prepared for VARTM infusion (right). Since resin must be pulled through a thick mat of fibers, resin viscosity control is of critical importance for this process to be carried out effectively. This is the central focus of the research presented in this thesis.
The viscosity of a reactive resin for VARTM infusion must be tuned within a precise range to work effectively. If the resin is too fluid, the part will not wet-out—jetting will occur, which leads to undesirable void formation. If the resin is too viscous, flow resistance will prevent the part from filling completely. The desired viscosity is on the order of 0.1 to 1 Pa∙s. Resins used for liquid
4
infusion are polymer solutions in which oligomeric or polymeric chains are dissolved in a monomer. The polymeric or oligomeric chains may also be chemically functionalized to participate in the polymerization. An additional function of these chains is to increase the viscosity of the monomeric resin. The viscosity of typical thermoplastic monomers is too low for infusion; styrene has a viscosity of 0.000696 Pa∙s at 25 °C and methyl methacrylate (MMA) has a viscosity of 0.000554 at 25 °C.18,19 Therefore, the viscosity needs to be increased by about three orders of magnitude to be suitable for infusion. This can be done by dissolving polymer into the monomer, but the interactions between the two compounds must be understood to effectively predict the viscosity of the resultant mixture.
Infusible resins are polymer solutions, which is a material class that has been extensively studied since the beginning of polymer science. The interactions between solvent molecules and polymer chains can cause the chain to swell or contract in solution as depicted in Figure 1.3. The so-called theta condition pictured in Figure 1.3 is the conformation that a polymer chain assumes Figure 1.2. VARTM of a composite test panel (left) and setup of VARTM for infusion of a 13 m prototypical thermoplastic wind turbine blade.
5
in a polymer melt or at a specific temperature in a specific solvent. In this condition, the osmotic forces that would cause the coil to expand are exactly balanced by the elastic forces between the covalent bonds. In a good solvent, the coil expands because the osmotic pressure inside the polymer coil is higher due to the favorable interaction between the solvent molecules and the polymer chain. In a poor solvent, the opposite occurs: the coil shrinks because the osmotic pressure is low and the elastic forces between the bonds dominate. The viscosity of the polymer solution therefore depends on the concentration, molecular weight, and quality of the solvent. One of the primary thrusts of this work is to characterize the viscosity of poly(methyl methacrylate) (PMMA) dissolved in its monomer, MMA, and the viscosity of poly(lactide) (PLA) dissolved in MMA. The development of the mathematical framework for how polymer solution viscosity scales with molecular weight and concentration is developed in Chapter 2 for PMMA in MMA and in Chapter 4 for PLA dissolved in MMA.
Figure 1.3. Effect of solvent quality on polymer coil size in a dilute solution. Polymers in a theta solvent have an ideal random walk end-to-end distance of R0 = bN0.5, while the polymer in good solvent is self-avoiding with a Flory end-to-end distance of RF = bN0.588, where N is the average repeat unit length and b is the Kuhn monomer size. Adapted from Colby 2010.2
6
Characterizing the properties of a polymer dissolved in a monomer to create an infusible resin is important, but these systems are also reactive when fabricating composite parts. That is, the resin is mixed with an initiator to induce polymerization during infusion. Because more polymer forms during the infusion, the solution viscosity will change. It is of utmost importance to characterize the viscosity of the solution so that manufacturers can predict how much “working time” to anticipate during infusion. Furthermore, the free-radical polymerization of methyl methacrylate is exothermic. Of particular concern is the auto-acceleration of the polymerization that happens due to the Trommsdorff (or gel) effect.20 The increasing viscosity of a reactive polymer solution eventually causes macro-radicals to become trapped because of diffusional limitations. When these “live” growing chains with a radical end are trapped, termination reactions cannot occur.21 Therefore, more heat is generated, which causes more radicals to initiate, and the rate coefficients for polymerization increase. Small molecules are still able to diffuse to the macro-radical chain ends, so the process is “auto-catalytic,” and drastic rises in temperature can occur over very short time periods. If heat transfer out of a part is greater than the heat generated by the reaction, the temperature in the part can sufficiently rise to boil the remaining monomer.22 The boiling causes bubbles to form in the part, and when solidified, the bubbles remain as voids that can compromise the mechanical properties of the composite. Therefore, it is another primary interest of this study to investigate the coupled effects of the exothermic reaction with the viscosity of the reacting polymer solution.
PMMA is an energy-intensive material to fabricate, with a primary production energy cost of 207.3 MJ/kg.23 In the same study, only aluminum was found to require more production energy (207.8 MJ/kg). The gross energy requirement for PLA production is less than half of that of aluminum or PMMA at 82.5 MJ/kg.24 Therefore, it is of interest to replace the pre-formed PMMA
7
in these polymer solutions with PLA. This material system has never been investigated before, so the solution properties need to be characterized. Furthermore, the miscibility of the polymer systems needs further investigation due to discrepancies in the literature as outlined in section 3.2. The polymer compatibility study and resin system characterization are presented in Chapters 3 and 4, respectively.
A potential benefit of thermoplastic composites is the facilitation of end-of-life composite structure recycling. There are both pros and cons to the heterogeneous nature of composites: heterogeneity allows these structures to be lightweight yet strong, but heterogeneity also complicates recycling because two fundamentally different materials are bound together. Thermoplastic composites enable recycling by two unique methods. The first is thermoforming, in which composite structures are reshaped by heating, molding to a new shape, and then cooling. The second is by dissolution, in which the polymer matrix is dissolved into a solvent so that the fibers and matrix can be recovered separately. Chapter 5 investigates the feasibility of recovering the constituents of a wind turbine blade subcomponent by dissolution compared to various other techniques used for recycling composites.
The mechanical properties of composites fabricated using thermoplastic resins must also be qualified by comparison to standard thermoset systems if these materials are to be used for wind turbine blade fabrication. The inherent anisotropy of continuous fiber-reinforced composites means that these materials have different properties depending on the direction in which they are loaded. Tests conducted in the direction of the fibers, such as unidirectional longitudinal tensile tests, are dominated by the properties of the fibers themselves. However, orienting the fibers in a direction perpendicular to the load will cause the properties to be dominated by those of the resin and the fiber/matrix interface. Of the six components of the modulus, the primary interest for
8
FRPCs are the longitudinal Young’s modulus, 𝐸𝐿, the transverse Young’s modulus 𝐸𝑇, the longitudinal-transverse shear modulus, 𝐺𝐿𝑇, and the transverse shear modulus, 𝐺𝑇𝑇.5 The strengths of the corresponding orientations are of interest as well. Furthermore, other loading conditions such as flexural and short-beams-shear are of interest for wind turbine blade original equipment manufacturers (OEMs). Chapter 6 outlines a preliminary suite of mechanical tests that have been conducted on a composite fabricated using a commercial methacrylate resin compared to tests conducted on a common commercial epoxy system used in fabrication of wind turbine blades.
The growing prospect of the use of thermoplastics for liquid infusion highlights several challenges that are investigated in this study. Foremost is control of the onset of the Trommsdorff effect during reactive infusion using VARTM. It is hypothesized that a high concentration of lower molecular weight polymer can be used to shorten the cycle time while simultaneously decreasing the heat released during the Trommsdorff effect. The study presented in Chapter 2 finds that the exothermic profile can indeed be controlled in this manner and that composite parts fabricated using this technique have properties equal to those of parts fabricated with a resin starting with a high molecular weight. Secondly, it is hypothesized that the PMMA pre-dissolved polymer in these resin systems can be replaced with PLA. A blending study presented in Chapter 3 of PLA and PMMA concludes that the polymers are miscible and mechanical properties increase with the addition of glass fiber (the ternary system being a hitherto undocumented material system). Subsequently, Chapter 4 presents data of the solution properties of PLA dissolved in MMA with correlations that can be used to predict the viscosity of the resin system. The conclusion of the PLA studies is that this is a viable resin system for composite fabrication. Next, it is hypothesized that thermoplastic composites can enable recycling via dissolution. The conclusion of a recycling study presented in Chapter 5 is that the feasibility of this technique is contingent on creating value
9
in the recovered glass fiber. Lastly, it is hypothesized that methacrylate composites will have comparable properties to thermosetting composites since these structures are dominated by the properties of the fibers. Preliminary monotonic testing shows that the mechanical properties of the composites are invariant to the resin system used for fabrication.
10
CHAPTER 2: INFUSIBLE THERMOPLASTIC RESINS: TAILORING OF CHEMORHEOLOGICAL PROPERTIES
A paper submitted to Composites Science and Technology
Dylan S. Cousins1,2, Jackson Howell2, Yasuhito Suzuki2, Joseph R. Samaniuk2, Aaron P. Stebner3 and John R. Dorgan41
2.1 Abstract
Most thermoplastic composites are prepreg tapes or other thermally processable solid forms. However, infusible liquid resins that polymerize into a thermoplastic are desirable for many applications. Similar to unsaturated and vinyl ester thermosetting systems, infusible thermoplastic systems consist of polymers dissolved in a reactive monomer making viscosity control of the resin critical for producing high quality parts. Variation of the concentration and molecular weight of the dissolved polymer allows precise control of the viscosity which in turn controls the time at which peak exotherm is reached, the maximum temperature for a given part thickness, and total cure time. Therefore, it is desirable to develop predictive models for the viscosity dependence on molecular weight, polymer concentration, shear rate, and temperature. Extensive viscosity data for poly(methyl methacrylate) (PMMA) dissolved in methyl methacrylate (MMA) are obtained as a function of temperature and shear rate. These data are fit to the Andrade-Eyring temperature and Carreau-Yasuda shear rate models. The temperature dependent data are collapsed onto a master curve of specific viscosity, 𝜂𝑠𝑝, as a function of the product of concentration and intrinsic viscosity, 𝑐[𝜂]. Additionally, parallel plate rheometry is used to measure viscosity and dynamic moduli
1 Primary author and researcher
2Chemical and Biological Engineering, Colorado School of Mines, 1500 Illinois Street, Golden, CO 80401, USA 3Mechanical Engineering, Colorado School of Mines, 1500 Illinois Street, Golden, CO 80401, USA
4Department of Chemical Engineering and Materials Science, Michigan State University, 428 South Shaw Lane,
11
during cure. These cure profiles are collapsed onto a master curve. Two fiberglass panels are fabricated and tested; the first is fabricated with a lower molecular weight (Mw~30 kg/mol) PMMA dissolved in MMA and the second is fabricated using a resin with higher molecular weight (Mw~500 kg/mol). Mechanical properties are indistinguishable but the lower molecular weight panel cures in as little as one-third of the time the high molecular weight panel requires. Accordingly, it is demonstrated that the viscosity of the infusing resin can be optimized for manufacturing without adversely affecting final physical properties.
2.2 Introduction
Bulk free radical polymerization has been studied extensively since its discovery in the early 1930s.25,26 During the past few decades, substantial effort has been devoted to the development of mathematical models of free radical polymerization kinetics. The important kinetic rate coefficients for free radical polymerization include polymerization, kp, disproportionation, kd, and termination kt. Observed values of reaction rates are influenced by the complex phenomena of cage 27, gel 20,28, and glass 29 effects. These effects are caused by diffusional limitations of various reactive species as the viscosity of the mixture increases with increasing conversion of monomer to polymer. The complications presented by the coupled reaction-diffusion phenomena make mathematical modeling of the relevant phenomena very challenging. Despite the challenges, the kinetics of bulk free radical polymerizations and resulting molecular weight distributions are the subject of numerous studies and modeling efforts.30-40 Capturing the observed reaction rate is sometimes achieved via adjustable parameters.21 Typically, the initiation of free radical polymerization is carried out by thermal decomposition of peroxide or azo initiators. Alternatively, aromatic tertiary amines can be used in conjunction with benzoyl peroxide (BPO) at room temperature to initiate free radical polymerizations.41 This initiator system allows polymerization initiation at lower temperatures than are required for azo initiators. The
12
resulting temporal viscosity and temperature profiles are of primary interest in designing manufacturing methods. Recently, this co-initiator system for polymerization of MMA has been described and modeled with the use of a commercial kinetics simulation software package.42
The rheology of polymer solutions is also well studied.2 PMMA dissolved in its monomer was investigated by Stickler et. al. who tabulated solution viscosities as a function of concentration and molecular weight for their own and literature data.26,43-45 These authors generate a correlation of the specific viscosity, ηsp, as a function of the polymer concentration times the intrinsic viscosity, c[η]. Such a viscosity correlation is particularly useful – because the intrinsic viscosity is a function of molecular weight, the concentration needed to obtain a given viscosity for any given average molecular weight can be calculated. This viscosity correlation also provides a link to the kinetic models that can predict conversion. Therefore, chemorheological (or rheokinetic) data are needed to determine model parameters so that the models can be used in the future for predictive purposes. Chemorheological studies of reactive polymeric systems have a long history with many efforts focusing on the cure of epoxy systems.46 Gupta and coworkers present model equations for the bulk polymerization of MMA in semi-batch reactors using AIBN as the initiator.47 This model is used in subsequent studies which measured and modeled the viscosity of the reacting system; however, the cup-and-bob rheometer used was limited to a maximum viscosity of 4 × 10⁵Pa∙s.48,49 Here, room temperature cure kinetics for the BPO-amine initiating system are studied in a rheometer with a much greater dynamic range than these earlier studies - the dynamic storage modulus is measured over eleven orders of magnitude.
The present study brings new and literature data together in the form of parameterized models to serve the growing interest in using infusible thermoplastic resins.16,22,50 Thermoplastic composites have several attractive features – they can be thermally welded51 and are inherently
13
more recyclable than their thermosetting counterparts.52 However, viscosity control is critical for proper wet-out of the fibers during vacuum assisted resin transfer molding (VARTM). If the solution is too fluid, the part will contain voids due to jetting but if the resin is too viscous there may be poor wetting and impregnation of the fibers or the part may not fill properly due to excessive pressure drop requirements. Additionally, if the exothermic polymerization is not adequately controlled, the temperature rise can be significant enough to cause the monomer to boil.22 This is especially problematic in fabrication of thick composite parts where the surface area to volume ratio is not high enough to dissipate heat generated from the reaction quickly enough to prevent boiling.
In this study PMMA in MMA is used to demonstrate how a complete description of solution viscosity is valuable for designing resin systems suitable for infusion processes. Steady shear viscosity data are generated to verify and improve the ηsp vs. c[η] master curve.26 Importantly,
the shear rate dependence of PMMA in MMA solutions is characterized. Chemorheological data provide the Trommsdorff effect onset times as a function of initiator concentration and show marked dependence on the molecular weight of the pre-dissolved polymer. This contrasts with a previous study that finds molecular weight is unimportant; the earlier work compared samples of varying molecular weight at constant mass concentration rather than at constant viscosity.35 Temporal measurements of the temperature profile of polymerizing systems also show a strong dependence on the molecular weight of the pre-dissolved polymer when comparing at constant initial viscosity. The final most significant finding is that the mechanical properties of composites fabricated by VARTM are insensitive to the molecular weight of the pre-dissolved polymer. Accordingly, excellent physical properties can be obtained at drastically reduced cycle times when the infusible systems are formulated on a sound scientific basis.
14
2.3 Experimental 2.3.1 Materials
MMA, N,N-dimethyl-p-toluidine (DMT) and benzoyl peroxide (BPO) in phthalates (Luperox® AFR40) were purchased from Sigma-Aldrich and used as-received. For calculation of reactant ratios, Luperox AFR40 is taken as 40 wt% BPO. PMMA was purchased from PolySciences, Inc. Table 2.1 summarizes gel permeation chromatography (Section 2.3.6) results for these PMMA samples and the corresponding sample identifications used throughout the study. Prior to dissolving PMMA, it was dried in a vacuum oven for 14 hours at 70 °C. Glass fiber rovings used for composite test panel fabrication were StarRov® 086-1200 from Johns Manville.
Table 2.1. Absolute molecular weights of PMMAs determined by gel permeation chromatography with light scattering detection.
Mw from GPC Mn from GPC Nomenclature used (kg/mol) (kg/mol) 33 18 30k 83 38 80k(a) 78 38 80k(b) 491 173 500k
2.3.2 Steady shear rheology
Solutions of PMMA in MMA were measured as a function of concentration, molecular weight, temperature, and shear rate using a 40 mm, 2° cone and plate geometry in a TA Instruments AR-G2 rheometer. A TA Instruments reservoir fixture was used to create a saturated atmosphere of inhibited monomer in order to prevent net evaporative losses from the specimen during the experiment. For each molecular weight of PMMA, shear rate sweeps were performed at 0, 20 and 40 °C. Shear rate dependent viscosities are reported only for those solutions that displayed shear thinning. Temperature sweeps were conducted at a shear rate in the zero-shear viscosity region determined for each solution at the lowest temperature of 0°C. Using the lowest temperature as the
15
basis ensures measurements were in the zero-shear viscosity region because the solution relaxation time decreases with increasing temperature and therefore, the shear rate for the onset of shear thinning increases with temperature. The results of the shear rate and temperature sweeps were fit to the Carreau-Yasuda and Andrade-Eyring equations, respectively, using the Generalized Reduced Gradient non-linear solver in Microsoft Excel.53,54
2.3.3 Exotherm measurement
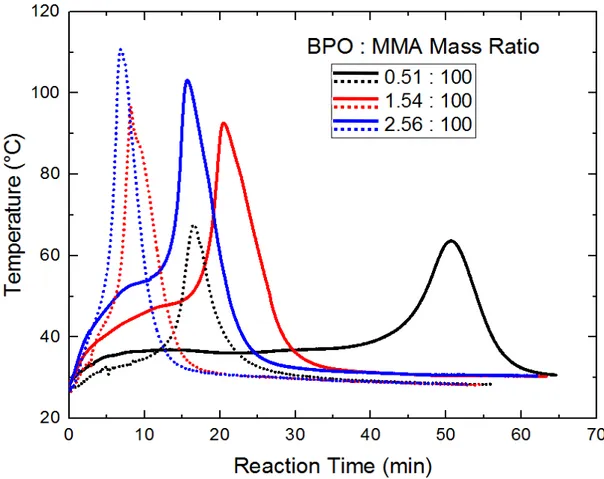
To investigate the effects of molecular weight on the temperature profile of the reacting system, two different solution formulations were made. Concentration was adjusted to achieve the same initial viscosity for different molecular weights of preformed PMMA dissolved in MMA. The targeted initial viscosity was 0.145 Pa∙s and the two different solution polymer compositions were 10.5 wt% of 500k and 30 wt% of 30k PMMA. Three different levels of initiator were tested
Figure 2.1. Experimental setup for exotherm measurements. The scintillation vials containing the reactants are placed in an oil bath. Thermocouples are fed through a hole in the lid which is then sealed with yellow vacuum tape.
16
for each of the two molecular weight solutions keeping the ratio of reactive species (MMA:BPO:DMT) constant. In each solution, the ratio of DMT to MMA was constant (0.5 moles DMT to 100 moles MMA) and only the concentration of BPO was varied.
Temperature profiles of reacting resin systems were measured as a function of time by initiating the free radical polymerization in a 20 mL scintillation vial. A hole was drilled in the vial’s cap to allow insertion of a thermocouple into the center of the sample. The experimental setup is depicted in Figure 2.1. The required amount of PMMA in MMA solution and Luperox AFR40 initiator were massed into the vial and capped. The vial was then positioned in a constantly stirred oil bath for thermal equilibration. Subsequently, the required volume of DMT co-initiator was added to the vial with a volumetric pipette. The contents were stirred for 30 seconds using a clean needle through the small hole in the cap. The needle was attached to an argon supply that acted as a purge to remove dissolved oxygen from the liquid. Then, the thermocouple was positioned through the hole in the cap to the center of the reacting fluid mass in the vial. The hole was sealed and the thermocouple held in place by a piece of vacuum tape. The temperature measured by the thermocouple was recorded using a National Instruments DAQ, which recorded the temperature at a frequency of 1 Hz. The experiment concluded when the temperature measured by the thermocouple returned to within 1 °C of the oil bath.
2.3.4 Chemorheology
PMMA solutions were prepared by dissolving PMMA in MMA by mixing in an Erlenmeyer flask with a stir bar at room temperature. Dissolution times ranged from 24 hours for low molecular weight polymer at to several days for high molecular weight polymer. DMT was added at a ratio of 0.5 moles of DMT per 100 moles of MMA and allowed to mix overnight. The experiment was carried out by weighing out roughly 5 grams of PMMA in MMA solution in a 20
17
mL scintillation vial and mixing this with the required amount of Luperox AFR40 (BPO). The initiated system was mixed with a small stir bar for one minute then sparged with argon using a clean steel needle for 30 s.
The rheometer was a TA Instruments AR-G2 with a 20 mm parallel plate geometry. Parallel plates are used so that the cure shrinkage can be accommodated by automatically moving the geometry head down as the experiment proceeds. The specimen was loaded into the rheometer geometry at room temperature using a polypropylene pipette. The temperature was then quickly (less than 30 s) brought to the set point at the start of the experiment. A monomer reservoir was then positioned over the geometry to prevent net evaporation of MMA from the specimen. The headspace between the specimen and the walls of the reservoir was then purged with argon and MMA was subsequently added to the reservoir. A light flow of argon was applied over the opening in the monomer reservoir to exclude air. This minimization of the specimen exposure to oxygen during the polymerization is done to avoid any effects on polymerization.55
An oscillatory shear protocol was implemented. For each step during the experiment, an oscillatory torque is applied. As the material polymerizes and becomes more viscous, a lower strain is needed for a given torque value. However, if the strain becomes too low, the signal to noise ratio is decreased; to avoid this problem the torque was increased when the strain dropped below 0.02%. This value was determined empirically by analysis of the displacement response for a given torque. Additionally, the normal force in the axial direction is set to automatically remain at zero. Therefore, as the specimen shrinks during polymerization and creates tension the geometry automatically moves the parallel plates together. The spacing between parallel plates (the gap) is measured as the polymerization proceeds and yields a measure of the linear shrinkage due to polymerization.56
18
After the cure measurement, the specimen was heated to 110 °C and removed as a single cylindrical piece and immediately massed. The mass of the initial specimen is estimated by calculating the volume between the geometry and the Peltier plate and multiplying by the known density of the initial polymer solution. The mass loss due to evaporation of the monomer during polymerization was less than 3% in all cases demonstrating the effectiveness of the reservoir geometry of the instrument.
2.3.5 Fabrication and mechanical testing of composite test panels
Two glass fiber reinforced PMMA panels were fabricated in a mold built by Composite Integration (Cornwall, UK). Both panels were fabricated with four plies of unidirectional Johns Manville StarRov® 086-1200 fiberglass in a [0-0-0-0] layup. One panel was fabricated with 30 wt% 30k PMMA dissolved in 70 wt% MMA while the other was made with 10.5 wt% 500k PMMA dissolved in 89.5 wt% MMA. These formulations were chosen to have the same initial viscosity of 0.145 Pa∙s. For each starting resin, 0.0067 g of DMT were added per g of MMA and the reaction was then initiated with 0.035 g of Luperox AFR 40 per g of MMA. The reactive resin was drawn into the mold cavity with 50 kPa vacuum below atmospheric pressure. Once the mold filled completely, the vacuum line was clamped and 200 kPa pressure was provided by compressed argon to the feed side. Panels were cured in-mold overnight at 22 °C before being removed. These panels are termed “30k Panel” and “500k Panel” to denote the weight averaged molecular weight of the pre-formed polymer in the resin. Specimens were cut from the panels using an Imer Combi 250VA water-cooled tile saw. Test coupons were tabbed with G10 epoxy tabs adhered to the specimens using Loctite 401. The specimens were tested in tension according to ISO 527 and in compression according to ASTM 6641 using an MTS Landmark 370.10 load frame. For the tension tests, strain was measured using an MTS 634.12F-24 extensometer and for compression
19
tests, strain was measured by digital image correlation (DIC) with a Basler scA2500 camera. The density of the test panels was determined by buoyancy in water of three specimens from various locations in each panel. From the density, the fiber volume fraction (FVF) may be calculated according to Eq. (2.1).
𝜙𝑓 = 𝜌𝜌𝑐− 𝜌𝑝 𝑓− 𝜌𝑝
(2.1) where 𝜙𝑓 is the FVF, 𝜌𝑐 is the measured density of the composite, 𝜌𝑝 is the density of the polymer taken to be 1.18 g/cm357, and 𝜌
𝑓 is the density of the glass fibers taken to be 2.54 g/cm3.58
2.3.6 Gel permeation chromatography
Gel permeation chromatography (GPC) was used to measure molecular weight distributions. The column was a 5 μm, 7.5 by 300 mm Agilent PolyPore, the UV detector was a SpectraSYSTEM RI-150, the multi angle light scattering was a Malvern Viscotek 270 Dual Detector, and OmniSolv HPLC grade tetrahydrofuran was used as the solvent. The specific refractive index increment used was taken from the literature to be dn/dc = 0.09 in all cases.57
2.4 Results and discussion 2.4.1 Steady shear rheology
2.4.1.1 Temperature dependence of viscosity
Figure 2.2 presents the viscosity of solutions of 80k(a) PMMA in MMA for various concentrations. Analogous plots for 30k and 500k PMMA are given in 0. These data are fit to the Andrade-Eyring relationship, Eq. (2.2), to parameterize the temperature dependence of viscosity.59,60
𝜂0 = 𝐾2𝑒( 𝐸𝜂
𝑅𝑇
20
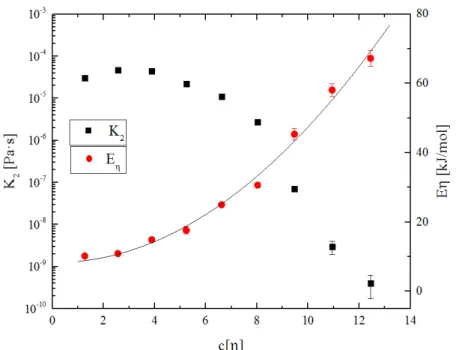
Here, 𝜂0 is the zero-shear viscosity, 𝐾2 is the pre-exponential factor, 𝑅 is the gas constant, and 𝐸𝜂 is the activation energy for viscous flow. Furthermore, Figure 2.3 shows the parameters of the Andrade-Eyring relation as a function of the intrinsic viscosity-normalized concentration, 𝑐[𝜂], for
80k(a) PMMA in MMA. Analogous plots for 30k and 500k PMMA are given in 0. The formulation and importance of 𝑐[𝜂] is described in detail in Section 2.4.3.3. The activation energy for viscous flow can be adequately described by the quadratic relation:
𝐸𝜂 = 𝑄0 + 𝑄1(𝑐[𝜂]) + 𝑄2(𝑐[𝜂])2 (2.3) where 𝑄1 and 𝑄2 are adjustable parameters and 𝑄0 = 8.37 is the flow activation for pure MMA.61 These parameters are presented inTable 2.2 for each type of PMMA. The values presented here show that 𝐸𝜂 increases more rapidly with 𝑐[𝜂] for the lower molecular weight polymer solutions; that is, lower molecular weight solutions show greater sensitivity to temperature changes.
Figure 2.2. Viscosity as a function of temperature for 80k(a) PMMA in MMA. Lines represent a fit to the Andrade-Eyring equation (Eq. (2.2)).
21
Table 2.2. Parameters for the predicting flow-activation energy according to Eq. (2.3).
Pre-dissolved polymer in solution 𝑸𝟎 (kJ/mol) 𝑸𝟏 (kJ/mol) 𝑸𝟐 (kJ/mol) 30k 8.37 -1.60 1.94 80k(a) 8.37 -0.11 0.40 500k 8.37 0.44 0.022
2.4.2 Shear rate dependence of viscosity
Figures 2.4 and 2.5 display the shear rate dependence of solutions of 80k(a) and 500k PMMA in MMA, respectively. Only data that exhibit shear thinning are presented. These data are fit to the shear-rate dependent Carreau-Yasuda viscosity model.53,62
𝜂(𝛾̇) = 𝜂0[1 + (𝜏𝜂𝛾̇)𝛿](𝑛−1)/𝛿 (2.4) Here 𝜂 is the shear viscosity, 𝛾̇ is the shear rate, 𝜂0 is the zero-shear viscosity, 𝜏𝜂 is the characteristic relaxation time, n is an adjustable parameter that characterizes the final slope of the Figure 2.3. Parameters for the Andrade-Eyring equation as a function of intrinsic viscosity normalized concentration, c[η], for 80k(a) PMMA in MMA. The line represents a fit to Eq. (2.3).
22
curve in the power-law region, and 𝛿 is a parameter that describes the breadth of the transition from Newtonian to power-law behavior, which decreases with increasing polydispersity.54 Table 2.3 shows the values of the parameters for the Carreau-Yasuda model for the solutions that displayed shear thinning. Viscosities for solutions that did not shear thin are obtained from the temperature sweep data. These data provide important processing reference points and show that the linear viscoelastic limit (defined by 𝜏𝜂−1) increases with increasing temperature.
2.4.3.3 Formulation of c[𝜼] caster curve
The viscosities of the PMMA in MMA solutions may be collapsed onto a single master curve by plotting the specific viscosity, 𝜂𝑠𝑝, as a function of the polymer concentration multiplied by the intrinsic viscosity, c[𝜂]. The reciprocal of the intrinsic viscosity is often used to approximate the overlap concentration, 𝑐∗.63 The overlap concentration represents the lowest concentration at which the polymer chains in a solution completely fill the volume; accordingly, it is the same as the internal concentration of a single polymer chain in dilute solution. The overlap concentration marks the transition from dilute to semi-dilute solutions and is important in polymer solution theories.2
The specific viscosity is defined by Eq. (2.5). 𝜂𝑠𝑝 = 𝜂 − 𝜂𝜂 𝑠𝑜𝑙
𝑠𝑜𝑙
(2.5)
where 𝜂𝑠𝑜𝑙 is the viscosity of the solvent. The intrinsic viscosity of the polymer in the solvent can be measured using dilute solution viscometry and described by the Mark-Houwink (MH) relationship of Eq. (2.6).
23
Figure 2.4. Shear rate sweeps for (a) 30 wt%, (b) 35 wt%, (c) 40 wt% and (d) 45 wt% 80k(a) PMMA in MMA. Lines represent a fit to the Carreau-Yasuda equation (Eq. (2.4)).
(c) (d)
(b) (a)
23
Table 2.3. Parameters of the Carreau-Yasuda equation (Eq. (2.4)) for solutions of PMMA in MMA for various concentrations and molecular weights. Concentration and MW of polymer solution 𝜼𝟎(Pa∙s) 𝝉𝜼 (s) 𝜹 𝒏 0 °C 20 °C 40 °C 0 °C 20 °C 40 °C 0 °C 20 °C 40 °C 0 °C 20 °C 40 °C 30 wt%, 80k(a) 4.00 0.911 0.473 0.00096 - - 1.99 - - 0.18 - - 35 wt%, 80k(a) 21.7 8.01 2.48 0.0028 0.0017 0.0006 1.21 1.34 1.73 0.22 0.16 0.18 40 wt%, 80k(a) 214 37.2 9.82 1.28 0.032 0.0011 1.69 0.94 0.97 0.87 0.79 0.21 45 wt%, 80k(a) 2088 320 108 6.16 0.144 0.068 1.21 2.78 2.66 0.73 0.24 0.15 15 wt%, 500k 3.78 2.24 1.66 0.046 0.031 0.0065 1.50 2.47 0.97 0.76 0.81 0.50 20 wt%, 500k 113 32.4 9.86 0.251 0.200 0.050 1.07 1.14 1.54 0.41 0.63 0.66 25 wt%, 500k 950 391 117 2.82 0.561 0.100 0.75 0.73 0.81 0.44 0.33 0.26
24
where 𝜂𝑠𝑜𝑙 is the viscosity of the solvent. The intrinsic viscosity of the polymer in the solvent can be measured using dilute solution viscometry and described by the Mark-Houwink (MH) relationship of Eq. (2.6).
Here, 𝐾 and 𝑎 are adjustable parameters and 𝑀𝜂 is the viscosity-averaged molecular weight. Assuming the molecular weight distribution is lognormal, 𝑀𝜂 can be estimated by Eq. (2.7).
𝑀𝜂 = 𝑀𝑤(1 + 𝑈)(1−𝑎)/2 (2.8)
where 𝑈, the non-uniformity, is defined by Eq. (2.8). 𝑈 =𝑀𝑀𝑤
𝑛 − 1 (2.9)
The intrinsic viscosity of PMMA in MMA has been tabulated and the Mark-Houwink parameters are 𝑎 = 0.66 and 𝐾 = 0.016 26; the a value implies MMA is a good solvent for PMMA. Figure 2.6 presents the data from this work with a master curve fit to a third-order polynomial of the form suggested by Stickler et al. given by Eq. (2.9).
log (𝜂𝑠𝑝) = 𝐶1(log(𝑐[𝜂]))3+ 𝐶2(log(𝑐[𝜂]))2+ 𝐶3(log(𝑐[𝜂])) + 𝐶4 (2.10)
The constants for PMMA in MMA are C1 = 1.17820, C2 = 1.7865, C3 = 0.8759, and C4 = 0.3136.
Therefore, if the molecular weight and concentration of the PMMA dissolved in MMA are known, the viscosity of the solution can be calculated using Eqs. (2.6), (2.9) and (2.5).
2.4.4 Exotherm measurements
Figure 2.7 presents the temperature profiles of reacting PMMA in MMA systems for solutions of 30k and 500k PMMA in MMA with various concentrations of initiator. The drastic temperature rise is due to the onset of the Trommsdorff effect.20 The peak temperature also
25
increases with increasing initiator concentration, which is expected because a greater initiator concentration increases the polymerization rate. However, the vast majority of the reactive groups are from the monomer, MMA. Therefore, the total heat released depends on the amount of pre-dissolved polymer; higher initiator concentrations increase polymerization rate and thus cause the heat to be released more quickly. Heat transfer to the bath is slower than the rate of heat generation leading to the observed temperature increases.
The solutions with lower molecular weight pre-formed polymer (30k) display the exothermic onset sooner than those with the high molecular weight pre-formed polymer (500k) despite having the same initial viscosity of 0.145 Pa∙s. The solution with 10.5 wt% 500k pre-dissolved PMMA takes longer to reach the onset of the Trommsdorff effect because there is more monomer in the system compared to the 30 wt% 30k PMMA system. Therefore, it takes longer to reach the same level of conversion of monomer to polymer; for the low MW system the conversion starts at 30 wt% but for the high MW system it begins at 10.5 wt%.
The cycle time for making a composite part can be reduced through proper resin formulation. As shown in Figure 2.7, using the low molecular weight polymer solution gives a cycle time about one-half as long as the high molecular weight solution for the 3.8:100 (BPO:MMA) ratio. Judicious, science-based formulation provides an opportunity to drastically increase productivity by tuning the molecular weight and concentration of the pre-dissolved polymer in the infusible resin. The peak exotherm temperature can be problematic because the atmospheric boiling point of MMA is 100 °C; under VARTM conditions it is even lower. If boiling occurs during composite fabrication, it creates voids which will lead to compromised mechanical properties. Combined manipulation of the molecular weight and concentration of the pre-dissolved
26
Figure 2.5. Shear rate sweeps for (a) 15 wt%, (b) 20 wt% and (c) 25 wt% 500k PMMA in MMA. Lines represent a fit to the Carreau-Yasuda equation (Eq. (2.4)).
(a)
(b)
27
polymer represents an effective method by which the peak exotherm temperature can be controlled without compromising cycle time by decreasing the initiator concentration.
2.4.5 Chemorheological experiments
The primary objective of the chemorheological experiments is to characterize the effects of varying the concentration and molecular weight of the pre-dissolved polymer on the temporal viscosity profile. The viscosity profile is modeled so that predictions of resin working time and thus available infusion times can be made. Figure 2.8 shows the cure profiles of 30k, 80k(b), and 500k PMMA solutions for various levels of BPO initiator. Figure 2.9 displays the same data, but arranged so that the initiator concentration is the same for each plot while the molecular weight of pre-dissolved polymer is varied. Chemorheological experiments are consistent with the exotherm Figure 2.6. Master curve of PMMA in MMA fit to a third order polynomial according to Eq. (2.9) with constant values C1 = 1.17820, C2 = 1.7865, C3 = 0.8759, and C4 = 0.3136.