Aerosol Characteristics at
Macquarie Island, Tasmania, during ACE-l
Fred
J.
Brechtel, Sonia 11. Kreidenweis, Lynn M. McInnes* and Hilton Swan+
Department of Atmospheric Science
Colorado State University, Fort Collins, CO 80523
*NOAA Climate Monitoring and Diagnostics Laboratory, Boulder, CO 80303
+
Australian Government Analytical Laboratories, PO Box 385, Pymble, NSW, 2073, Australia
6 May 1997
Funding Agencies: Office of Naval Research under grant number
#N00014-93-1-0420 POOOO, and Environmental Protection Agency under
Graduate Student Fellowship number #U-914726-01-0.
ABSTRACT
During the Aerosol Characterization Experiment 1 (ACE-I) continuous measurements were made of the particle number size distribution (between 18 and 540 nm diameter
(D
p )) and total particlenumber concentration
(D
p >3 nm andD
p >12 nm) on Macquarie Island, Tasmania (54°30'S, 158°57'E, 7 m ASL). In addition, information on the in-situ particle composition was inferred from both volatility measurements (at 50°C, 100°C, 150°C and 300°C) and analytical electron microscopy for particles between 70 and 1000 nm. Sampled air masses were separated into clean marine and those influenced by Tasmania or Antarctica. Observations were compared to those from a southern hemisphere mid-latitude site (Cape Grim) and to sites on the Antarctic continent.It was found that the average total number concentration observed during clean marine conditions, 675 cm-3, was about 21% higher than values observed at Cape Grim during ACE-I, and was similar to the high end ofthe historical range of number concentrations reported by Gras (1995) for Cape Grim during the same time of year. During both clean marine and influenced conditions, the Aitken and accumulation modes dominate the number size distribution, with a young Aitken mode observed less often. The number size distribution exhibited two and three modes 75%, and 25% of the time, respectively, during clean marine conditions, more consistent with previous observations at Cape Grim than with those in coastal Antarctica. The typical bimodal number distribution at Macquarie Island exhibited average modal diameters of 33 and 113 nm during clean marine conditions corresponding to the smaller Aitken mode and larger accumulation mode, respectively. The 50 to 70 nm diameter range corresponds to the minimum in the bimodal size distribution at Macquarie Island, except for continentally influenced periods when the size distribution exhibits an Aitken mode near 50 nm and an accumulation mode near 128 nm. The young Aitken mode appeared most often during or immediately after periods of precipitation associated with both warm and cold fronts, when the Aitken and accumulation mode number concentrations were depleted. Evidence for possible cloud processing of aerosol was found during two Antarctic influenced periods. Results from individual particle analysis indicate that sea salt and sulfate containing particles dominate the number concentration of particles down to 70 nm in diameter, with a small contribution from mineral and carbonaceous (non-soot) particles. Sea salt particles made up most of the number concentration above 200 nm (51 to 93% by number), with a smaller fraction between 70 and 200 nm (5 to 61%) for the periods examined. Sulfate aerosol was found primarily in the accumulation mode, comprising between 24 and 47% of the number concentration of this mode. Sulfate aerosol represented at most 20% of the number concentration for particle sizes greater than 200 nm. Results from seven volatility studies suggest that a majority of particles were as volatile as sulfuric acid or that Young Aitken and Aitken mode particles were extremely volatile, demonstrated by their evaporation at temperatures below 150°C.
INTRODUCTION
Observations of the aerosol size distribution, total concentration, and chemical composition in remote marine areas are required to construct budgets of chemical species and to help validate the aerosol input parameters used in global climate models. The processes that influence the aerosol physical and chemical properties must be elucidated so that they also may be properly incorporated into models. Very few observations exist of the submicrometer size distribution over the Southern Ocean, yet this area represents a significant portion of the earth's ocean.
Previous studies in the region have generally been conducted from shipboard platforms (Hoppel et al., 1990j Pszenny et al., 1989i Bates et al., 1992j Koga et al., 1991), aircraft platforms (Berresheim et al., 1990), from coastal Antarctic sites (Gras and Adriaansen, 1985j Gras, 1993j Ito, 1985j Lehmann and Jaenicke, 1991), or at Cape Grim (Ayers et al., 1986j Ayers et al., 1991j Gras,
1995). Given that shipboard and aircraft platforms are limited in the amount of time data may be acquired at one location, and that Cape Grim is over 3000 km away from coastal Antarctica, our observations of aerosol characteristics at a location between Cape Grim and Antarctica, particularly of the sub-540 nm size distribution using differential mobility techniques, represent a new and unique dataset.
The Aerosol Characterization Experiment (ACE-1) was conducted between November 15 and December 15, 1995 (DOY 319-345) in the Southern Ocean south of the Australian continent. An overview of the ACE-1 project is provided by Bates et al. (this issue).
In
this paper, observations at Macquarie Island (54°30'S, 158°57'E, 7 m ASL) during ACE-1 are presented and examined with respect to air mass category. Specifically, the geometric mean diameters, number concentrations and standard deviations of the dominant modes of the sub-540 nm particle size distribution at Macquarie Island have been determined for both clean marine and continentally influenced conditions and for a variety of synoptic weather situations. Characteristics of these populations were compared to examine whether influenced air masses were associated with significantly different aerosol properties than clean marine air masses and to reveal the role of meteorological conditions in determining the observed aerosol variability. The observed aerosol properties at Macquarie Island are compared to results from historical, similar studies in the region to evaluate the extent to which the observations made during ACE-1 are representative of the region in a climatological sense.METHODS
Aerosol microphysical and chemical measurements including particle number concentration
(D
p>
3 nm and Dp>
12 nm), number size distribution, particle volatility and individual particlecomposition were made at Macquarie Island, Tasmania between November 21 and December 12, 1995 as part of ACE-l.
In
this section, we describe the sampling site and the instruments used in the study.Sampling Site
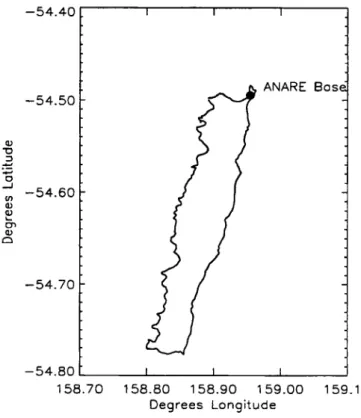
Macquarie Island is an ideal location for sampling remote marine aerosol as it is located approximately half-way (1500 km) between the Australian and Antarctic continents, far from continental influences (Bates et al., this issue). Figure 1 is a map of the island. The island is
a protected nature preserve, and is uninhabited except for 40 members of the Australian Antarctic Research Expedition staff. Particle monitoring equipment was located in the clean air laboratory,
-54.40r - - - - , - - - , - - - - , - - - , -54.50 Q)
"
.3:.g
~ -54.60 Q) ~ 0'> Q) Cl -54.70 ANARE 80S 159.10 158.80 158.90 159.00 Degrees Longitude - 54. 80 '--_ _----'- --'- ...L.-_ _---J 158.70Figure 1: Map of Macquarie Island and location of ANARE base
where in-situ measurements of particle number concentration have been made since 1985 by the Commonwealth Science and Industrial Research Organization (CSIRO) using a Pollack counter. The predominant wind directions at the site are south-westerly to north-westerly, which ensures that contamination from the research base is kept to a minimum.
Equipment
A schematic of the sampling system is shown in Figure 2. Aerosol inlets were 8 m long, 1.1 cm inside diameter electrically conductive plastic tubing with flow rates of 20 liter min-I. Separate identical inlets were used for the total concentration measurements and the size distribution measurements. A Reynolds number of 2550 was chosen in order to limit diffusional losses of particles to the tube wall. Losses of 10 nm particles are estimated to be 10% and for 18 nm particles 5%.
One minute averages of particle number concentration
(D
p >12 nm) were acquired with a continuous flow condensation particle counter (CPC, Model 3010, TSI Inc., Minn., MN) and data acquisition system. One minute averages of total particle number concentration(Dp
>3 nm) were measured with a TSI Model 3025 Ultrafine Condensation Particle Counter (UCPC). CPC and UCPC data are presented as fifteen minute averages to better match the time resolution of the size distribution data.DMA
monodisperse aerosolCPC
e--f----=---__
~ excess air . .f-.----1~--{v
~---, I I I I,
I I I I I,
,
sheath air Drier c)-I--..
~~--t....
~---Ir--Q
CPC
Volatility
Heater
I ~---4 I ' : Thermocouple I Temperature Controller polydisperse aerosolUCPC
CPC
Figure 2: Schematic ofsampling system. Solid lines designate air sample flow, dashed lines designate computer/electrical control connections. 'c' designates compressed air source and 'v' designates vacuum pump:
fifteen minutes, except during volatility/chemistry studies and during system down time to verify correct operation and flow rates. A diffusion dryer (Permapure Inc., NJ) was used to decrease the relative humidity (RH) of the sample flow supplied to the DMPS system to below 30%. The DMPS system consists of a Differential Mobility Analyzer (DMA, TSI Model 3071) and a Model 3010 CPC. The DMPS system was operated with sample and monodisperse aerosol flow rates of 0.5 liter min- I and sheath and excess air flow rates of 5.0 liter min-I. The sheath flows for both the Permapure dryer and the DMA were supplied by a compressed air system followed by a molecular sieve drying unit, and were maintained at relative humidities below 30%. The size distribution data have been corrected for diffusional losses in the main sample line (Hinds, 1993)
and in the diffusion dryer (Dick et al., 1995). The maximum value of the applied correction for the aforementioned processes was 9% for particle sizes near 20 nm. A correction has also been applied for CPC detection efficiency (Wiedensohler et al., in press). Taken together, all aforementioned factors represented a 13% correction for 20 nm diameter particles.
Aerosol volatility and elemental composition was observed on seven separate occasions over the study period. A schematic of the volatility system used for this study is shown in Figure 2. Volatility measurements can distinguish between acidic and neutralized sulfate particles by the temperature at which the particles evaporate (Clarke et al., 1991). Volatility studies were conducted at temperatures of 50°C to evaporate particle-bound water, lOO°C and 150°C to evaporate sulfuric
acid and check for the presence of other highly volatile compounds (Covert et al., 1988), and 300°C to completely evaporate ammonium bisulfate and ammonium sulfate leaving the refractory (soil, sea salt, soot and semi-volatile organics) component behind. The number concentration of particles after heating was recorded with a CPC for each temperature. Simultaneously, the total in-situ unheated number concentration was recorded with a second CPC. The two CPC's agree within a few percent when sampling the same air stream. Each volatility study was performed over a period of one to two hours. It should be noted that other highly volatile species, for example organics and nitrates, can obscure the results from volatility studies due to their similar volatile response compared to sulfates. Previous studies in the region (Bigg et al., 1984i Ayers et al.,
1986) indicate that sea salt and sulfate aerosol dominates the particle composition in the region. This expectation was tested using composition data from the individual particle analysis, described below.
During volatility studies, the 2 liter min-1 flow rate through the heater was divided equally between the CPC and a low pressure cascade impactor (PIXE Corp. International, Tallahassee FL). The low pressure impactor was used to collect ambient particle samples and non-volatile particle samples for individual particle analysis, depositing them onto a 3 mm specimen grid (400 mesh copper grid, formvar stabilized with carbon, Ernest M. Fullam Inc., Latham, NY) seated on the last stage of the impactor. Collection times were 1 to 5 minutes at 1 liter min-1 with a 50% collection efficiency for particles of 60 nm. Samples before Dec. 6th were obtained with a pre-impactor stage installed having a 50% collection efficiency for 120 nm particles. After Dec. 6th the preimpactor was removed. The subset of particles non-volatile at each temperature was collected over longer times because of low number concentrations.
Elemental compositions, sizes and morphologies of aerosol particles were determined by microanalytical techniques using a transmission electron microscope (JEM-200CX, JEOL USA, Inc., Peabody, MA) and high-angle energy dispersive X-ray detector (KEVEX Instruments, Valencia, CA) for particle sizes between 70 and 3000 nm (McInnes et al., 1997). Therefore, results on particle composition are reported for the accumulation and sea salt modes only. Monodisperse particles of ammonium sulfate, artificial sea salt, and potassium sulfate, accurately sized with a DMA, served as calibration particles for size and detector sensitivity. The detector used for most results was sensitive to elements with atomic numbers greater than oxygen, and elements in particles greater than 80 nm were detected significantly above instrument detection limits. We made no attempt to accurately determine the size of carbonaceous particles due to their irregularity. Instead we represent the size of these particles as the average of the longest and shortest observed dimensions. The errors introduced are small considering such particles represented less than 1% of the total number concentration. Carbon was detected using a more sensitive X-ray detector for a subset of grid samples, and greater than 30% of the particle mass had to consist of carbon in order to detect a significant carbon signal above background. The impaction center of the grid was located at low magnification, and particles at different radial positions, corresponding to different impaction sizes, were chosen for analysis (McInnes et al., 1997). Typically, 5 to 7 regions (100 x 100 p.m 2, 400 mesh grids) were selected for particle analysis. 20 to 50 particles were randomly
analyzed for each sample, giving Poisson counting uncertainties of 15-22%. Elemental spectra were acquired for 60 live seconds with a minimum count rate of 1000 counts S-l. No significant change
in the elemental count rate occurred during the analysis, implying no losses after initial vacuum desiccation and beam-induced evaporation. Particles were classified into common aerosol types based on their elemental spectra and morphology.
Two gaseous species, dimethylsulfide (DMS) and radon (Rn), were measured. DMS is considered to be an important precursor to particulate matter over the Southern Ocean (Bigg et al., 1984). DMS concentrations were observed at Macquarie Island using a pulsed flame ionization photo detector and cryogenic trapping technique similar to that outlined in Ivey and Swan (1995). Radon was used as an indicator of continental air masses. Radon concentrations were observed by monitoring its radioactive decay in a large holding tank over a 45 minute period using the method outlined in Whittlestone et al. (1994). Uncertainties in the DMS and radon data are considered to be less than 15% and 20%, respectively.
Meteorological data, including wind speed and direction, relative humidity, ambient pressure, and temperature, were recorded every ten minutes at the site by the Australian Bureau of Meteorology (ABoM). Mean sea level, 500 mb and 850 mb synoptic scale pressure-height analyses were performed twice daily by the ABoM. Four vertical soundings were taken at the island each day during the ACE-l study period and time-height contour maps were constructed from the vertical soundings for specific humidity, potential temperature, wind speed and wind direction. Time periods were classified by synoptic weather category by analyzing the aforementioned meteorological parameter timelines and one-day animations of hourly visible and infrared GMS-5 satellite images of the ACE-l study region. Two five day isentropic back trajectories per day were used to distinguish between air mass source regions and to corroborate results from the meteorological analysis. Back trajectories were calculated using the NOAA HYSPLIT 3.2 code using the ABoM GASP model with approximately 5° horizontal resolution and 18 levels.
Experimental Uncertainties
Standard deviations of particle concentrations measured simultaneously by several similar model CPC's have been reported by Wiedensohier et al. (in press). For the UCPC, standard deviations of less than a few percent (n=6) were reported for particle sizes greater than 5 nm, while the standard deviation increased from 10% to 27% as particle size decreased from 4 nm to 2.5 nm. For the Model 3010 CPC used in this study for size distribution observations, the standard deviation of concentration measurements for Dp
>
20 nm was less than a percent (n=10), andincreased to about 5% for particle sizes near the 50% detection efficiency diameter of 12 nm. Total number concentrations observed by the CPC have been compared to the total integrated number of the DMPS size distribution (18-540 nm) as a quality check and the average ratio of CPC and DMPS number concentrations was found to be 1.1 with a coefficient of variation of 14% (n=1318), indicating good agreement between these parameters.
Uncertainty in the size distributions results from low charging efficiency of the aerosol sampled by the DMA, diffusional losses within the DMA and sample inlet tubing, the DMA transfer function, and reduced counting efficiency of the CPC for particles with diameters less than 20 nm. The DMA transfer function accounts for diffusional losses within the DMA and that the CPC only counts a fraction of the particles actually entering the DMA. Both the charging efficiency (Wiedensohier et al., 1988) and the DMA transfer function (Birmili et al., in press) are accounted for by applying theoretical and empirical corrections to the data.
ApPROACH
It is important to quantify the extent to which continental influences, both natural and anthropogenic, are realized in remote regions. Previous studies conducted in and around the
Southern Ocean and Antarctica have generally presented results corresponding to clean marine conditions associated with clean air masses. Therefore, the Macquarie Island dataset was divided into clean marine and continentally influenced periods. The fairly strong seasonal variability in aerosol properties in this region (Bigg et al., 1984,. Gras and Whittlestone, 1992,. Ito, 1985,. Lehmann and Jaenicke, 1991) requires that the comparisons with previous studies be made only
for studies conducted at the same time of year as ACE-1. Previous aerosol observations and general meteorological trends during clean marine conditions have been reported for Cape Grim
(Gras, 1995,. Ayers et al., 1991), Macquarie Island (Downey et al., 1990,. Gras and Whittlestone,
1992), along coastal Antarctica (Gras and Adriaansen, 1985,. Ito, 1978,. Lehmann and Jaenicke,
1991), and during shipboard research programs (Pszenny et al., 1989,. Hoppel and Frick, 1990).
The Macquarie Island dataset was divided into clean marine and continentally influenced air mass types. The influenced air masses were further subdivided into Tasmania/Australia influenced, Antarctica influenced, and locally or island influenced. The criteria developed here for classifying air masses follow from Downey et al. (1990)and Gras and Whittlestone (1992). Influenced conditions
are defined as having (a) radon concentrations greater than 90 mBq m-3 for at least a two hour
period and a peak radon concentration during the time period of at least 110 mBq m-3, or (b) 100 m initial height five day back trajectories passing over or nearby the Australian or Antarctic continents. Local wind speeds greater than 3.5 m S-l and local wind directions between 2250 and
3600 were required for clean marine conditions. Low wind speeds are believed to create situations where eddies formed in the wake of the island could transport local pollution to the sampling location (Gras and Whittlestone, 1992). Results from locally influenced periods are not presented
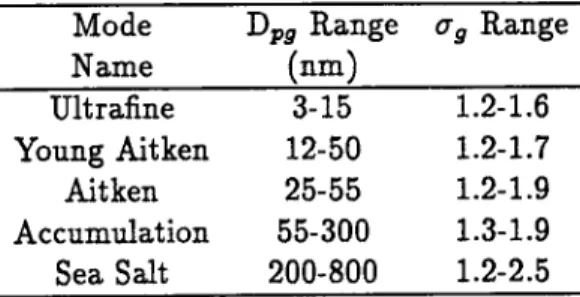
here. Any time period not continenta.lly or locally influenced was classified as clean marine. To examine trends in size distribution mode parameters for clean marine and influenced conditions, each size distribution was fitted using a lognormal fitting routine providing the geometric mean diameter, mode number concentration, and mode standard deviation for up to five modes. The definitions of these modes are given in Table 1.
Table 1. Summary of ACE-1 size distribution mode parameter definitions used to define the ultrafine, Young Aitken, Aitken, accumulation and sea salt modes.
Mode Name Ultrafine Young Aitken Aitken Accumulation Sea Salt Dpg Range (nm) 3-15 12-50 25-55 55-300 200-800 (7g Range 1.2-1.6 1.2-1.7 1.2-1.9 1.3-1.9 1.2-2.5
Since size distribution data are only available between 18 and 540 nm, three modes in the size range 18 to 300 nm are explored here: the Young Aitken, Aitken and accumulation modes. Fits were only performed for particle sizes up to 300 nm, as data for sizes greater than 300 nm have greater uncertainty due to multiple charging effects and poorer counting statistics. Although the minimum size of our DMPS measurements was 18 nm, a Young Aitken mode could be fit to the data when at least 3 of the smallest size bins demonstrated an increasing concentration trend with decreasing size allowed a mode having a modal diameter less than 18 nm to be fit to the data.
The goodness of each fit was verified by plotting the log normal distribution calculated from fit data over the corresponding DMPS data. The average ratio of total fitted number concentration to actual integrated DMPS number concentration was 0.96 with a standard deviation of 0.08 for 1518 size distributions. Furthermore, several days of DMPS data were fit using a different fitting routine and results from the two fit programs agreed within 10%. Average mode parameters for different time periods were determined by fitting the average distribution from the period, and not by averaging individual fit parameters.
The particle elemental composition results have been divided based on particle size into the accumulation mode
(80<D
p <200 nm) and sea salt mode(D
p>
200 nm) in order to examine the relative contributions of sea salt and sulfate containing particles for these size ranges. As EM analysis cannot easily distinguish between an ammonium sulfate particle and an ammonium bisulfate particle, volatility studies were used to distinguish between sulfate containing particles with different degrees of neutralization. It is possible that if coarse mode particles are internally mixed with volatile and non-volatile material, they may shrink at elevated temperatures and could be counted as accumulation mode particles during EM analysis. It is also possible that accumulation mode particles could shrink to sizes below the EM detection limit or the 50% collection efficiency diameter of the impactor stage holding the EM grid. Therefore, the presence of non-volatile particles at sizes less than 60 nm cannot be discerned by our method. Mixtures of sea salt and sulfate in the same particle were observed in the sea salt mode, however, their number concentration was sufficiently low compared to the accumulation mode that shrinkage would not be expected to influence the EM analyses of the elevated temperature accumulation mode samples. Furthermore, since sea salt was found to dominate the composition of particles with diameters greater than 200 nm, we do not expect shrinkage to significantly influence our results.Finally, temporal variations of aerosol characteristics within clean marine and influenced periods were examined. Linear regressions of a variety of aerosol parameters against time were performed at the 95% confidence level for clean marine periods (sample number=8) and for all periods (n=15). Time regression results are only reported for analyses producing significant
t
and F test parameters. Synoptic scale variations in air mass source region were identified and local meteorological data and satellite images were used to identify air mass changes on shorter time scales that were reflected in the aerosol, such as the passage of cold and warm surface fronts. Our estimates of the times of frontal passage have an uncertainty of around+/-
3 hours. The frontal zones are associated with increased cloud activity and transient mixing processes that can last between one-half hour (severe cold front) and one-half day (warm front). Therefore, our examination of the variability in particle properties with respect to frontal passages is not focused on precise correlations in time but more on the role of frontal systems toward establishing the air mass source region and the associated changes in observed aerosol characteristics at Macquarie Island.RESULTS AND DISCUSSION
Overview and Timelines of Observed Aerosol Properties
The ACE-1 study period on Macquarie Island can be divided into three periods, each six to eight days. Strong local precipitation marked the transition between each period. Five day back trajectories starting at an initial height of 100 m and corresponding to both clean marine and influenced conditions have been plotted in Figure 3 for the three major time periods during the ACE-1 intensive. Trajectories passing over Tasmania are clearly evident, as are trajectories
35 Ca e Gr·
~
45d
55 65~
...----. --.J "">-90 100 110 120 130 140 1501~
75 35~
45d
55 Macquarie Islan 65 80 90 100 110 120 130 140 150 75 35~
45d
...
55~'
Macquorie Islan 65 80 90 100 110 75Figure 3: Five day back trajectories during clean marine and influenced conditions during (a) period I, (b) period II, and (c) period III (courtesy of Dr. Steve Siems). Trajectories correspond to a 100 m initial height. Lines between solid dots represent one day of transport.
originating from Antarctica. None of the trajectories pass over the Australian continent. The initial period, Day of Year (DOY) 326 to 332, was dominated by high pressure systems located over the Tasman Sea and over New Zealand, and the passage of an occluded cyclone. The trajectories plotted in Figure 3a indicate a general southwesterly fetch during clean marine conditions for period one.
The second period, DOY 332 to 338, was characterized by trajectories (Figure 3b) significantly different than those from period one, and exhibit a general cyclonic curvature, associated with three large scale low pressure systems and increased storminess. The air mass source region shifted
to northwest of Macquarie Island, from the predominantly southwesterly fetch during period one. Satellite retrievals of sea surface temperature indicate a general warming of the ocean region west of Macquarie Island in the middle of period two and near the beginning of period three.
The final period, DOY 338 to 347, was characterized by two intensifying low pressure systems on a track located west and slightly south of Macquarie Island. During this last period, a general intensification of the zonal and meriodional flows in the region occurred, associated with the movement of the climatological summertime high pressure system situated off of the west coast of Australia to higher southern latitudes and the establishment of a high pressure system over the Tasman Sea, typical for this time of year (Schubert et ai., 1990). Period three trajectories are plotted in Figure 3c and exhibit a more westerly fetch compared to period two.
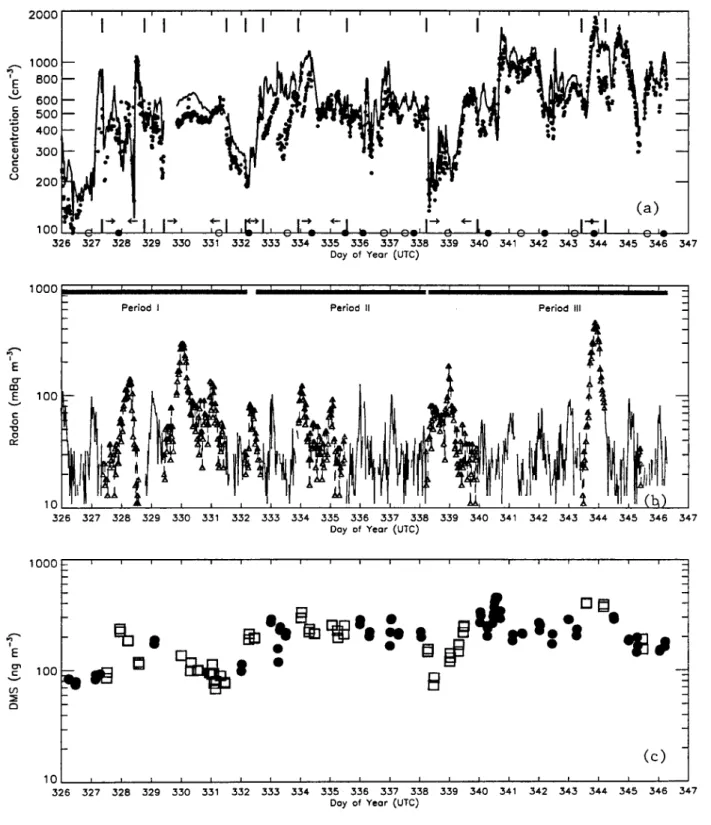
Timelines (UTC) of CPC particle number concentration, integrated number from the DMPS size distributions, radon, and DMS are presented in Figure 4. Number concentration data reflecting local contamination have been removed. Close agreement between the number concentrations> 12 and >3 nm (not shown) indicates the absence of high number concentrations of ultrafine particles. The minimum and maximum fifteen minute average number concentrations were 100 and 1800 em-3, respectively. The larger radon peaks associated with influenced conditions stand out in
Figure 4b on DaY 328, 330, 339, and 343. Periods categorized as influenced with less noticeable radon peaks (DaY 327, 332, 334, 338) are associated with trajectories passing close to Tasmania or with locally influenced conditions. DMS concentrations (Figure 4c) varied between 80 and 450 ng m-3 during ACE-1 with values increasing with time (r2=0.3, n=15). CPC (r2=0.8, n=8) and integrated concentrations from the DMPS (r2=0.64, n=8) during clean marine conditions were also found to increase with time.
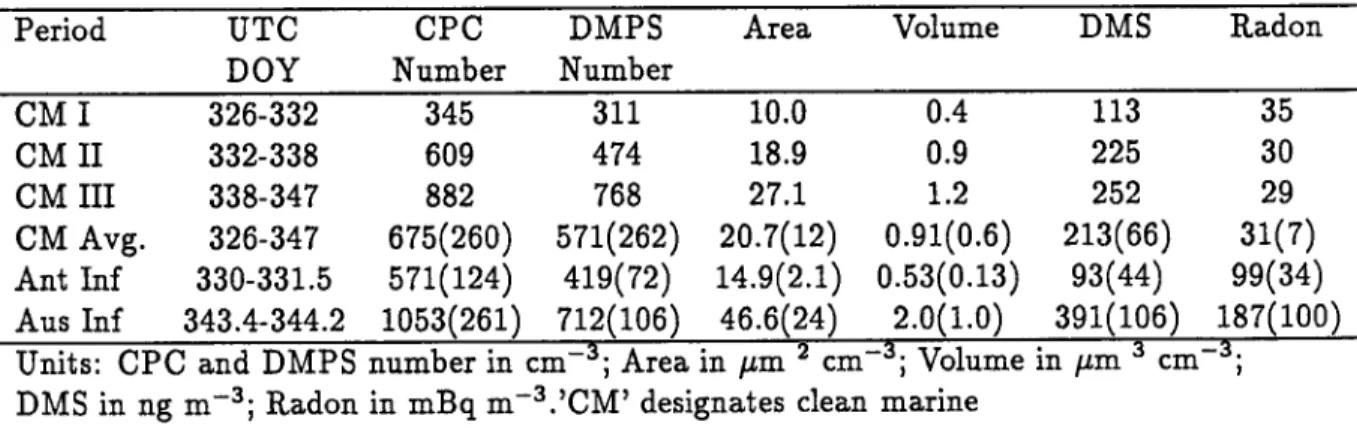
Over the 21 day study period, clean marine conditions were experienced 60% of the time over seven separate time periods. The clean marine average CPC number concentration, DMPS number, area and volume concentrations, and DMS and radon concentrations are listed in Table 2. Also shown in Table 2 are similar parameters during one Antarctic and one Australia influenced time period. The average number concentration determined from all clean marine periods taken together, 675 cm-3, was strongly influenced by higher concentrations toward the end of the study period. This increase was accompanied by a simultaneous increase in sub-540 nm particle surface area and volume.
Table 2. Summary of ACE-1 average aerosol physical properties, and DMS and radon concentrations at Macquarie Island during clean marine conditions and two continentally
influenced periods. Values in parentheses are standard deviations.
Period UTC CPC DMPS Area Volume DMS
DaY Number Number
CM I 326-332 345 311 10.0 0.4 113 CM II 332-338 609 474 18.9 0.9 225 CM
III
338-347 882 768 27.1 1.2 252 CM Avg. 326-347 675(260) 571(262) 20.7(12) 0.91(0.6) 213(66) Ant Inf 330-331.5 571(124) 419(72) 14.9(2.1) 0.53(0.13) 93(44) Aus Inf 343.4-344.2 1053(261) 712(106) 46.6(24) 2.0(1.0) 391(106) Units: CPC and DMPS number in em 3; Area in p.m 2 em 3; Volume in p.m3 em DMS in ng m-3j Radon in mBq m-3.'CM' designates clean marineRadon 35 30 29 31(7) 99(34) 187(100) 3.
,
2000
I I
I I
I
~ 1000.
M
.... I 800 E ~ 600 c: 500 .2 "0 400 .:::c: Q) 300 u c: 0 u 200 (a) 100....
.326 .327 .328 .329 .3.30 .3.31 .3.32 .3.3.3 .3.34 .3.35 .3.36 .3.37 .3.38 .3.39 .340 .341 .342 .34.3 .344 .345 .346 .347Day of Year (UTC)
1000
Period I Period II Period III
:>' I E CT CD E 100 ... c: 0 "0 0 oc 10
ij
.326 .327 .328 329 330 331 332 333 334 335 336 337 338 339 340 341 342 343 344 345 346 .347Day of Year (UTC)
1000r---.-....--.----.-....--.----.-....--r---.-....--r---r--...,....--r---r--...,....--...---.--...,....-~ :>' I E C" 100 c: ... Ul :::. Cl
•
..
•
(c) 10L...----I.._-'-_.L...----I.._-'-_.L...----I.._-'-_.L...----I.._-'-_.L...----I.._-'-_L...----I.._-'-_L...----I.._-'---J .326 327 .328 329 330 .331 332 333 3.34 3.35 336 337 338 339 340 341 342 343 344 345 .346 347Day of Year (UTC)
Figure 4: Timelines of (a) CPC (cm-3 ,solid line) and integrated number concentration from size
distributions (cm-3 ,filled dot), (b) radon (mBq m-3
), and (c) dimethylsu1:fide (ng m-3 ) for the
entire ACE-1 study period. Influenced conditions designated as times between vertical solid lines shown by arrows. Warm and cold frontal passages shown as open and closed dots along time axis.
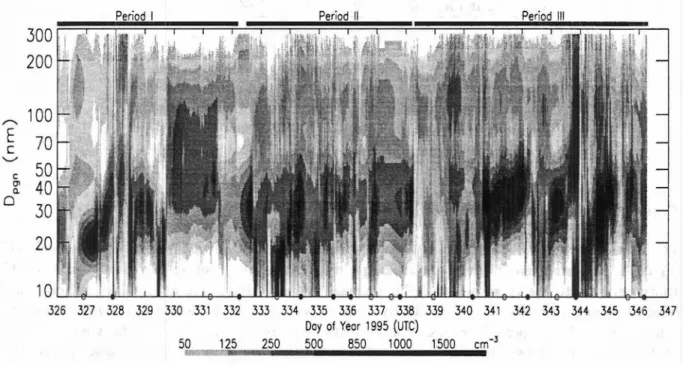
1525 size distributions, representing the entire study period, have been plotted in Figure 5. The plot is a two dimensional representation of a three dimensional surface defined by the number concentration in a size bin, normalized by the base10 logarithm ofthe size bin interval (dN/dlogD). The x-axis represents the 21 days ofthe study, the y-axis is the particle size, and the various contours represent isolines of dN / dlogD. Associated average Aitken and accumulation mode parameters have been listed in Table 3 for clean marine and continentally influenced conditions. Average Young Aitken mode parameters are not reported in Table 3 as this mode was observed in only 25% of the size distributions, and could not be fitted in the average distribution calculated for each period. When observed, the clean marine Young Aitken mode diameter was typically near 21 nm with a number concentration around 83 cm-3, as determined by averaging fit parameters from individual
distributions. Period III Period II Period I
300
200
"'"' 100
~
70
'--" c:50
g:
40
o
30
20
10L....o:..-''e'-...-'''-.L....L''-'---'-6---'-4-..lI..I...I-' 326 327 328 329 330 331 332 333 334 335 336 337 338 339 340 341 342 343 344 345 346 347Day ofYear ,995 (UTe)
50MM";cM'!;;;W;,,125 250 500 850 1000 1500 _cm-3
Figure 5: Timeline of sub-300 nm particle number size distribution for entire ACE-1 study period on Macquarie Island . Warm and cold frontal passages shown as open and closed dots along time axis.
The Aitken mode dominates the total sub-540 nm number concentration, typically accounting for 73% ofthe average total fitted number concentration, while the accumulation mode represents about 27% of the total fitted number concentration. The clean marine average Aitken and accumulation mode diameters were 33 and 113 nm, respectively, with coefficient of variation values ranging between 14% and 24%. The dominant Aitken mode between 30 and 40 nm is evident in Figure 5. The noticeable exceptions to this are DOY 330-332 and 338.2-340.5 (dominated by Antarctic air masses) and 343.6-344.5 (dominated by an Australian air mass). A second mode is less obvious, but present, between 100 and 120 nm. As will be discussed below, abrupt changes in total number concentration and in the size distribution shape, as seen in Figures 4 and 5, were often associated with frontal passages resulting in changes in back trajectories and air mass source region.
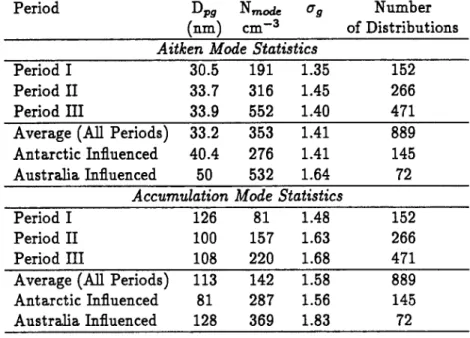
Table 3. Summary of ACE-1 average aerosol size distribution mode fit parameters at Macquarie Island during clean marine conditions and two continentally influenced periods.
Period Dpg Nmode {1g
(nm) cm-3
Aitken Mode Statistics
Number of Distributions
Period I 30.5 191 1.35
Period II 33.7 316 1.45
Period III 33.9 552 1.40
Average (All Periods) 33.2 353 1.41 Antarctic Influenced 40.4 276 1.41 Australia Influenced 50 532 1.64
Accumulation Mode Statistics
152 266 471 889 145 72 Period I Period II Period III
Average (All Periods) Antarctic Influenced Australia Influenced 126 81 1.48 100 157 1.63 108 220 1.68 113 142 1.58 81 287 1.56 128 369 1.83 152 266 471 889 145 72
Overview of Results From Different Periods
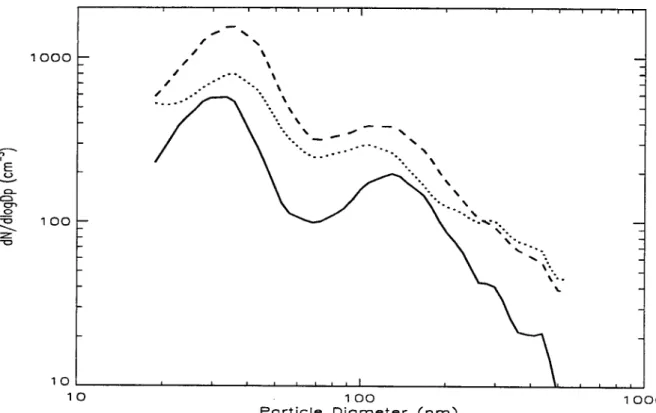
The average size distribution during clean marine conditions from each period has been plotted in Figure 6. The size distributions are strikingly different, substantiating our division of the ACE-1 study period into the three periods. The increase in both Aitken and accumulation mode number concentrations over the periods is clearly seen in the figure and the higher Young Aitken mode concentration during period two is evidenced by the increase in concentrations for sizes smaller than 21 nm in the period two size distribution. The noted increase in mode concentrations is consistent with the seasonal increase in number concentrations and demonstrates that this increase is due predominantly (79%) to an increase in Aitken mode number concentration. However an increase is also observed in accumulation mode size particles that account for 21% of the increase in total number concentrations from period two to period three. During period two, the less pronounced accumulation mode, with a smaller mean diameter, is associated with the higher precipitation frequency during that period. The coefficient of variation for the Aitken mode size was typically twice that found for the accumulation mode size, consistent with the closer proximity of sources of Aitken and Young Aitken mode compared to accumulation mode particles.
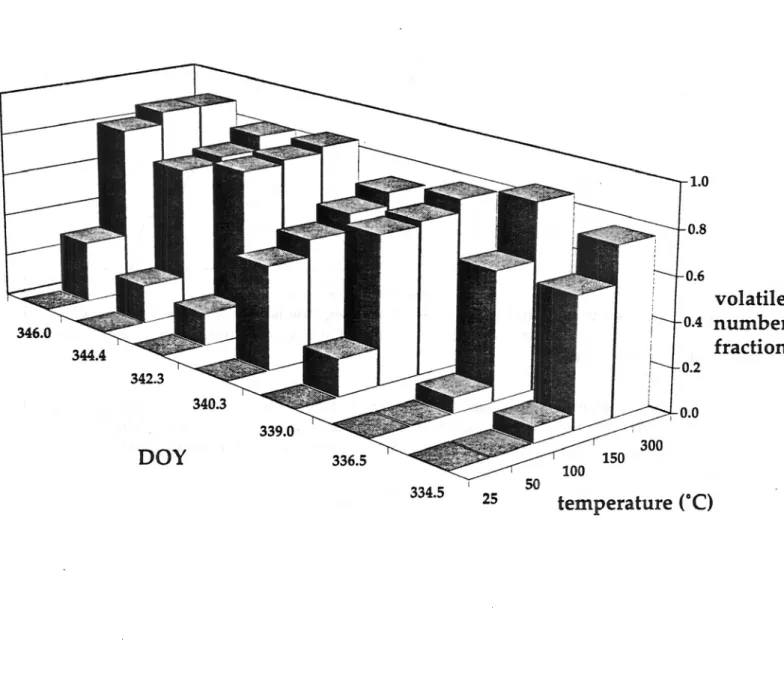
During periods two and three, higher concentrations of particles larger than 200 nm, consisting mainly of sea salt, are evident in Figure 6 and are associated with higher and similar average wind speeds compared to period one. Wind speeds during periods two and three were similar and the concentrations of particles greater than 200 nm, as indicated in Figure 6, were also similar. Results from volatility and chemistry studies have been summarized in Table 4 and in Figures 7 and 8. Figure 7 and Table 4 indicate that the volatile number fraction was between 70 and 90% for all 300°C studies, and between 60 and 90% for all 150°C studies. At 50°C and 100°C, larger differences are found for the different studies, and a greater fraction of the total number concentration was volatile at lower temperatures during period three compared to period two. The high Aitken and
" "
"
,,
,
.
"."
,
....
-
"
..,-.".
'::.
....
"
,".
-.,'"
\,." "
,
,
.--.. \".
...
,
,
".,
...
,
...'.
-
-
..,
...
......,
,
,
,
,
,
,
100 1000 1 0 '-- ..._ _.L...---'_....L..-...-L-....L..-I--I- "'--_----L_-'----"'---"'--"'---''--"--' 10 100 1000 Particle Diameter (nm)Figure 6: Average size distributions observed at Macquarie Island during periods one (solid), two (dotted) and three (dashed). 156,266 and 471 distributions were averaged from period one, two, and three, respectively.
Young Aitken mode number concentrations and increased volatile number fraction during period three suggest that these particles are more volatile than accumulation mode particles. It is possible that the higher volatile number fractions at 50°C during period three are due to the
Table 4. Summary of volatile fraction (VF,%) of total CPC number concentration (em-3) for ACE-1 whole aerosol volatility studies. VFN50 designates the volatile number at 50°C, VFNIOO
designates the volatile number fraction at lOO°C, VFN150 designates the volatile number fraction at 150°C, and VFN300 designates the volatile number fraction at 300°C.
Date Period UTC DOY CPC UCPC VFN50 VFNIOO VFN150 VFN300
Nov. 30 II 334.5 500-800 500-800 0 7 58 75 Dec. 2 II 336.5 600 600 0 7 58 84 Dec. 5 III 339.0 300 300 17 68 70 76 Dec. 6 III 340.3 500 600 48 56 64 70 Dec. 8 III 342.3 550 650 15 78 80 83 Dec. 10 III 344.4 800 900 18 70 73 80 Dec. 12 III 346.0 750 950 29 81 87 87
DOY
334.5 25 1.0 0.8 0.6volatile
0.4number
fraction
0.2 300temperature
ee)
Figure 7: Volatile number fraction verses temperature for the seven volatility studies conducted at Macquarie Island during ACE·!. Data are listed in Table 4.
346.0
DOY
III....
Q) III :s :s 0 iaIII J:!....
0 ~-
Q) tlI tlI :s u§
Q) III tlI III C 0of
-€
tlI tlI U u 150 25 sp~ciesFINE MODE
300number
fraction
Figure 8: (a) Summary of particle chemical composition verses temperature for the seven volatility studies conducted at Macquarie Island duringACE-lfor sea salt, sulfate and carbonaceous particles. Results from accumulation mode analysis.
COARSE MODE
346.0 344.4DOY
334.5 1.0 0.8 0.6 0.4 0.2~:=~~~~~~77o·0
-
~ II) iiiII) ~='
0 fj III:;
~ II) III c:: 0of
300 25 IIIu 150species
number
fraction
Figure 8: (b) Summary of particle chemical composition verses temperature for the seven volatility studies conducted at Macquarie Island during ACE·! for sea salt,sulfate and carbonaceous particles. Results from coarse/sea salt mode analysis.
loss of particle-bound water and subsequent shrinkage of Young Aitken and Aitken mode particles to sizes sma.11er than the CPC can detect. The observed accumulation and sea salt mode compositions have been plotted for a.11 studies and three study temperatures in Figures 8a and 8b, respectively. No data are available on DOY 339, 340 and 342 at 25°C due to the extremely sma.11 size and high volatility of particles. On DOY 344, data at 25°C are missing due to a torn grid. As expected, sea salt particles dominate and no sulfate particles remain in the 300°C samples. In general, sulfate and carbonaceous particles are more prevalent in the accumulation mode, while sea salt dominates the composition of particles larger than 200 nm.
Period One: November 22-27 (Days 926-992)
Over the six days of period one, clean marine conditions -were experienced half of the time. The observed average number, area, volume and DMS concentrations during period one were about one-half the average for a.11 clean marine periods taken together. The genera.11y lower number and DMS concentrations during this period are evident in Figure 4. Since ocean regions west and southwest of Macquarie Island are expected to be associated with low particulate mass concentrations, the low particle concentration values are consistent with the prevalent westerly and southwesterly fetch during this time, and with the seasonal cycle in number concentration previously observed in the region by Gras (1995). As can be seen in Figures 4 and 5, a rapid increase in
epe
number concentration and a change in the size distribution was observed after a warm front passed Macquarie Island around DOY 327.0 and a change in air mass source region from westerly to northwesterly occurred. Theepc
number concentration and size distribution were variable until DOY 330.0 as the air mass source region changed from northwesterly to northerly, back to westerly, and then fina.11y to southwesterly after DOY 330.0 when a high pressure system influenced the island until DOY 331.2.Timelines of size distribution mode median diameters and total number in each mode have been plotted in Figures 9a and 9b for period one. The occurrence and rate of local precipitation are indicated in Figures 9 through 11 by the presence and height of the thick vertical lines along the time axes. During clean marine conditions in Figure 9a, the observed Young Aitken mode diameter was similar to the clean marine average value of 21 nm, but the Young Aitken mode was observed in only 13% of the distributions from period one. The period one Young Aitken mode number concentration is only 17% of the clean marine average. The Aitken mode size during clean marine conditions is similar to the study average value of 33 nm and the accumulation mode is present at sizes larger (126 nm) than the clean marine average value of 113 nm. Both the Aitken and accumulation mode number concentrations during period one are only 55% of their clean marine average values.
The increased variability, notable in Figure 9a, between DOY 327.7 and 328.4 ofthe accumulation mode parameters and the Aitken mode number concentration is likely due to local precipitation or island influence. A Young Aitken mode is seen in Figure 9a around the same time as local precipitation between DOY 328.4 and 328.5 and at DOY 329.7, coincident with minima in both Aitken and accumulation mode number concentrations. Conditions strongly influenced by an Antarctic air mass occurred between DOY 330 and 331.5 during high pressure conditions. The very low average DMS concentrations observed during this time suggest that ocean waters southwest of Macquarie Island were still too cold for significant production of DMS to occur.
epe
number and DMPS number, area and volume concentrations were a.11lower during Antarctic input compared(0) Mode diameters vs. time 300 ~
,
f-
~ f-200"'"
,
..
,,,
,
,~,
,
,
"
,
t&"~
100•
.'
,
E 80,
.s. c 60 .!! 50*
*
~
u )III( E~,
.
.~\
*
tJ*.
fl'
iIl'r.
a 40 is 30I
tI'
*
*
fPPl
1!..-n
-w-+ . . + 20*
1;/
-41-+ + :#: + + + +t
-!ltir
+I~
10I
II.
III
I I
f
326 327 328 329 330 331 332Ooy of Year(UTC)
(b) Fitted mode number concentration vs. time
2500 T 2000 ~
f-
~
1600 + 1200 + 800~
.
, E~~:
~ 400 u*
+*
+
'0 0 / I"t
E..
Ii +~~
c* , ••
'!' .
a"g
U c •• :" '+, u .c E'
..
~ Z..
,.
+ + + + + II*
I~*
10 II III I I 326 327 328 329 330 331 332Day of Year(UTC)
Plus: Young Aitken Mode; Asterisk: Aitken Mode;Oat :Accumulation Mode
Figure 9: Timeline of Young Aitken (plus), Aitken (asterisk) and accumulation (dot) mode (a) diameters and (b) mode number concentration for period one. Influenced conditions designated by periods between vertical lines as shown by arrows. Warm and cold frontal passages shown as open and closed dots, respectively, along time axis. Precipitation indicated by thick, vertical bars along time axis.
to clean marine average values (Table 2). The higher average radon concentrations during this time may have been due to either Antarctica or island influence, since the prevailing wind direction was (southwesterly) and air masses would pass over the bulk of the island before being sampled at the clean air laboratory. As can be seen in Figure 9a, compared to clean marine conditions, the size distribution during the Antarctic influenced conditions was typified by smaller average accumulation mode size, larger Aitken mode size, and similar concentrations in the two modes. During clean marine conditions the Aitken mode typically has four times the accumulation mode number concentration, while during southwesterly flow periods at the beginning and end of period one, the Aitken and accumulation modes contain nearly equal number concentrations. No volatility or chemical composition data are available for period one.
Period Two: November 28-December
4
(Days 332-338)Period two lasted a total of six days, with 3.9 days classified as clean marine. Average number concentrations, DMS and radon concentrations for period two are very similar to the clean marine average values. Variability in the CPC number concentration, evidenced in Figure 4a, is attributable to changes in air mass source region associated with frontal activity and local precipitation. The number concentration timeline in indicates a rapid increase in number concentration just before the onset of clean marine conditions during period two (DOY 332.7), associated with a cold front passage resulting in a change in air mass source region from southwest to northwest of the island. Changes in the size distribution are also evident in Figure 5 at this time. A relatively large difference between the CPC and DMPS number concentrations at DOY 332.7 and 333.5 correspond to the appearance of high number concentrations of Young Aitken mode particles during the northwesterly fetch, as evidenced in Figure 5. A rapid increase in number concentration is notable in Figure 4a around DOY 334, followed by a strong decrease. The increase is associated with the passage of warm and cold fronts on DOY 333 and 334 and a 45% increase in along trajectory northwesterly winds at this time. The rapid decrease is interpreted as defining the onset of a stable air mass in post cold frontal conditions. In general, increases in number concentration evident in Figure 4a are associated with a shift in air mass source region to northwest of Macquarie Island and decreases in CPC number concentration are associated with with shifts to westerly and southwesterly source regions. The shifts in air mass source region were the result of frontal passages.
Timelines of mode parameters for this period are shown in Figure 10. The smallest average accumulation mode diameter was observed during period two and may be related to the higher frequency of frontal passages, cloud processes and associated wet deposition of larger accumulation mode particles. The period two average Young Aitken mode number concentration is larger than the study average, and the highest frequency of appearance of a Young Aitken mode was observed during period two, with 34% of the distributions exhibiting a Young Aitken mode. This may be attributable to the greater frequency of frontal activity and associated precipitation that produced low accumulation and Aitken mode concentrations and conditions favorable for observing particles in the Young Aitken size range. The Young Aitken mode at DOY 333.5 and later on 334 was observed at the onset of warm front and post-cold front conditions, respectively, and were associated with minima in both Aitken and accumulation mode number concentrations produced by precipitation. A significant amount of convective cloud activity was apparant arou~d DOY 333.2.
(a) Made diameters vs. time 300
---1f-
---1
f-200'"
~
~'W
,
-100
,
~-,
tie'
,
e-
80..:.
~ ~ 60•
;; 50 lIE ~-E .2 40willE _
0 30~
..
+
++
+
++
,.."t
20+t.*
+
~
...
+
II
i tI
~1I111
10~
+
~
1+1
I
332 333 334 335 336 337 338Oay of Year (UTC)
(b) Fitted mode number concentration vs. time
2500 2000
---1f-
---1
f-1600 1200\
+
800 ", E ~ 400 ~ 'C 0 E 200 .E cJ c 0 100 u ~ 80,
•
" .c 60 E, 50 z 40 30 20 10I
,
I III 332 333 334 335 336 337 338Oay of Year (UTC)
Plus : Yaung Aitken !Aade ; Aslerisk : Aitken !Aode ; 001 : Accumulation !Aode
Figure 10: Timeline of Young Aitken (plus), Aitken (asterisk) and accumulation (dot) mode (a) diameters and (b) mode number concentration for period two. Influenced conditions designated by periods between vertical lines as shown by arrows. Warm and cold frontal passages shown as open and closed dots, respectively, along time axis. Precipitation indicated by thick, vertical bars along time axis.
frontal air mass starting around DOY 332.7 and 336.1 and the accumulation mode number concentration is relatively smaller during the associated cold frontal precipitation due to precipitation scavenging. There is no associated minimum in accumulation mode number at the cold frontal passage at DOY 335.5, and no local precipitation was observed at this time.
Two volatility studies were conducted during period two, one during weakly Australia influenced conditic,ns and the other during clean marine conditions. The volatile number fractions from the two studies, shown in Figure 7, are similar for similar temperatures, eventhough the air mass source regions were different. This is likely due to the brief contact the influenced air mass had with Tasmania. During influenced conditions, the air mass arrived from regions northwest of the island, while tr.e clean marine study was conducted during westerly input. The different air mass source regions ;a.re consistent with the differences observed in the accumulation mode chemical composition shownillFigure 8a. The low volatile number fraction indicated in Figure 7, 7% at lOO°C, suggests a lack cf highly volatile particles, while the rapid increase to 60% at 150°C indicates that some compound more volatile than ammonium bisulfate or ammonium sulfate was present. During
influencl~dconditions on DOY 334, the presence of moderate concentrations of Young Aitken mode particles or of volatile carbonaceous particles in the accumulation mode might explain some of the increase in volatile number fraction at 150°C. The low volatile number fractions at temperatures below UiO°C during clean marine conditions on DOY 336 correspond to conditions when a dominant Young Aitken mode was not observed in the size distribution, and fewer volatile carbonaceous particles were found compared to influenced conditions. EM analyses of ambient particles during clean m,arine conditions indicate that carbonaceous particles with number median diameter near 100 nm made up approximately 20% of the accumulation mode number and were volatile at higher temperatures, indicating that they were not soot particles. Results from analysis of the 25°C sample, shown in Figure 8a, suggest most of the volatile particles were sulfates representing 47% of the ac:cumulation mode number with a number median diameter of 130 nm. Internal mixtures of sea salt and non-sea salt sulfate particles were identified in the accumulation mode size range at 18% of the number concentration. The remaining particles were calcium-rich minerals and quartz. At 150°C the number of accumulation mode particles detected relative to the number of sea salt mode pa.rticles was the same as the 25°C sample, suggesting that most of the change in volatile number fraction shown in Figure 7 was associated with the Young Aitken and Aitken modes. At 150°C on DOY 336, the accumulation mode was made up of ammonium sulfate and/or ammonium bisulfate particles, internally mixed particles of sea salt and sulfate, mineral and a smaller fraction of carbonaceous particles. Changes in abundance were only significant for sulfate considering the errors dt;e to counting statistics
(+/-
15%). The volatile response observed during period two clean marine conditions was not observed again during other clean marine volatility studies. A similar response was observed during Tasmania influenced conditions, DOY 334, however, a larger fraction of volatile carbon containing and mineral particles occurred during influenced conditions. Sea salt particles were detected in the 300°C accumulation mode sample during influenced conditions but not during clean marine conditions. This might be attributable to higher average along-trajectory wind speeds on DOY 334 (14 vs 11 m s-l).During clean marine conditions on DOY 336, results at 300°C, shown in Figure 7, indicate that 16% of be total number concentration remained as refractory material. Analysis of the refractory component indicates mostly sea salt at 87% of the number, with a small but noticeable contribution from aluminosilicate minerals, quartz and carbonaceous material. The mass median diameter of the sea salt mode was measured at 620 nm. The composition of particles greater than 200 nm, shown in Figure 8b, for the 25°C and 150°C samples was dominated by sea salt (60 to 72% of
particle number), with carbonaceous and sulfate paricles making up the balance. These results, coupled with the volatility measurements, suggest that at most 22% of the number concentration was sea salt, accounting for about 130 particles cm-3•
Period Three: December 5-19 (Days 998-947)
The longest sustained period of clean marine conditions, 3.5 days, occurred in the middle of period three and was characterized by several frontal passages. The average CPC number concentration and DMPS number, area and volume concentrations are all significantly higher during period three compared to clean marine averages. DMS concentrations are also relatively higher, while radon concentrations are similar to average values. Trajectories from this period indicate a westerly and northwesterly air mass source region as well as more vigorous wind speeds aloft. Generally higher number concentrations on DOY 341, 343 and 344 occur during periods of strongest low level flow (341) and most northwesterly source region (343 and 344). The large difference between CPC and DMPS derived number concentrations between Day 344.0 and 344.4 is associated with rapid, one-day transport from influenced regions to Macquarie Island, extremely high radon and DMS concentrations, the presence of Young Aitken mode particles, and upper level trajectories passing over southeastern Australia.
There are several examples of aerosol variability related to frontal passages and air mass source region changes during period three. The increases in CPC and DMPS number concentrations in Figure 4a and changes in mode parameters in Figures 5 and 10 during Day 339, after Day 340.5, and at Day 342.2 and 343.8 are associated with changes in air mass source region from southwesterly or westerly to northwesterly. Corresponding decreases in CPC number concentration occur during post-cold frontal precipitation in the sustained northwesterly air masses. An increase in CPC, Aitken mode and accumulation mode number concentrations on Day 340 are associated with tranport over warm, DMS rich waters, consistent with the high DMS concentrations observed at this time (Figure 4c). Minima in CPC concentrations between Day 342 and 346 coincide with westerly and southwesterly input, while maxima correspond to more vigorous northwesterly and northerly input.
The Young Aitken mode parameters during period three were similar to the clean marine average values for all periods. Both the Aitken and accumulation mode number concentrations were higher (99% confidence level) during period three compared to study averages, consistent with the higher observed CPC concentrations. The increased number concentrations during the onset of summer are consistent with the expected climatological seasonal gradient in number concentration found at Cape Grim (Gras, 1995). An apparent increase in both the Aitken and accumulation mode
diameters with time can be seen in Figure 11a, occurring between Day 340.8 and 342, between 342.5 and 343.4 and between 344.2 and 345.5. The accumulation mode size is extremely variable between 344.2 and 345.5. Each of these events occurred during sustained northwesterly and westerly input. The Aitken mode number concentration increased, reached a maximum, and then decreased again during each of these events. The final event was unique in that the accumulation mode number concentration changed significantly, following the same trend as was found in the Aitken mode number concentration. This difference can be explained by sustained post cold frontal conditions during the final event, compared to the first two events, where the post cold front conditions ended when warm fronts passed the site at times corresponding the the observed minima in accumulation mode number concentration, marking a change in air mass to westerly. Precipitation marked
(a) Mode diameters vs. time Ii ;; E
~
+lIE~
.2'11 "
0fA
;li-I
. + t++
+ tI~
l
+II •
10•
"
I
II 336 339 340 341 342 343 344 345 346 347Ooy of Yeor (UTC)
(b) Fitted made number concentration vs. time
2500
--$
2000 1600 1200 + + 800*\
~, E ~•
,•
'D 0 E .~I'" •
Ii c 0 + u Ii"
•
*
E,
z 20 + 10 I ~~ III I II III
II 338 339 340 341 342 343 344 345 346 347Doy of Yeor (UTC)
Plus: Youn9 Aitken llode ; Asterisk: Aitken llode ; Dot : Accumulotion llode
Figure 11: Timeline of Young Aitken (plus), Aitken (asterisk) and accumulation (dot) mode (a) diameters and (b) mode number concentration for period three. Influenced conditions designated by periods between vertical lines as shown by arrows. Warm and cold frontal passages shown as open and closed dots, respectively, along time axis. Precipitation indicated by thick, vertical bars along time axis.
the beginning and end of each of the events, also explaining some of the change in number concentrations. At the onset of the third event, rapid transport from regions in the vicinity of Tasmania and strong northwesterly flow occurred, briefly shifting to westerly after DOY 345 and then returning to northwesterly. The number concentration during northwesterly flow was relatively higher than during westerly flow periods.
Two influenced periods, the first due to input from Antarctica between DOY 338.2 and 340, and the second due to rapid transport from Australia between DOY 343.4 and 344.2, occurred during period three. Compared with the clean marine cases in period three, the Antarctic case between DOY 338 and 339 had a relatively smaller accumulation mode diameter and larger Aitken mode diameter. The trend for smaller accumulation mode size and larger Aitken mode size is similar to that seen during the first Antarctic input period. The appearance of a Young Aitken mode starting at DOY 339.5 is coincident with local precipitation at this time, and both accumulation and Aitken mode concentrations decrease between DOY 339.5 and 340.2 while the Young Aitken mode appears to increase in modal size.
The strongest Australia influenced conditions occurred on DOY 343, and the highest Aitken and accumulation mode number concentrations were observed at this time, consistent with the 56% higher CPC number concentration, compared to the clean marine average, shown in Table 2. DMS concentrations were extremely high, consistent with higher average along-trajectory wind speeds (15 m s-l) and transport from productive ocean regions northwest of the island. The highest radon concentrations of the study period were observed on DOY 343, associated with a transport time from Australia of one day. The drastic change in the size distribution can be seen in Figure 5. A significant increase in the Aitken mode size can be seen in Figure !la, while the accumulation mode size appears to increase and then decrease, and becomes highly variable. Aitken and accumulation mode parameters observed during this strongly influenced period are different from those during clean marine periods at the 99% confidence level. Strong local precipitation occurred between DOY 343.4 and 343.7, and a Young Aitken mode is seen around DOY 344.0 in the post cold frontal air mass.
Four volatility studies were conducted during clean marine conditions during period three. The results shown in Figure 7 indicate that the aerosol was extremely volatile. The volatile response could be explained by a sulfuric acid composition at 30% relative humidity losing water and shrinking to sizes below the CPC 50% detection efficiency size of 12 nm, consistent with the presence of high number concentrations of small Young Aitken mode particles (18 to 60% of the total number concentration) and larger differences between CPC and UCPC number concentrations during all period three volatility studies. Itis also possible that some other highly volatile chemical composition occurred at small sizes during period three. The highest volatile number fractions at 50°C were observed when the size distribution exhibited a dominant Young Aitken mode, suggesting that these particles were either extremely volatile or shrunk to sizes below those detectable by the CPC due to loss of water. The volatile number fractions observed are larger than those found in laboratory studies with polydisperse sulfuric acid particles, supporting the notion that some other highly volatile compound was present. The increase in volatile number fraction between 100°C and 150°C was generally small, between 2 and 8%, with a similar increase between 150°C and 300°C. Results were similar from one study conducted during Antarctic influenced conditions on DOY 339. Such high volatile number fractions near 100°C have been previously observed in the remote Arctic by Covert et ai.
(1984).
They speculated that some chemical constituent of the aerosol, possibly organic in nature and more volatile than sulfuric acid, was present but not detectable with theirchemical analysis techniques.
The presence of volatile sulfate and carbonaceous particles, and of sea salt, was confirmed by the EM analyses and is shown in Figure 8a. Aerosol composition of both accumulation and coarse modes of the aerosol size distribution are available in conjunction with volatility results for DOY 342, 344 and 346. The highly evaporative nature of the aerosol during period three makes it difficult to accurately determine the fine aerosol composition using EM techniques. The results for DOY 342 and 346 are very similar with respect to the accumulation mode aerosol at 25°C, both samples contain sea salt at 60% and non sea salt sulfate at 24 to 32% of the number concentration, respectively. The remaining 20% was divided almost equally between carbonaceous, mineral and quartz aerosol. The number median diameter of the accumulation mode determined from EM measurements was 90 nm for DOY 342, and 110 nm for DOY 346, agreeing very well with the average modal value of 108 nm for the accumulation mode reported in Table 3 for period three. No EM results are available for the fine mode aerosol at 25°C for DOY 344. The coarse mode composition from a 25°C sample collected on DOY 346 was mostly sea salt at 90% of the number, also containing aluminosilicate minerals (4%) and a noticeable fraction of carbonaceous material (6%). The mass median diameter for the coarse mode was 710 nm.
No distinction can be made between aerosol samples collected at 150°C and 300°C due to the similarities in the volatile response for all three days. A relatively small number of sulfate particles was identified in the 150°C samples, but otherwise they appeared identical. The remaining accumulation mode aerosol at 300°C was composed almost entirely of sea salt (number median diameter 120 nm) for DOY 342. On DOY 344, the non-volatile aerosol at 150°C was made up of fine sea salt, mineral and quartz, and carbonaceous material. The fine carbonaceous material is not soot, based on the particle morphology. For the coarse mode aerosol on this day, the refractory material was again mostly sea salt at 78% ofthe number, the remainder was mineral, quartz, and carbonaceous aerosol. This sample appears to be more influenced by continental, or anthropogenic sources due to the higher abundance of mineral, quartz, and carbonaceous material in both the coarse and accumulation mode samples. The non-volatile material for DOY 342, and 346 was most1y sea salt at 93% and 90% of the number concentration. Mass median diameters were 580 and 710 nm. These results, coupled with volatility measurements, suggest that 12 to 16% of the total aerosol number concentration was sea salt particles, corresponding to a concentration of 88 to 125 cm-3 of salt.
Comparison With Previous Studies
Previous work at Macquarie (Downey et al., 1990) has demonstrated that long range transport of particles and radon from the Australian continent to Macquarie does occur. During ACE-1, it was found that the average number concentration from all Tasmania in:fl.uenced conditions was only 19% larger than that from during clean marine conditions, a somewhat surprising result since particle concentrations have been used at other sites to detect in:fl.uenced conditions (Bigg
et al., 1984; Gras and Whittlestone, 1992; Downey et al., 1990; Gras/ 1995). This is due to
the remote location of Macquarie Island and, on two occasions, the very short residence times ( <8 hours) over Tasmania. Air masses influenced by nearby continents generally have between 1 and 3 day transport times over cloud-covered ocean regions before reaching Macquarie Island, and precipitation scavenging processes associated with along-trajectory clouds would reduce the number concentration in influenced air masses arriving at Macquarie Island. Analysis of back trajectories
indicates that air masses associated with greater than 3 day transport times from continents exhibit aerosol properties similar to those observed during clean marine conditions. Air masses associated with between 1 and 3 day transport times tend to be associated with weakly influenced conditions at Macquarie Island. During strongly influenced conditions associated with less than one day transport from Australia, the number area and volume concentrations were each about 50% higher than their clean marine average values. These results suggest that increases in Young Aitken, Aitken and accumulation mode size particles account for most of the difference between strongly influenced conditions and clean marine conditions at Macquarie Island. This may be seen by the larger difference between the CPC and DMPS number concentrations during Australia in:fluenced compared to clean marine conditions in Table 2 and the larger Aitken and accumulation mode concentrations during Australia influenced conditions in Table 3.
The zonally averaged cloud cover of the ACE-1 region during November and December is between 80 and 85% (Berlyand and Strokina, 1980), and our analyses indicate that clouds often occurred along trajectory pathways. Our observations of a strongly bimodal size distribution during clean marine conditions are consistent with the strong influence of cloud processes in the region and with previous observations in other remote marine regions (Hoppel et al., 1986,. Hoppel and Frick,
1990,. Jensen et al., 1992). During strongly Australia influenced conditions, the size distribution observed at Macquarie Island was monomodal and exhibited higher number concentrations than during clean marine conditions, similar to the findings of Jensen et al. (1996).
It is of interest to compare number concentration results from this study with previous studies in the region at Cape Grim and coastal Antarctica. Ito (1985) reports number concentrations using a Pollack counter
(D
p > 3 nm) between 210 and 370 cm-3 at the Japanese Syowa coastalAntarctic station (69°S, 39°30'E) between November and December 1978. Lehmann and Jaenicke (1991) report number concentrations between 400 and 500 cm-3 using a TSI Model 3020 CPC
(D
p >7 nm) at the German Georg von Neumayer coastal Antarctic station (70037'S, 8°22'W) between 1984 and 1990 during the same months. They also reported higher number concentrations related to subsidence after frontal passages at the site. Gras (1993) reports similar number concentrations, between 400 and 500 cm-3, using a Pollack counter at Mawson coastal Antarcticstation (67°S, 63°E) between 1985 and 1990. During Antarctic influenced periods, the average number concentration at Macquarie Island was 571 cm-3 , 14% higher than the highest values
of the latter two studies. This difference could be due to a latitudinal gradient in number concentration and mixing of air masses during transport between Antarctica and Macquarie, interannual variability in number concentration, or differences in instrument response. The average clean marine number concentration at Macquarie Island (55°S, 159°E), 675 cm-3, was higher than
that found in Antarctic air masses, but varied between 100 and 1800 cm-3 with a standard deviation
of 300 cm-3• Gras (1995) reports November-December clean marine number concentrations
using a TSI Model 3020 CPC at Cape Grim, Tasmania (41°S, 145°E) for the period 1977-1992 between 300 and 700 cm-3, with concentrations increasing from November to December. The clean marine average number concentration at Macquarie Island compares favorably to this range of concentrations. Downey et al. (1990) report a 1987 annual average number concentration of 250 cm-3 for westerly and northwesterly wind sectors at Macquarie Island using a Pollack counter,
significantly lower than found in this study. Differences between results from this study and Downey
et al. (1990) reveal the strong seasonal variation in particle number concentration in the region previously described by Bigg et al. (1984). Gras and Whittlestone (1992) report summertime 1989 clean marine average number concentrations between 200 and 600 cm-3 (10th and 90th percentiles) at Macquarie Island using a Pollack counter, with a median number concentration of320cm-3,half