Netrin‑1 functions as a suppressor
of bone morphogenetic protein
(BMP) signaling
Ahmad Abdullah
1,3, Carl Herdenberg
1,3& Håkan Hedman
1,2*Netrin‑1 is a secreted protein that is well known for its involvement in axonal guidance during embryonic development and as an enhancer of cancer cell metastasis. Despite extensive efforts, the molecular mechanisms behind many of the physiological functions of netrin‑1 have remained elusive. Here, we show that netrin‑1 functions as a suppressor of bone morphogenetic protein (BMP) signaling in various cellular systems, including a mutually inhibitory interaction with the BMP‑promoting function of leucine‑rich repeats and immunoglobulin‑like domains (LRIG) proteins. The BMP inhibitory function of netrin‑1 in mouse embryonic fibroblasts was dependent on the netrin receptor neogenin, with the expression level regulated by both netrin‑1 and LRIG proteins. Our results reveal a previously unrecognized function of netrin‑1 that may help to explain several of the developmental, physiological, and cancer‑promoting functions of netrins at the signal transduction level.
Abbreviations
BMP Bone morphogenetic protein FBS Fetal bovine serum
LRIG Leucine-rich repeats and immunoglobulin-like domains MEF Mouse embryonic fibroblast
PBS Phosphate-buffered saline
Netrin-1 is a secreted protein that is encoded by the NTN1 gene in humans and is expressed by many tissues and cell types [www. prote inatl as. org]. In mammals, the netrin protein family comprises five expressed mem-bers: netrin-1, netrin-3, netrin-4, netrin-G1, and netrin-G21. Netrins play important roles in axon guidance via
interactions with their receptors, which belong to the Unc-40 family, including deleted in colorectal carcinoma (DCC) and neogenin, and Unc-5 family, including UNC5A, UNC5B, UNC5C, and UNC5D1–3. Recently, Down
syndrome cell adhesion molecule (DSCAM) and melanoma cell adhesion molecule (MCAM, also known as CD146 or MUC18) were also found to function as high-affinity netrin-1 receptors3,4; however, the biological
significance of these interactions remains controversial. Recently, it has become clear that netrins play important roles not only in axon guidance but also in many other developmental and physiological processes.
During inner ear development in mice, Ntn1 reciprocally opposes both leucine-rich repeats and
immunoglob-ulin-like domains 3 (Lrig3)5 and Bmp26. Netrin-1 also seems to play a role in bone remodeling, where it inhibits
osteoblast differentiation7 and supports osteoclast differentiation8. Netrin-1 may also play a role in metabolic
homeostasis and disease, as suggested by recent findings showing that the serum levels of netrin-1 are elevated in patients with impaired fasting glucose or type 2 diabetes9,10, that the expression of genes related to the netrin-1
signaling pathway is increased in blood from subjects with fatty liver11 and that at the cellular level, netrin-1
pro-motes the proliferation of adipose-derived stem cells12. Netrin-1 is often highly expressed in cancer tissues (see,
for example, the Human Protein Atlas [www. prote inatl as. org]) and has been reported to promote tumorigenesis in a variety of systems13. For example, forced netrin-1 overexpression in the mouse intestine results in
hyper-plasia and adenoma formation14, autocrine netrin-1 expression is implicated in the progression of experimental
inflammatory bowel disease to colorectal cancer15, autocrine netrin-1 expression promotes experimental breast
cancer metastasis16, and in glioma, netrin-1 promotes cancer cell invasion and stemness17. Netrin-1 has also been
proposed to enhance angiogenesis18. Recently, colon and lung cancer-associated fibroblasts have been shown to
produce netrin-1, which enhances the tumorigenicity of cocultured lung cancer and colorectal cancer cells19.
In some contexts, netrin-1 protects cells against apoptosis, and it has been suggested that the netrin-1 receptors
OPEN
1Department of Radiation Sciences, Oncology, Umeå University, 90187 Umeå, Sweden. 2Oncology Research
Laboratory, NUS M31, 90185 Umeå, Sweden. 3These authors contributed equally: Ahmad Abdullah and Carl
DCC, neogenin, UNC5A, UNC5B, UNC5C, and UNC5D function as ‘dependence receptors’, i.e., receptors that initiate apoptotic signaling in the absence of ligands20,21. Intriguingly, the molecular mechanisms behind many
of the developmental, physiological, and tumor-promoting functions of netrin-1 remain poorly characterized. Given the many prominent developmental and physiological functions of netrin-1, it is important to eluci-date the molecular mechanisms by which these functions are executed. Here, we show that netrin-1 negatively regulates bone morphogenetic protein (BMP) signaling in different cellular contexts. This discovery might help to explain many previous observations regarding the physiological and pathological functions attributed to this pleiotropic protein.
Materials and methods
Reagents and antibodies.
Human recombinant BMP4 (#120-05), BMP6 (#120-06), BMP9 (#120-07), and mouse noggin (#250-38) were purchased from PeproTech Nordic (Stockholm, Sweden). Human recombi-nant netrin-1 (#6419-N1) was obtained from Bio-Techne Ltd. (Abingdon, UK). The antibodies used in this study are listed in Table S1.Cell lines and cell culture.
Mouse embryonic fibroblast (MEF) lines established in our laboratory accord-ing to the 3T3 protocol22 were cultured in Dulbecco’s modified Eagle’s medium (DMEM) (Sigma-AldrichSwe-den AB, Stockholm, SweSwe-den) supplemented with 10% fetal bovine serum (FBS) (Fisher Scientific GTF AB, Gothenburg, Sweden), MEM-nonessential amino acids (Fisher Scientific GTF AB), 50 μM 2-mercaptoetha-nol (Sigma-Aldrich Sweden AB), and 50 μg/ml gentamicin (Invitrogen, Fisher Scientific GTF AB). The human ovarian cancer cell lines Ovcar-3 and Ovsaho (cell number: JCRB1046) were obtained from American Type Culture Collection (ATCC) (Manassas, VA, USA) and Japanese Collection of Research Bioresources (Osaka, Japan), respectively, and they were maintained in RPMI 1640 (Sigma-Aldrich Sweden AB) containing 20% FBS with 10 μg/ml bovine insulin (Sigma-Aldrich Sweden AB, cat. #I0516) and 10% FBS, respectively. Human acute lymphoblastic leukemia cell lines 697 and RCH-ACV were obtained from the Leibniz Institute DSMZ-German collection of microorganisms and cell cultures (Braunschweig, Germany) and maintained in RPMI 1640 sup-plemented with 10% FBS, 22 mg/ml sodium pyruvate (Sigma-Aldrich Sweden AB, #S8636), and 50 μg/ml gen-tamicin. Human glioblastoma cell lines TB101 and TB107 were previously established in our laboratory23,24
and maintained in F12 medium (Invitrogen, Fisher Scientific GTF AB, #11320) supplemented with penicillin– streptomycin (Invitrogen, Fisher Scientific GTF AB, #15140, 1:100), 20 ng/ml EGF (R&D Systems Europe Ltd., Abingdon, UK, #236-EG), 20 ng/ml bFGF (#233-FB, R&D Systems Europe Ltd.), B27 (Invitrogen, Fisher Scien-tific GTF AB, #17504-044), and N2 (Invitrogen, Fisher ScienScien-tific GTF AB, #17502-048) and cultured in laminin-coated (Sigma-Aldrich Sweden AB, #11243217001) flasks for maintenance and in laminin-laminin-coated 12-well plates for experiments. The ATDC5 cell line was obtained from Sigma-Aldrich Sweden AB (#99072806-1VL) and maintained in DMEM:Ham′s F12 (1:1) containing 2 mM glutamine and supplemented with 5% FBS and 50 μg/ ml gentamicin. The HEK293, A375, HCT116, LoVo, MDA-MB-451, and T-47D cell lines were obtained from colleges and authenticated through short tandem repeat profiling via Eurofins Genomics Germany GmbH (Ebersberg, Germany) or ATCC. HEK293, A375, HCT116, and LoVo cells were cultured in DMEM supple-mented with 10% FBS and 50 μg/ml gentamicin. MDA-MB-451 and T-47D cells were cultured in RPMI 1640 with 10% FBS and 50 μg/ml gentamicin. All the cell lines were maintained at 37 °C in a humidified atmosphere containing 5% CO2.
Phospho Smad1/5 immunofluorescence assay.
Cells were seeded at a density of 3,000 cells per well in a 96-well microtiter plate (#655090, Greiner Bio-One International GmbH, Monroe, NC, USA) coated with 0.1% bovine gelatin. After an overnight incubation, the cells were starved in serum-free medium for 1 h followed by the induction of BMP signaling using different concentrations of BMP4, BMP6, or BMP9. After an hour of BMP treatment, the cells were washed with phosphate-buffered saline (PBS) and fixed with 4% formaldehyde. For the cross-titration studies, Ntn1−/−, Lrig-null MEFs with Tet-On inducible LRIG1-FLAG or LRIG3-FLAG alleles were used. The cells were treated with different concentrations of doxycycline overnight. The next day, the cells were serum-starved for an hour followed by the addition of 5 ng/ml BMP4 with different amounts of netrin-1. After 1 h of incubation, the cells were washed with PBS and fixed with 4% formaldehyde. To investigate the kinetics of netrin-1 inhibition, 0.25 μg/ml netrin-1 was added to wild-type MEFs at different timepoints before, with, or after the addition of BMP4. Sixty minutes after the addition of BMP4, the cells were washed with PBS and fixed with 4% formaldehyde. Then, the pSmad assay was conducted as described previously25.RNA extraction and quantitative RT‑PCR.
RNA extraction was carried out using a PureLink RNA Mini Kit (Invitrogen, Fisher Scientific GTF AB) with PureLink DNase (Invitrogen, Fisher Scientific GTF AB) treatment. A TaqMan assay was used to quantify the gene expression of Id1 (Mm00775963_g1, Fisher Scientific GTF AB, #4331182), and normalization was performed using the reference gene RN18S as an internal control as described previously26. Data acquisition was performed using a CFX96 system C1000 thermal cycler (Bio-RadLaboratories AB).
Ntn1 and Neo1 gene ablations.
Lrig-triple FLOXed MEFs (Lrig1fl/fl;Lrig2fl/fl;Lrig3fl/fl) or Lrig-null MEFs(Lrig1−/−;Lrig2−/−;Lrig3−/−) with inducible LRIG1 or LRIG3 alleles26 were transfected using Fugene6 transfection
reagent (Promega Biotech AB, Nacka, Sweden), as previously described26, using the CRISPR/Cas9
HDR-medi-ated knockout kit KN311288RB (Ntn1) or KN310902RB (Neo1) from OriGene Technologies (BioNordika Swe-den AB, Solna, SweSwe-den) and a donor plasmid with a Blasticidin S resistance gene together with either a CRISPR/ Cas9 plasmid guide-RNA for the Ntn1 or Neo1 gene or a scramble control plasmid. Forty-eight hours after
trans-fection, 10 μg/ml blasticidin S (Gibco, Fisher Scientific GTF AB) was added to the cells. After two weeks of selec-tion with blasticidin S, the resistant MEFs were cloned, yielding three Ntn1 knockout MEF clones together with four scramble wild-type control MEF clones and four Neo1 knockout MEF clones together with four scramble wild-type control MEF clones. The Ntn1 knockout MEF clones were then transduced with adenovirus carrying either Cre recombinase or control to create Lrig-null MEFs as previously described26.
Western blot analysis.
Cells were seeded in 6- or 12-well plates the day before stimulation with netrin-1 and BMP4. On the day of stimulation, the cells were starved in FBS-free media for an hour prior to stimulation with 10 ng/ml BMP4 and 0.25 μg/ml netrin-1. After one hour of stimulation, the cells were washed with PBS and lysed with lysis buffer (Invitrogen, Fisher Scientific GTF AB) containing a protease inhibitor cocktail (Roche Diagnostics Scandinavia AB, Bromma, Sweden) and the phosphatase inhibitor PhosSTOP (Roche Diagnostics Scandinavia AB). The cell lysates were kept on ice for 30 min and centrifuged at 20,800×g for 10 min at 4 °C. The clear supernatant was subjected to SDS-PAGE using 3–8% Tris–acetate gels (#EA03752, Invitrogen, Fisher Scientific GTF AB) followed by transfer onto nitrocellulose or PVDF membranes (Bio-Rad Laboratories AB, Solna, Sweden). The membranes were blocked using Odyssey blocking buffer (LI-COR Biosciences GmbH, Bad Homburg, Germany). The blocked membranes were then incubated with the primary antibodies at room temperature for an hour. Thereafter, the membranes were washed three times with TBST (20 mM Tris, 150 mM NaCl, 0.1% Tween 20), incubated with the fluorescent secondary antibodies for an hour at room temperature and then washed again three times with TBST. The fluorescent bands were analyzed using the Odyssey CLx imaging system (LI-COR Biosciences GmbH).Adipogenesis assay.
The adipogenesis assay has been described elsewhere26. Briefly, the MEFs were treatedwith an adipogenic cocktail with or without 0.3 μg/ml netrin-1 for 9 days. Then, the cells were fixed, and the adipocytes were stained using Oil Red O (Sigma-Aldrich Sweden AB). The Oil Red O-stained cells were quan-tified in a Spectramax i3x plate reader (Molecular Devices, San Jose, CA, USA) using Softmax Pro 7 software (Molecular Devices) as described elsewhere26.
Alkaline phosphatase activity assay.
For the alkaline phosphatase (ALP) activity assay, 3,000 ATDC5 cells were seeded per well in a 96-well microtiter plate and cultured overnight. The next day, the culture medium was replaced with DMEM:Ham′s F12 (1:1) containing 2 mM glutamine and supplemented with 2% FBS, 2 µg/ml heparin (Sigma Aldrich Sweden AB, #H3149), and 50 μg/ml gentamicin. BMP4, netrin-1, or noggin was added at different concentrations as indicated in the Results section. After 72 h of incubation, the cells were washed with PBS, and the ALP activity assay was carried out using a colorimetric kit (Abcam, Sweden, #ab83369) according to the manufacturer’s guidelines.Statistical analyses.
All the data are presented as the averages of three or more independent experiments with standard deviations. Statistical comparisons were performed using a two-sided Student’s t-test or a one-way analysis of variance (ANOVA) with multiple comparisons using Dunnett’s test (GraphPad Prism, version 5.0), and a p-value of less than 0.05 was considered statistically significant.Results
Exogenously added netrin‑1 inhibits BMP signaling in wild‑type MEFs.
To investigate whether netrin-1 regulates BMP signaling in MEFs, netrin-1 was cross-titrated against BMP4, BMP6, or BMP9, and the BMP response was analyzed via a cellular phospho-Smad1/5 assay (Fig. 1a–c). Clearly, exogenously added netrin-1 inhibited BMP4- and BMP6-induced signaling in a dose-dependent manner but not BMP9-induced signaling. The IC50 for the inhibitory effect of netrin-1 at 2.5 ng/ml BMP4 was approximately 100 ng/ml (Fig. 1a). To investigate the kinetics of netrin inhibition, netrin-1 was added at different time points before, with, or after the initiation of BMP stimulation (Fig. 1d). There was a stronger inhibition the earlier netrin-1 was added to the cells; however, the addition of netrin-1 after the initiation of BMP4 stimulation also inhibited signaling. To investigate whether the observed inhibition of Smad1/5 phosphorylation translated into altered gene expression, BMP4-induced Id1 expression was assessed through qRT-PCR (Fig. 1e). Obviously, the BMP4-induced expres-sion of Id1 was also inhibited by netrin-1.Endogenously expressed netrin‑1 functions as a relevant BMP signaling‑modulator in MEFs
and interacts with LRIG proteins in a mutually inhibitory manner.
To investigate whether endog-enously expressed netrin-1 affects BMP signaling in MEFs, we generated Ntn1-null (Ntn1−/−) MEFs (Fig. S1). Because Lrig3 has been shown to interact genetically with Ntn15, we generated Ntn1-null MEFs both on an Lrigwild-type background and on an Lrig-null (Lrig1−/−;Lrig2−/−;Lrig3−/−) background. Clearly, the Ntn1-null MEFs showed increased BMP4 sensitivity compared to the wild-type MEFs (Fig. 1f). The increased BMP sensitivity in Ntn1−/− MEFs was not the result of increased Bmpr2, Acvr1, or Smad1 expression levels; rather, these signal-ing mediators showed insignificant trends toward lower expression levels (Fig. S2a–d). The Lrig1 and Lrig3 levels were not altered in Ntn1−/− MEFs (Fig. S3a–d), nor were the netrin-1 levels altered in Lrig-null MEFs (Fig. S3e,f). Lrig-null MEFs displayed decreased BMP sensitivity compared to wild-type MEFs (Fig. 1f), as was recently shown elsewhere26. The MEFs with combined deficiency of Ntn1 and Lrig (Ntn1−/−;Lrig1−/−;Lrig2−/−;Lrig
3−/−) showed an intermediate BMP sensitivity that was comparable to the BMP sensitivity of the wild-type MEFs (Fig. 1f). This result showed that endogenously expressed netrin-1 is a relevant negative regulator of BMP sign-aling that balances the BMP-promoting activities of Lrig proteins in MEFs. To further investigate the mutually
inhibitory interactions between netrin-1 and LRIG proteins, the pSmad1/5 response was analyzed in LRIG1- or
LRIG3-inducible Ntn1-/;Lrig1−/−;Lrig2−/−;Lrig3-/– MEFs (Fig. S1b,c) with various levels of LRIG protein induction
that had been treated with BMP4 and different concentrations of netrin-1 (Fig. 1g,h). This experiment showed that netrin-1 was able to suppress BMP4 signaling in a dose-dependent manner, both in the absence and in the presence of the previously shown BMP4-promoting activities of LRIG1 and LRIG3, further documenting the mutually inhibitory interaction between netrin-1 and LRIG proteins on BMP4 signaling strength.
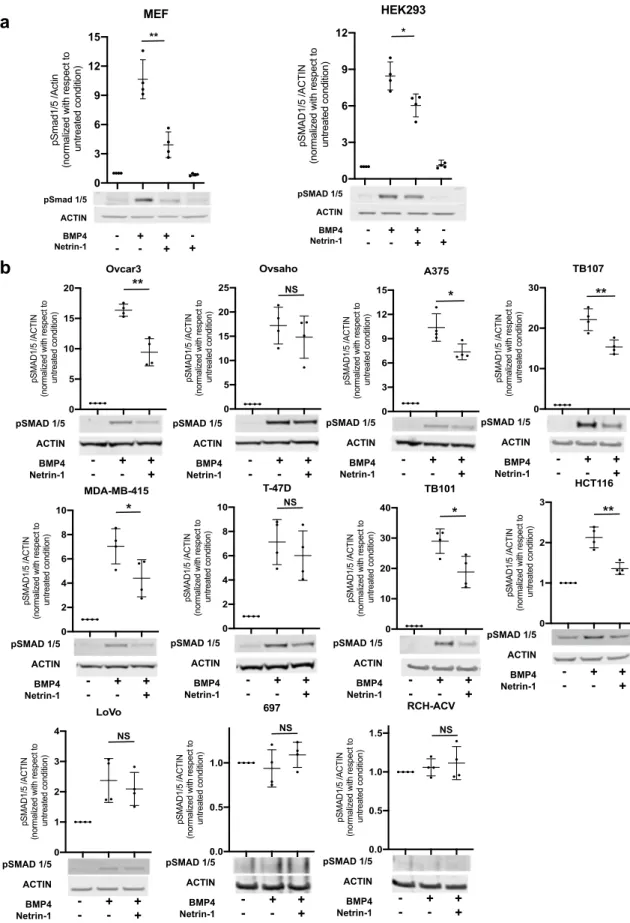
Netrin‑1 suppresses BMP signaling in various cell types.
To investigate the generality of the observed netrin-1-induced suppression of BMP signaling, a panel of mammalian cell lines consisting of an MEF line together with twelve human cell lines was evaluated to determine their sensitivity to netrin-1-mediated inhibition. The human cell lines were chosen to represent different tissues of origin. The cells were treated with BMP4 in the presence or absence of netrin-1 for 60 min, and the pSMAD1/5 levels were analyzed by Western blot (Fig. 2). MEFs and HEK293 cells were also treated with netrin-1 alone (Fig. 2a); however, because treatment with netrin-1 alone had no effect on pSmad1/5 levels in MEFs or HEK293 cells, ‘netrin-1 only’ treatment was not assessed in the other cell lines (Fig. 2b). The pre-B acute lymphocytic leukemia cell lines 697 and RCH-ACV did not respond to BMP4 treatment with increased pSMAD1/5 levels and thus could not be evaluated for pos-sible inhibition by netrin-1. Of the eleven cell lines that responded to BMP4, eight were significantly inhibited by netrin-1, including the MEF line, the ovarian cancer cell line Ovcar-3, the malignant melanoma cell line A375, the breast cancer cell line MDA-MB-415, the human embryonic kidney cell line HEK293, the glioblastoma cell lines TB101 and TB107, and the colorectal cancer cell line HCT116 (Fig. 2). Thus, netrin-1 inhibited BMP sign-aling in a general manner, affecting mouse and human cells of various tissues of origin.Netrin‑1‑induced inhibition of BMP signaling in MEFs is dependent on neogenin.
To address the role of neogenin in netrin-1-induced inhibition of BMP signaling in MEFs, Neo1 was inactivated through CRISPR/Cas-9 (Fig. S5). The resulting Neo1−/− MEFs showed reduced sensitivity to low concentrations of BMP4 (Fig. 3a). The Lrig1, Lrig3, and netrin-1 levels were unaltered in the Neo1-deficient MEFs (Fig. S5a–d). Intrigu-ingly, the exogenous addition of netrin-1 to Neo1−/− MEFs did not affect their pSmad1/5 response to low or high concentrations of BMP4 (Fig. 3a). Neogenin levels are increased in Ntn1-deficient mice27. Similarly, ourNtn1−/− MEFs showed increased neogenin levels, as monitored by immunoblotting (Fig. 3b). Lrig-null MEFs showed a less pronounced increase in neogenin levels after Ntn1 ablation than Lrig wild-type MEFs (Fig. 3b). To investigate whether the neogenin levels were regulated by BMP signaling per se, MEFs were treated with a BMP4 concentration that induces a robust pSmad1/5 response (10 ng/ml for 60 min) followed by immunoblotting. Clearly, this BMP4 stimulus did not affect the apparent neogenin levels, as determined through immunoblot-ting (Fig. S5e). The exogenous addition of recombinant netrin-1 to Ntn1−/− MEFs resulted in a dose-dependent
Figure 1. Netrin-1 inhibits BMP signaling in MEFs. (a–c) Wild-type MEFs were starved in serum-free medium
and then treated with various concentrations of BMP4, BMP6, or BMP9 together with various concentrations of netrin-1 for an hour. Then, BMP signaling was assessed via the analysis of nuclear pSmad1/5 levels. The graphs show the average means with error bars showing the standard deviations of three independent experiments performed in duplicate (one-way ANOVA: nsp ≥ 0.05; #p < 0.05; ##p < 0.01; ###p < 0.001). (d) Wild-type MEFs were treated with various concentrations of netrin-1 at different times before, with, or after the addition of BMP4 [5 ng/ml] to the wells. One hour after the addition of BMP4, BMP signaling was assessed via the analysis of nuclear pSmad1/5 levels. The x-axis shows the time at which netrin-1 was added relative to the addition of BMP4: negative values indicate the addition of netrin-1 before the addition of BMP4, ‘0′ indicates the simultaneous addition of netrin-1 and BMP4, and positive values indicate the addition of netrin-1 after the addition of BMP4. The graph shows the average means with the standard deviations of four independent experiments performed in duplicate (one-way ANOVA: ####p < 0.0001). (e) Id1 mRNA expression levels in response to BMP4 and netrin-1. MEFs were treated, or not, with 20 ng/ml BMP4 and/or 0.25 μg/ml netrin-1 for x hours followed by analysis of RNA expression levels through real-time qRT-PCR. Shown are the Id1 levels normalized to the Rn18s levels. The graph represents the average means with standard deviations of four independent experiments performed in duplicate (Student’s t-test: **p < 0.01; ***p < 0.001). (f) MEFs of different Ntn1 and Lrig genotypes (Ntn1+/+ or Ntn1−/− and Lrig-wild-type or Lrig-null [Lrig1−/−;Lrig2−/−;Lrig3−/−], respectively) were treated with various concentrations of BMP4, and BMP signaling was assessed via analysis of the nuclear pSmad1/5 levels. The graph shows the means with the standard deviations of four Ntn1+/+ ;Lrig-wild-type or Ntn1+/+;Lrig-null biological replicates and three Ntn1−/−;Lrig-wild-type or Ntn1−/−;Lrig-null biological replicates determined through three independent experimental repeats. The error bars represent the standard deviations (Student’s t-test: **p < 0.01; ****p < 0.0001. Colors of asterisks represent the respective genotype, according to the graph symbols, compared to Ntn1+/+;Lrig-WT). (g, h) Cross-titration of netrin-1 and LRIG1 (g) or LRIG3 (h). LRIG1- or LRIG3-inducible Lrig-null and Ntn1−/− MEFs were treated with different concentrations of doxycycline (between 0 and 1 μg/ml) to induce various levels of LRIG protein expression. BMP signaling was induced using 5 ng/ml BMP4 together with different amounts of netrin-1 (between 0 and 1 μg/ml) for an hour. The fluorescence response for the nuclear pSmad1/5 levels induced by BMP4 is plotted on the y-axis. The doxycycline-induced expression levels of FLAG-tagged LRIG1 or LRIG3 were measured and plotted on the x-axis. Each dot represents the quantification of pSmad1/5 and LRIG-FLAG from each measurement. The graphs show data obtained from three independent experiments performed in duplicate for each concentration of netrin-1 and doxycycline. The R2 values for the scattered plots are tabulated in Tables 1 and 2.
(Fig. 3c) and time-dependent (Fig. 3d) decrease in neogenin levels in both Lrig wild-type and Lrig-null MEFs. The induced expression of human LRIG1 or LRIG3 but not LRIG2 in Ntn1 wild-type MEFs resulted in increased neogenin levels (Fig. 3e–g). This result was recapitulated in Ntn1−/− MEFs with regard to the effect of LRIG1 but not LRIG3; i.e., the Ntn1−/− MEFs showed significantly enhanced neogenin expression in response to the induced expression of LRIG1 (Fig. S6a) but not in response to the induced expression of LRIG3 (Fig. S6b).
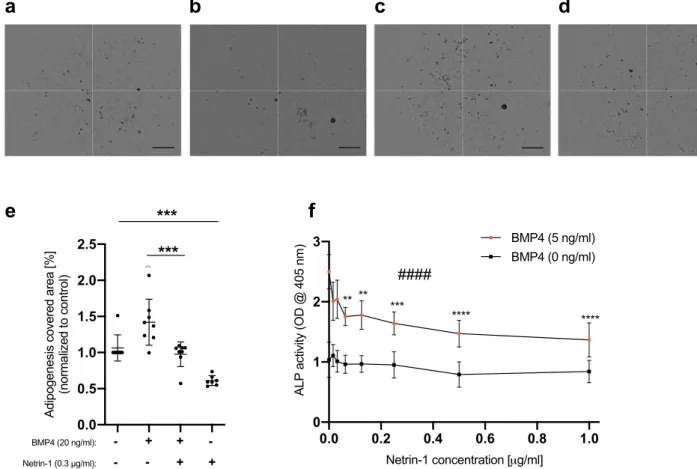
Netrin‑1 suppresses adipogenesis and chondrogenesis in vitro.
To investigate whether netrin-1 could regulate physiological processes in which BMP signaling plays important roles, we chose to study adi-pogenesis and chondrogenesis in vitro because these processes have been shown to depend on BMP signaling, albeit to our knowledge, the role of netrin-1 has not been addressed previously. Clearly, exogenously added recombinant netrin-1 was able to inhibit adipogenesis of MEFs as assessed through Oil Red O staining, both in the presence and in the absence of exogenously added BMP4 (Fig. 4a–e). Of note, also in the absence of added BMP4, the cell culture medium contained low levels of BMPs that are present in FBS, which is enough to drive basal adipogenesis26,37,38. Also chondrogenesis of BMP4-stimulated ATDC5 cells as assessed with an alkalinephosphatase activity assay was inhibited by netrin-1 (Figs. 4f and S8). As a control, the well-characterized BMP inhibitor noggin also inhibited BMP4-induced chondrogenesis of ATDC5 cells (Fig. S8b).
Discussion
Despite the large number of investigations addressing the functions of netrins, to the best of our knowledge, a role of netrins in the regulation of BMP signaling has not been proposed previously. Our discovery showing that netrin-1 negatively regulated BMP signaling in a variety of cell types may explain many previous observations regarding the developmental and physiological functions of this protein.
Based on our discovery that netrin-1 inhibited BMP signaling, including via a mutually inhibitory inter-action with the BMP-promoting activities of LRIG1 and LRIG3, together with previous work on inner ear development5,6,28, we propose that the molecular function of netrin-1, as well as the molecular functions of Lrig1
and Lrig3, in semicircular canal formation is to fine-tune BMP signaling. Similarly, the observed inhibition of adipogenesis and chondrogenesis in vitro is consistent with a function of netrin-1 in modulating BMP signaling during cell differentiation. Taken together, our results suggest that the regulation of BMP signaling might be a prominent feature of the developmental and physiological functions of netrin-1 and, possibly, other netrins.
Interestingly, we observed a commonality in the specificities of the BMP signal-modulating activities of netrin-1 and LRIG proteins. That is, netrin-1 suppressed the signaling that was induced by BMP4 and BMP6 but not the signaling that was induced by BMP9; these results reflect the BMP-promoting functions of Lrig proteins, which extend to BMP4 and BMP6 but not to BMP926. This commonality in BMP ligand specificity may indicate
that netrin-1 and LRIG proteins act through a common molecular machinery. However, our observation that netrin-1 and LRIG proteins also regulated BMP signaling in the absence of their mutually inhibitory counter-parts suggests that netrin-1 and LRIG proteins function autonomously of each other. To resolve the underlying mechanisms, it will be important to elucidate the composition of the molecular machinery involved.
Regarding the netrin receptor(s) involved, we found that neogenin was required for the BMP inhibitory func-tion of netrin-1 in MEFs. Neogenin is a well characterized receptor for netrin-1 as well as a coreceptor, together with the repulsive guidance molecules, for BMPs29,30. Hence, neogenin is well poised to integrate netrin and BMP
signaling. Although the effect of netrin-1 on BMP signaling in MEFs was strictly dependent on neogenin, a role for other netrin receptors in the regulation of BMP signaling in MEFs or other cell types cannot be ruled out. For example, the neogenin homolog DCC is not expressed in MEFs (unpublished observation) but may play a role similar to neogenin in other cell types. UNC5B has been shown to activate BMP signaling during osteogenic differentiation31, although a possible regulatory role of netrins in this context was not investigated. Another study
showed that two out of three netrin receptors (neogenin, Unc5b, and/or A2b) have to be inactivated to rescue MC3T3-E1 cells from netrin-1-induced inhibition of BMP4-induced osteoblast differentiation7, further
support-ing a connection between netrin-1 and BMP signalsupport-ing as well as demonstratsupport-ing a functional redundancy among the netrin receptors. Future studies will reveal the roles of different netrin receptors in the regulation of BMP signaling. In parallel to its inhibition of BMP signaling, netrin-1 downregulated neogenin protein expression levels both in a genetic manner, as evident from the upregulation of neogenin seen in Ntn1−/− cells, as well as
Table 1. The coefficient of determination (r2) for the BMP4 response (pSmad1/5 level) against the LRIG1- FLAG expression levels at different netrin-1 concentrations as shown in Fig. 1g.
Netrin-1 [μg/ml] 0 0.0625 0.125 0.25 0.5 1.0
r2 0.7384 0.8220 0.7754 0.7473 0.7580 0.6596
Table 2. The coefficient of determination (r2) for the BMP4 response (pSmad1/5 level) against the LRIG3- FLAG expression levels at different netrin-1 concentrations as shown in Fig. 1h.
Netrin-1 [μg/ml] 0 0.0625 0.125 0.25 0.5 1.0
Figure 2. Netrin-1 inhibits BMP signaling in various mammalian cell lines. Western blot analysis showing the inhibitory effect of netrin-1 on the BMP4-induced pSmad1/5 levels in cell lines of different origins. (a) MEFs and human embryonic kidney (HEK293) cells. (b) Human ovarian cancer (Ovcar3 and Ovsaho), malignant melanoma (A375), breast cancer (MDA-MB-415 and T-47D), glioblastoma (TB101 and TB107), colorectal carcinoma (HCT116 and LoVo), and acute lymphoblastic pre-B cell leukemia (697 and RCH-ACV). Representative Western blots of pSMAD1/5 and actin after the cells were treated with BMP4 and netrin-1 are shown together with the quantifications of the pSMAD1/5/actin ratios. Uncropped blots are shown in Fig. S4. Shown are the means and individual values of four independent experiments (Student’s t-test: NSp ≥ 0.05; *p < 0.05; **p < 0.01).
Figure 3. Neogenin is required for netrin-1-induced inhibition of BMP signaling, and its expression levels
are regulated by netrin-1 and LRIG proteins. (a) Effects of netrin-1 on BMP signaling in Neo1 wild-type (Neo1+/+) and Neo1-deficient (Neo1−/−) MEFs. The cells were treated with different concentrations of BMP4 in the presence or absence of 0.25 μg/ml netrin-1. Signaling was analyzed using a pSmad1/5 assay. The graph shows the average means with the standard deviations of four biological replicates. (b) Neogenin expression levels in MEFs of different genotypes (Ntn1+/+ or Ntn1−/− and Lrig-wildtype or Lrig-null [Lrig1−/−; Lrig2−/−;
Lrig3−/−]). Neogenin and actin levels were analyzed by Western blotting. The graph represents the average means with standard deviations of band intensity ratios (neogenin/actin) from four Ntn1+/+;Lrig-wild-type biological replicates and three Ntn1−/−;Lrig-wild-type or Ntn1−/−;Lrig-null biological replicates that were determined with three independent experiments. (c, d) Concentration-dependent (c) and time-dependent (d) effects of netrin-1 treatment on neogenin expression levels in Ntn1−/−;Lrig-wild-type and Ntn1−/−;Lrig-null MEFs. Representative blots and graphs showing the average means with standard deviations of four independent experiments are shown (one-way ANOVA: #p < 0.05; ###p < 0.001; ####p < 0.0001. Post-hoc test with multiple comparisons [compared to netrin-1, 0 ng/ml] adjusted p-value: nsp ≥ 0.05; *p < 0.05; **p < 0.01; ***p < 0.001; ****p < 0.0001). (e–g) Effects of induced expression of LRIG1 (e), LRIG2 (f), and LRIG3 (g) on neogenin expression levels. LRIG expression was induced through the treatment of LRIG-inducible MEFs with 100 ng/ml of doxycycline, overnight. Neogenin and actin levels were analyzed using Western blotting. Uncropped blots are shown in Fig. S7. Representative blots and graphs representing average means with standard deviations of four independent experiments are shown. (Student’s t-test; *, p < 0.05; **, p < 0.01; ***, p < 0.001. Colors of asterisks in (a) represent the respective genotype, according to the graph symbols, compared to Neo1+/+).
◂
Figure 4. Netrin-1 inhibits adipogenesis and chondrogenesis in vitro. (a–e) Netrin-1 inhibits MEF
adipogenesis. Wild-type MEFs were induced with an adipogenic cocktail together with or without 20 ng/ml BMP4 and/or 0.3 µg/ml netrin-1. After nine days, the cells were fixed, stained with Oil Red O, and imaged, and the staining was quantified. (a–d) Representative micrographs of MEFs treated with the adipogenic cocktail together with (a) no further additions, (b) BMP4, (c) BMP4 and netrin-1, and (d) netrin-1. Scale bars, 0.6 mm. (e) Quantification of the Oil Red O-stained areas as outlined in a-d. Shown are the means and individual values of eight independent experiments. (Student’s t-test: ***p < 0.001). (f) Netrin-1 inhibits chondrogenesis. ATDC5 cells were stimulated with BMP4 alone or in combination with different concentrations of netrin-1 for 72 h. Thereafter, chondrogenesis was assessed via an alkaline phosphatase (ALP) assay. The graph represents the average means with standard deviations of four independent experiments performed in duplicate. (One-way ANOVA: ####p < 0.0001. Post-hoc test with multiple comparisons [compared to netrin-1, 0 ng/ml] adjusted p-value: **p < 0.01; ***p < 0.001; ****p < 0.0001).
biochemically, as seen in the cellular response to recombinant netrin-1 protein. These observations are consistent with previous reports showing that Ntn1−/− mice display increased neogenin and DCC levels27 and that exogenous
netrin-1 downregulates the DCC levels in embryonic cortical neurons32. In contrast, LRIG proteins upregulated
the neogenin levels in parallel with their enhancement of BMP signaling. This is consistent with a previous report that showed a physical interaction between Lrig proteins and neogenin, which was associated with the protection of neogenin from proteolytic cleavage by ADAM1733. To what degree the netrin-1- and LRIG-mediated effects
on neogenin expression levels represent causes or consequences of signal regulation remains to be investigated. In this regard, it is intriguing that all three Lrig proteins (Lrig1-3) seem to protect neogenin from proteolytical degradation33, whereas only LRIG1 and LRIG3, but not LRIG2, promote BMP signaling26.
Several of the netrin receptors, including DCC, neogenin, UNC5A, UNC5B, UNC5C, and UNC5D, have been proposed to function as so-called ‘dependence receptors’, i.e., receptors that mediate pro-apoptotic signals in the absence of ligand. Here, we propose an alternative hypothesis to account for some of the published obser-vations pertaining to this concept. We suggest that in the absence of their netrin ligands, dependence receptors may promote basal BMP signaling, as has been shown for neogenin and UNC-4030,34,35, rather than exerting
‘ligand-independent’ signaling. Constitutive low-level BMP signaling is possible because different BMPs are widely expressed in mammalian tissues and are also present in FBS-containing cell culture media36,37. Then if,
as shown here, netrin-1 inhibits BMP signaling at low BMP concentrations, we propose that some of the cellular effects caused by netrin-1 may be due to its negative regulation of BMP signaling rather than, or in addition to, its interruption of the intrinsic ligand-independent signaling of dependence receptors.
Netrin-1 has also been reported to be overexpressed and to promote cancer in many other contexts. We noticed an intriguing reciprocal relationship between the reported effects of netrin-1 and BMP signaling on several types of cancer cells. For example, although netrin-1 promotes the development, spread, metastasis, and stemness of breast cancer, colorectal cancer, and glioma cells, BMP signaling reciprocally suppresses these cancer cell types and processes, at least under some circumstances38–42. Thus, our results presented herein, which
reveal a previously unrecognized function of netrin-1 as a suppressor of BMP signaling, are consistent with a tumor-promoting function of netrin-1 that is achieved via the suppression of BMP signaling. This function may warrant further investigation.
In conclusion, our demonstration that netrin-1 regulates BMP signaling via its receptor neogenin sheds new light on previous observations and opens up new areas for research. The urgent questions to address include the elucidation of the detailed molecular mechanisms involved and the delineation of the physiological processes that are directed by this regulatory mechanism.
Received: 8 September 2020; Accepted: 5 April 2021
References
1. Rajasekharan, S. & Kennedy, T. E. The netrin protein family. Genome Biol. 10(9), 239. https:// doi. org/ 10. 1186/ gb- 2009- 10-9- 239
(2009).
2. Lai Wing Sun, K., Correia, J. P. & Kennedy, T. E. Netrins: versatile extracellular cues with diverse functions. Development 138(11), 2153–2169. https:// doi. org/ 10. 1242/ dev. 044529 (2011).
3. Boyer, N. P. & Gupton, S. L. Revisiting Netrin-1: One who guides (Axons). Front. Cell Neurosci. 12, 221. https:// doi. org/ 10. 3389/ fncel. 2018. 00221 (2018).
4. Dun, X. P. & Parkinson, D. B. Role of netrin-1 signaling in nerve regeneration. Int. J. Mol. Sci. https:// doi. org/ 10. 3390/ ijms1 80304 91 (2017).
5. Abraira, V. E. et al. Cross-repressive interactions between Lrig3 and netrin 1 shape the architecture of the inner ear. Development
135(24), 4091–4099. https:// doi. org/ 10. 1242/ dev. 029330 (2008).
6. Hwang, C. H., Keller, J., Renner, C., Ohta, S. & Wu, D. K. Genetic interactions support an inhibitory relationship between bone morphogenetic protein 2 and netrin 1 during semicircular canal formation. Development https:// doi. org/ 10. 1242/ dev. 174748
(2019).
7. Sato, T. et al. Functional roles of netrin-1 in osteoblast differentiation. In Vivo 31(3), 321–328. https:// doi. org/ 10. 21873/ invivo. 11062 (2017).
8. Mediero, A., Ramkhelawon, B., Perez-Aso, M., Moore, K. J. & Cronstein, B. N. Netrin-1 is a critical autocrine/paracrine factor for osteoclast differentiation. J. Bone Miner. Res. 30(5), 837–854. https:// doi. org/ 10. 1002/ jbmr. 2421 (2015).
9. Yim, J. et al. Relationship between circulating netrin-1 concentration, impaired fasting glucose, and newly diagnosed type 2 diabetes. Front. Endocrinol. 9, 691. https:// doi. org/ 10. 3389/ fendo. 2018. 00691 (2018).
10. Yimer, E. M., Zewdie, K. A. & Hishe, H. Z. Netrin as a novel biomarker and its therapeutic implications in diabetes mellitus and diabetes-associated complications. J. Diabetes Res. https:// doi. org/ 10. 1155/ 2018/ 82505 21 (2018).
11. Taipale, T. et al. Fatty liver is associated with blood pathways of inflammatory response, immune system activation and prothrom-botic state in Young Finns Study. Sci. Rep. 8(1), 10358. https:// doi. org/ 10. 1038/ s41598- 018- 28563-y (2018).
12. Zhang, X. et al. Netrin-1 improves adipose-derived stem cell proliferation, migration, and treatment effect in type 2 diabetic mice with sciatic denervation. Stem Cell Res. Ther. 9(1), 285. https:// doi. org/ 10. 1186/ s13287- 018- 1020-0 (2018).
13. Bruikman, C. S., Zhang, H., Kemper, A. M. & van Gils, J. M. Netrin family: Role for protein isoforms in cancer. J. Nucleic Acids
https:// doi. org/ 10. 1155/ 2019/ 39471 23 (2019).
14. Mazelin, L. et al. Netrin-1 controls colorectal tumorigenesis by regulating apoptosis. Nature 431(7004), 80–84. https:// doi. org/ 10. 1038/ natur e02788 (2004).
15. Paradisi, A. et al. Netrin-1 up-regulation in inflammatory bowel diseases is required for colorectal cancer progression. Proc. Natl.
Acad. Sci. U S A. 106(40), 17146–17151. https:// doi. org/ 10. 1073/ pnas. 09017 67106 (2009).
16. Fitamant, J. et al. Netrin-1 expression confers a selective advantage for tumor cell survival in metastatic breast cancer. Proc. Natl.
Acad. Sci. USA 105(12), 4850–4855. https:// doi. org/ 10. 1073/ pnas. 07098 10105 (2008).
17. Ylivinkka, I. et al. Motility of glioblastoma cells is driven by netrin-1 induced gain of stemness. J. Exp. Clin. Cancer Res. 36(1), 9.
https:// doi. org/ 10. 1186/ s13046- 016- 0482-0 (2017).
18. Tu, T. et al. CD146 acts as a novel receptor for netrin-1 in promoting angiogenesis and vascular development. Cell Res. 25(3), 275–287. https:// doi. org/ 10. 1038/ cr. 2015. 15 (2015).
19. Sung, P. J. et al. Cancer-associated fibroblasts produce Netrin-1 to control cancer cell plasticity. Cancer Res https:// doi. org/ 10. 1158/ 0008- 5472. CAN- 18- 2952 (2019).
20. Mehlen, P. et al. The DCC gene product induces apoptosis by a mechanism requiring receptor proteolysis. Nature 395(6704), 801–804 (1998).
21. Negulescu, A. M. & Mehlen, P. Dependence receptors: The dark side awakens. FEBS J. 285(21), 3909–3924. https:// doi. org/ 10. 1111/ febs. 14507 (2018).
22. Todaro, G. J. & Green, H. Quantitative studies of the growth of mouse embryo cells in culture and their development into estab-lished lines. J Cell Biol. 17, 299–313 (1963).
23. Asklund, T. et al. Synergistic killing of glioblastoma stem-like cells by bortezomib and HDAC inhibitors. Anticancer Res. 32(7), 2407–2413 (2012).
24. Mao, F. et al. Lrig1 is a haploinsufficient tumor suppressor gene in malignant glioma. Oncogenesis 7(2), 13. https:// doi. org/ 10. 1038/ s41389- 017- 0012-8 (2018).
25. Herdenberg, C. et al. LRIG proteins regulate lipid metabolism via BMP signaling and affect the risk of type 2 diabetes. Commun.
Biol. 4(1), 90. https:// doi. org/ 10. 1038/ s42003- 020- 01613-w (2021).
26. Nilsson, J. et al. Cloning, characterization, and expression of human LIG1. Biochem. Biophys. Res. Commun. 284(5), 1155–1161.
https:// doi. org/ 10. 1006/ bbrc. 2001. 5092 (2001).
27. Bin, J. M. et al. Complete loss of netrin-1 results in embryonic lethality and severe axon guidance defects without increased neural cell death. Cell Rep. 12(7), 1099–1106. https:// doi. org/ 10. 1016/j. celrep. 2015. 07. 028 (2015).
28. Del Rio, T., Nishitani, A. M., Yu, W. M. & Goodrich, L. V. In vivo analysis of Lrig genes reveals redundant and independent func-tions in the inner ear. PLoS Genet. 9(9), e1003824. https:// doi. org/ 10. 1371/ journ al. pgen. 10038 24 (2013).
29. Zhou, Z. et al. Neogenin regulation of BMP-induced canonical Smad signaling and endochondral bone formation. Dev. Cell. 19(1), 90–102. https:// doi. org/ 10. 1016/j. devcel. 2010. 06. 016 (2010).
30. Healey, E. G. et al. Repulsive guidance molecule is a structural bridge between neogenin and bone morphogenetic protein. Nat.
Struct. Mol. Biol. 22(6), 458–465. https:// doi. org/ 10. 1038/ nsmb. 3016 (2015).
31. Hu, X. et al. UNC-5 netrin receptor B mediates osteogenic differentiation by modulating bone morphogenetic protein signaling in human adipose-derived stem cells. Biochem. Biophys. Res. Commun. 495(1), 1167–1174. https:// doi. org/ 10. 1016/j. bbrc. 2017. 11. 104 (2018).
32. Kim, T. H. et al. Netrin induces down-regulation of its receptor, Deleted in Colorectal Cancer, through the ubiquitin-proteasome pathway in the embryonic cortical neuron. J. Neurochem. 95(1), 1–8. https:// doi. org/ 10. 1111/j. 1471- 4159. 2005. 03314.x (2005). 33. van Erp, S. et al. Lrig2 Negatively regulates ectodomain shedding of axon guidance receptors by ADAM proteases. Dev. Cell. 35(5),
537–552. https:// doi. org/ 10. 1016/j. devcel. 2015. 11. 008 (2015).
34. Zhou, Z. et al. Neogenin regulation of BMP-induced canonical Smad signaling and endochondral bone formation. Dev. Cell 19(1), 90–102. https:// doi. org/ 10. 1016/j. devcel. 2010. 06. 016 (2010).
35. Tian, C. et al. The neogenin/DCC homolog UNC-40 promotes BMP signaling via the RGM protein DRAG-1 in C. elegans.
Devel-opment 140(19), 4070–4080. https:// doi. org/ 10. 1242/ dev. 099838 (2013).
36. Kodaira, K. et al. Purification and identification of a BMP-like factor from bovine serum. Biochem. Biophys. Res. Commun. 345(3), 1224–1231 (2006).
37. Herrera, B. & Inman, G. J. A rapid and sensitive bioassay for the simultaneous measurement of multiple bone morphogenetic proteins. Identification and quantification of BMP4, BMP6 and BMP9 in bovine and human serum. BMC Cell Biol. 10, 20. https:// doi. org/ 10. 1186/ 1471- 2121- 10- 20 (2009).
38. Eckhardt, B. L. et al. Activation of canonical BMP4-SMAD7 signaling suppresses breast cancer metastasis. Cancer Res. 80(6), 1304–1315. https:// doi. org/ 10. 1158/ 0008- 5472. CAN- 19- 0743 (2020).
39. Hardwick, J. C., Kodach, L. L., Offerhaus, G. J. & van den Brink, G. R. Bone morphogenetic protein signalling in colorectal cancer.
Nat. Rev. Cancer 8(10), 806–812. https:// doi. org/ 10. 1038/ nrc24 67 (2008).
40. Piccirillo, S. G. et al. Bone morphogenetic proteins inhibit the tumorigenic potential of human brain tumour-initiating cells. Nature
444(7120), 761–765 (2006).
41. Lee, J. et al. Epigenetic-mediated dysfunction of the bone morphogenetic protein pathway inhibits differentiation of glioblastoma-initiating cells. Cancer Cell 13(1), 69–80. https:// doi. org/ 10. 1016/j. ccr. 2007. 12. 005 (2008).
42. Caja, L. et al. Snail regulates BMP and TGFβ pathways to control the differentiation status of glioma-initiating cells. Oncogene
37(19), 2515–2531. https:// doi. org/ 10. 1038/ s41388- 018- 0136-0 (2018).
Acknowledgements
This work was supported by grants from the Kempe Foundations (JCK-1829), the Swedish Cancer Society (180656), and the Lion’s Cancer Research Foundation at Umeå University (LP20-2228), Umeå University, and through the regional agreement between Umeå University and Västerbotten County Council on cooperation in the fields of medicine, odontology and health.
Author contributions
C.H. and H.H. conceived the study. A.A. and C.H. performed the experiments. A.A., C.H., and H.H. analyzed the data and wrote the manuscript.
Competing interests
The authors declare no competing interests.
Additional information
Supplementary Information The online version contains supplementary material available at https:// doi. org/ 10. 1038/ s41598- 021- 87949-7.
Correspondence and requests for materials should be addressed to H.H. Reprints and permissions information is available at www.nature.com/reprints.
Publisher’s note Springer Nature remains neutral with regard to jurisdictional claims in published maps and
Open Access This article is licensed under a Creative Commons Attribution 4.0 International
License, which permits use, sharing, adaptation, distribution and reproduction in any medium or format, as long as you give appropriate credit to the original author(s) and the source, provide a link to the Creative Commons licence, and indicate if changes were made. The images or other third party material in this article are included in the article’s Creative Commons licence, unless indicated otherwise in a credit line to the material. If material is not included in the article’s Creative Commons licence and your intended use is not permitted by statutory regulation or exceeds the permitted use, you will need to obtain permission directly from the copyright holder. To view a copy of this licence, visit http:// creat iveco mmons. org/ licen ses/ by/4. 0/.