http://www.diva-portal.org
This is the published version of a paper published in Metallurgia Italiana.
Citation for the original published paper (version of record):
Jarfors, A E. (2016)
Yielding and failure of hot chamber die cast thin-walled AZ91D.
Metallurgia Italiana, 108(6): 53-56
Access to the published version may require subscription.
N.B. When citing this work, cite the original published paper.
Open Access journal
Permanent link to this version:
Pressocolata
YIELDING AND FAILURE OF HOT
CHAMBER DIE CAST THIN-WALLED
AZ91D
Anders E. W. Jarfors– Jönköping University, School of Engineering, Department of Materials and Manufacturing, Jönköping, Sweden
Thin-walled components in AZ91D magnesium are commonly cast using hot chamber die casting. AZ91D mechanical properties commonly show scatter and its low critically resolved shear stress cause early yield
with an ill-defined yield point. This may result in large differences between the true yield point or proportionality limit and the off-set proof stress. The current study takes a look at this and its relation to the
failure of the component. The material investigated was a hot chamber die cast material with a wall thickness of 0.8mm. Tensile tests were made and the proportionality limit and off-set proof stress was established as well as elongation to failure and tensile strength. The overall average off-set proof stress was 154 MPa and the overall proportionality limit was 63 MPa resulting in a typical property Stress Gap of
91MPa. This difference varied from 65MPa up to 105MPa. The Apparent Toughness was also evaluated The Stress Gap and Apparent Toughness was analysed and the influence of process parameters
established.
KEYWORDS: MAGNESIUM – AZ91D– HOT CHAMBER DIE CASTING – PROCESS PARAMETERS –
YELDING – ELONGATION – TOUGHNESS
INTRODUCTION: HEADING REWRITE THIS SECTION
Many cast AZ91D thin-walled components have applications in electronics and handheld equipment due to the alloy high specific strength and good castability. This has made AZ91D the most widely used magnesium alloy.[1][2] The mechanical properties of AZ91D commonly display significant scatter.[3] Lee [4] concluded that yield strength of AZ91D alloys exhibits a linear dependence on microporosity whilst UTS and elongation show an inverse parabolic relationship with microporosity. In these previous studies, proof stress was used and the not the proportionality limit. In an alloy with an HCP structure such as AZ91D a low critically resolved shear stress will cater for early plastic flow, well below the off-set yield
point hampering ductility.[5] Significant plastic flow will thus occur between the proportionality limit and the off-set proof stress and depend strongly on microstructure and state of the material after casting. [3] The aim of the current paper is to study how the Stress Gap between the proportionality limit and the off-set yield strength, as well as fracture is influenced by the casting process to bridge the gap between materials science and production technology.
EXPERIMENTAL
Material and sample manufacturing
A Frech 80T, Hot-Chamber Die-Casting machine was used to cast tensile test bars, Fig. 1 (0.8mm thick and 200mm long). The process parameters were varied according to a D-optimal Design of Experiment approach, using Design-ExpertTM and Analysis of Variance (ANOVA) was used with
regression analysis for the evaluation of the experimental results. The parameters investigated, Tab. 1, were: A: Injection speed 1 (speed during filling runners to the gate), B: Injection speed 2 (speed during filling of the actual part), C: Cooling time, D: Moving side, E: Fix side temperature and
Fig.1 – Example of cast component. The tensile bars (left and right most parts cast in this 4 cavity tool was used
Die-casting
F: Melt temperature. Temperature of the fix side was always kept higher than for the moving side. For each setting of the 32 different settings, 10 dummy shots were made, followed by 10 shots to generate the samples.
Tab. 1 - : Investigated process parameter window PROCESS PARAMETER A: Injection speed 1 [%] B: Injection speed 2 [%] C: Cooling time [s] D: Moving side temperature [oC] E: Fix side temperature [oC] F: Melt temperature [oC] 5-10 20-50 2-6 104-166 160-192 637-650 Materials characterisation
Tensile testing was made using a Zwick-RoellTMtensile testing apparatus according to ASTM B557. From the
engineering stress-strain curves, true stress and strain were evaluated and is used throughout the paper. The linear proportionality limit and the 0.2% off-set proof stress was evaluated, Fig. 2a.The ultimate tensile stress and failure strain was also evaluated. The fracture surfaces were investigated under SEM (JEOL JSM-7001F) and the fracture surface porosity, Fig. 2b, was determined using a rectangular grid method according to ASTM E652-11 using a 100 point grid.
Fig.2 – Example from sample id 12-1 a) True stress-true strain curve and b) fracture surface of sample id 12-1 with a measured porosity in the fracture surface of 0.1 with the main pores indicated by circles.
RESULTS AND DISCUSSION
The Stress Gap between the proportionality limit and the off-set proof stress
The average value for the proportionality limit was 63±6MPa, while the average off-set proof stress was 154±2MPa, resulting in average Stress Gap of 91MPa. The off-set proof stress was in the expected range for AZ91D.[2] The average Young’s modulus was 38.0±1.3GPa MPa, which is 15% below than the expected value (45GPa). [6] This difference was related to porosity, as the measured average fraction porosity was 0.11±0.02 in the fracture surface. Young’s modulus and off-set proof stress both decreased with porosity which also was found by Lee [4]. This was not the case for the proportionality limit. In the evaluation of the set proof stress, the Young’s modulus is important as a reduction of Young’s modulus would shift the off-set proof stress towards higher strain, allowing for increased hardening between the proportionality limit and the off-set proof stress with an increased Stress Gap as a result. This was not the case in the current study as the Stress Gap increased with increasing Young’s modulus, hence the Stress Gap was due to changes in the material and not caused by the method of evaluation. The origin of the Stress Gap change must thus be a result of the casting conditions, Tab. 1. Analysis of Variance (ANOVA) was used determine statistically significant factors for the Stress Gap. The ANOVA analysis, Tab. 2, showed that a significant model was possible to create and that the significant factors were A: Injection speed 1 and B: Injection speed 2. Furthermore, the interactions between A: Injection speed 1 and C: Cooling time (AC), as well as the interaction between A: Injection speed 1 and E: Melt temperature (AE). C: Cooling time itself was not fully statistically significance, nor could it be disregarded from. E: Melt temperature was not significant from a statistical point of view but was kept for model hierarchy as the interaction AE was significant. The temperature of the melt entering the cavity was however important but the effect of the factor E: Melt
0 50 100 150 200 250 0,0000 0,0050 0,0100 0,0150 0,0200 0,0250 0,0300 Str es s [ MP a] Strain [m/m]
Stress-Strain Curve Sample 12-1
True Stress Yield Point Guide Proof Stress Guide
Pressocolata
temperature was masked by temperature losses in the gooseneck and nozzle during. This temperature loss is governed by A: Injection speed 1 where a low speed decreases temperature and the Stress Gap. The same trend was seen for E: Melt temperature, Similarly, the interaction AC resulted in that a high A: Injection speed 1 eliminated the effect of C: Cooling time, while a low A: Injection speed 1 resulted in a strong effect where a short C: Cooling time gave a small Stress Gap and a long C: Cooling time resulted in a larger Stress Gap, Fig. 3a and 3b. The variation in proportionality limit was more than 53% of the average value while the corresponding number for the proof stress was less than 19% suggesting that the proportionality limit was the main cause of the variation. The proportionality limit would be sensitive to residual stresses and plastic deformation while the proof stress depends on the onset of significant plastic deformation based on dislocation generation and movement [3]. The most dominant effect was that of C: Cooling time through the interaction AC. The die temperature was significantly higher than the surrounding air. Thermal stability of AZ91D, in the temperature range 150oC to 200oC,will readily plastically deformation, and creep / relaxationprocesses are rapid. Stress relaxation during in die cooling would reduce residual plastic deformation in the tensile bar with an increased the Stress Gap as a result.
Tab. 2 – :Analysis of the Stress Gap ANOVA TABLE GAP
Parameter SquaresSum of Df Mean Square F-Value Prob>F Comments
Model 1934.90 6 322.48 12.93 0.0010 Significant
A-Injection speed 1 392.57 1 392.57 15.74 0.0041 Sgnificant B-Injection speed 2 1488.82 1 1488.82 59.71 < 0.0001 Significant
C-Cooling time 102.82 1 102.82 4.12 0.0768 Not insignificant
E-Melt temperature 78.63 1 78.63 3.15 0.1137 Heriarchy
AC 267.71 1 267.71 10.74 0.0112 Significant
AE 156.34 1 156.34 6.27 0.0367 Significant
Regression Equation with R2=0.91
AE AC E C B A StressGap=−934.14147+108.95332 +0.98130 +11.43670 +1.46205 −1.26868 −0.15788 a) b)
Fig.3 – Influence of Cooling time, Melt temperature and Injection speed 1 on the Stress Gap a) Injection speed 1=5% and b) Injection speed 1=10%
The Apparent Toughness
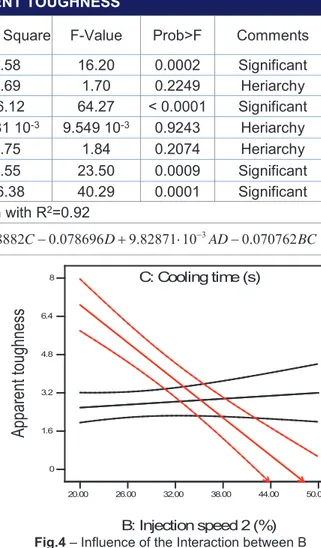
Tensile strength and strain to failure were analysed with an average strain to failure of 0.018m/m and average tensile strength of 184.4MPa. Apparent Toughness was defined are the product of strain to failure and tensile strength, as a measure of the work of fracture. The Apparent Toughness was possible to model with significance, Tab. 3. Statistically significant was B: Injection speed 2. Furthermore, the interactions AD, the interaction between A: Injection speed 1 and D: Moving side temperature and the interaction BC, the interaction between B: Injection speed 2 and C: Cooling time were found significant. The interactions showed dominant influence on the Apparent Toughness. A low A: Injection speed 1 and D: Moving side temperature reduced apparent hardness. The reason for this was that both these factors reduce the temperature of the melt entering the die cavity with a possible increase of cold shuts and flow related defects as AZ91D has a low density and cool rapidly. Similarly, a long C: Cooling time made the Apparent Toughness sensitive to B: Injection speed 2 with a strong reduction as B Injection speed 2 increased, Fig 4. A short C: Cooling time
630.00 635.00 640.00 645.00 650.00 2.00 3.00 4.00 5.00 6.00 60 70 80 90 100 110 120 130 St res s G ap (M Pa) C: Cooling time (s) E: Melt Temperature (C) 630.00 635.00 640.00 645.00 650.00 2.00 3.00 4.00 5.00 6.00 60 70 80 90 100 110 120 130 St res s G ap (M Pa) C: Cooling time (s) E: Melt Temperature (C)
Die-casting
B: Injection speed 2 (%) C: Cooling time (s) 20.00 26.00 32.00 38.00 44.00 50.00Ap
pa
re
nt
to
ug
hn
ess
0 1.6 3.2 4.8 6.4 8Fig.4 – Influence of the Interaction between B Injection speed 2 and C: Cooling time with red indicating 6 s Cooling time and Black 2 s. cooling time.
Dashed lines are 95% confidence boundaries would not allow for stress relaxation around the defects generated by a high B: Injection speed 2. The relaxation suggested by the Stress Gap analysis would also allow an increased toughness for a material with a lower defect content explaining the high Apparent Toughness at low B: Injection speed 2 and long C: Cooling time, Fig.4.
Tab. 3 - : Analysis of the Apparent Tougness ANOVA TABLE APPARENT TOUGHNESS
Parameter SquaresSum of Df Mean Square F-Value Prob>F Comments
Model 39.50 6 6.58 16.20 0.0002 Significant
A-Injection speed 1 0.69 1 0.69 1.70 0.2249 Heriarchy
B-Injection speed 2 26.12 1 26.12 64.27 < 0.0001 Significant C-Cooling time 3.881E-003 1 3.881 10-3 9.549 10-3 0.9243 Heriarchy
D-Moving side temperature 0.75 1 0.75 1.84 0.2074 Heriarchy
AD 9.55 1 9.55 23.50 0.0009 Significant
BC 16.38 1 16.38 40.29 0.0001 Significant
Regression Equation with R2=0.92
BC AD D C B A ughness ApparentTo =10.57632−1.66489 +0.16215 +2.48882 −0.078696 +9.82871⋅10−3 −0.070762 CONCLUSIONS
In the current work it was shown that for thin-walled hot chamber die casting of AZ91D there was a strong relation between the mechanical behavior and the processing parameters. By analysis of the Stress Gap between the proportionality limit and the off-set proof stress, it was shown stress relaxation took place in the die during cooling as the die temperature was significantly higher than the surrounding air, keeping the part at higher temperature for longer time.
The Apparent Toughness showed the expected dependence on B: Injection speed 2 and turbulence during filling. The novelty identified was the interaction between the second stage filling and the cooling time in view of the relaxation processes that took place in the die as illustrated by the Apparent Toughness.
ACKNOWLEDGEMENTS
The Knowledge Foundation is acknowledged for funding this work under the CompCAST project (Dnr 201000180). Singapore Institute of Manufacturing Technology is acknowledged for supplying the samples. Mr Hamed Kafili Larimi is acknowledged for support with tensile testing and operations of the SEM.
REFERENCES
[1] B. L. Mordike and T. Ebert, “Magnesium Properties - applications - potential,” Mater. Sci. Eng. A, vol. 302, no. 1, pp. 37–45, 2001.
[2] A. E. W. J. K. Kainer, M. Tan, and J. Yong, “RECENT DEVELOPMENTS IN THE MANUFACTURING OF COMPONENTS FROM ALUMINIUM- , MAGNESIUM- AND TITANIUM-BASED ALLOYS,” Cosmos, vol. 5, no. 1, pp. 23–58, 2009.
[3] H. Dini, N. Andersson, and A. Jarfors, “Effects of Microstructure on Deformation Behaviour of AZ91D Cast Alloy,” TMS2014 Annu. Meet. Suppl. Proc., pp. 565–572, 2014.
[4] C. Do Lee, “Constitutive prediction and dependence of tensile properties of high-pressure die-cast AM60B and AZ91D magnesium alloy on microporosity,” Met. Mater. Int., vol. 12, no. 5, pp. 377–383, 2006.
[5] M. Paramsothy, S. F. Hassan, N. Srikanth, and M. Gupta, “Enhancing tensile/compressive response of magnesium alloy AZ31 by integrating with Al2O3 nanoparticles,” Mater. Sci. Eng. A, vol. 527, no. 1–2, pp. 162– 168, 2009.
[6] T. Sumitomo, C. H. Cáceres, and M. Veidt, “The elastic modulus of cast Mg–Al–Zn alloys,” J. Light Met., vol. 2, no. 1, pp. 49–56, 2002.
![Tab. 1 - : Investigated process parameter window PROCESS PARAMETER A: Injection speed [%]1 B: Injection speed[%]2 C: Cooling time[s] D: Moving sidetemperature [oC] E: Fix side temperature [oC] F: Melt temperature[oC] 5-10 20-50 2-6 104-166 160-192 637-65](https://thumb-eu.123doks.com/thumbv2/5dokorg/5400560.138236/3.892.109.826.202.301/investigated-parameter-parameter-injection-injection-sidetemperature-temperature-temperature.webp)