Master Level Thesis
European Solar Engineering School
No. 217, October 2016
Design of a PV-Diesel Hybrid
System with Unreliable Grid
Connection in Lebanon
Title
Master thesis 15 hp, 2016 Solar Energy Engineering Author: Sophia Alayan Supervisors: Rina Navarro Frank Fiedler Examiner: Ewa Wäckelgård Course Code: MÖ3031 Dalarna University Energy and Environmental Technology
Abstract
This thesis is a study on integration of photovoltaic generators into an existing diesel-unreliable grid connected system at the Lebanese village of Khiam. The main goal of implementing PV-diesel hybrid system is to reduce diesel consumption and the import of fossil fuel used in electricity power supply. Before designing the system, it is necessary to create a load profile for 120 households and pre-design the size of the PV generator, the capacity of storage system and inverter type/size selection. The load profile data is based on the average of monthly energy consumption gathered from Khiam village households.
Detailed simulations and financial analysis are performed with HOMER to compare different systems and their viability. The simulations include four different designs starting from the existing system, diesel generator with unreliable grid, followed by PV generator and unreliable grid, PV and diesel generator and ended with the complete hybrid system. Once the Hybrid system is determined a detailed design is done to optimize the lowest cost PV-diesel hybrid system. The final simulated PV-diesel hybrid system is suggested with a PV capacity of 270 kWp, existing diesel capacity with 200 kVA, an inverter output of 115
kW and battery bank nominal capacity is 1872 kWh. The system renewable fraction is 53% and the project life cycle is 25 years. The PV-diesel hybrid system is projected to produce electricity at a cost of 0.12 USD/kWh. This cost is significantly lower than the 0.26 USD/kWh paid to the diesel operator, as well as lower than 0.13 USD/kWh paid to the utility grid.
In addition, and according to the given information from the owner, an estimated diesel consumption of 104000 ltr/year, the simulation result shows diesel consumption at 40000 ltr/year. The reduced carbon dioxide production by 65%, from 776 to 272 tons per year, provides further justification for the PV installation in a commercial PV-diesel hybrid system.
Acknowledgment
I wish to express my gratitude to Dr. Frank Fiedler and with his academic assistance, support and patience to fulfil my goals in this thesis. I am thankful to Professor Ewa Wäckelgård for her feedback and assistance. I will thank my supervisor Rina Navarro for her guidance and support to complete my thesis work. Finally, thanks to my brother Mustafa and his wife Gunilla for their encouragement during this Masters study program.
Contents
Index of Figures ... 4 Index of Tables ... 4 1 Introduction ... 6 Aims... 7 Method ... 7 Constraints ... 8 Previous work ... 8 2 Method/Modelling ... 9 Pre-design preparation ... 9Profile load estimation ... 11
PV array size and battery calculation ... 13
3 System design and simulation ...14
Detailed system design ... 15
3.1.1. HOMER description ... 15
3.1.2. PV module ... 15
3.1.3. Unreliable grid modelling ... 16
3.1.4. Battery storage ... 17
3.1.5. Inverter ... 18
3.1.6. Diesel generator ... 20
Simulation systems ... 21
3.2.1. Diesel generator and grid system ... 21
3.2.2. PV generator and grid system ... 21
3.2.3. PV-diesel generator ... 22
3.2.4. PV-diesel hybrid grid connected system ... 22
4 Results ...22
Diesel generator and grid system simulation ... 23
PV generator and grid system simulation ... 23
PV-diesel generator system simulation ... 24
PV-diesel hybrid grid connected system ... 25
5 Financial analysis results ...27
Economic analysis ... 27
System simulation and sensitivity analysis ... 28
5.2.1. Basic system analysis ... 28
5.2.2. Hybrid PV diesel unreliable grid system analysis ... 29
5.2.3. Greenhouse gas emission ... 30
6 Discussion and conclusions ...31
Index of Figures
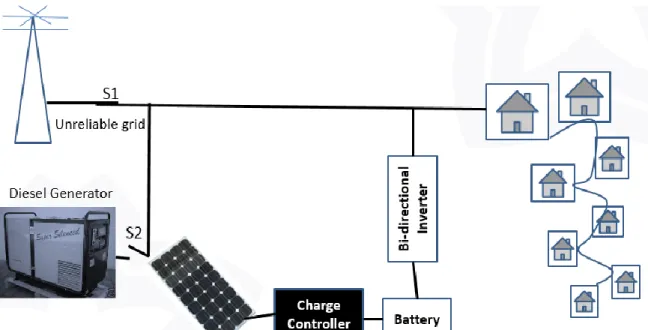
Figure 1.1 PV-diesel unreliable grid hybrid system ... 6
Figure 2.1 One household hourly peak load ... 10
Figure 2.2 Village primary load imported to HOMER simulation tool. ... 12
Figure 2.3 One day hourly load for January and August... 12
Figure 2.4 Monthly load for (a) and (b) is the average daily profile for one household ... 13
Figure 3.1 Village monthly average temperature ... 16
Figure 3.2 The cost set up on supply/shortage hour for the grid ... 16
Figure 3.3 (a) schedule supply/shortage hours cost rated and (b) turning ON/OFF model (HOMER Legacy, 2012). ... 17
Figure 3.4 Diesel and grid simulation system ... 21
Figure 3.5 Simulation for PV and grid system ... 21
Figure 3.6 PV-diesel hybrid system ... 22
Figure 3.7 PV-diesel grid connected system ... 22
Figure 4.1 Optimized result of diesel grid connected system ... 23
Figure 4.2 Diesel and grid system monthly production. ... 23
Figure 4.3 Simulation of PV generator and grid system... 24
Figure 4.4 PV generator and grid monthly production. ... 24
Figure 4.5 PV-diesel generator simulation ... 24
Figure 4.6 PV-diesel system for monthly production. ... 25
Figure 4.7 PV integration system monthly production. ... 25
Figure 4.8 PV-diesel hybrid system simulation ... 25
Figure 4.9 Monthly electricity production. ... 26
Figure 4.10 PV system cell temperature ... 26
Figure 5.1 Simulation production result for (a) existing system and (b) modified system‘ ... 28
Figure 5.2 PV generator power supply added to the existing system... 29
Index of Tables
Table 2.1 Profile load specifications for one household ... 10Table 2.2 Household average load consumption over 24 hour. ... 11
Table 2.3 Horizontal and tilted irradiation including PSH of the village ... 14
Table 3.1 Details of PV cell technologies considered ... 15
Table 3.2 Battery specifications ... 18
Table 3.3 Inverter specifications ... 18
Table 3.4 Module characteristics being analysed (Appendix A) ... 19
Table 3.5 Inverter input details for ECO280A156P-72 (280W) module (Appendix B) ... 20
Table 3.6 Diesel generator owner details information ... 20
Table 5.1 Diesel generator cost ... 27
Table 5.2 Different fee diesel generator subscription cost ... 27
Table 5.3 Economic result for basic and modified hybrid systems ... 28
Table 5.4 Diesel generator simulation result for existing and modified system ... 28
Table 5.5 Purchased energy and bill cost for basic system ... 29
Table 5.6 Annual energy purchased from grid and diesel generator modified system ... 30
Table 5.7 Basic and hybrid system operational cost ... 30
Nomenclature
AC Alternating Current BDT Bangladeshi Taka
CCVSI Current Controlled Voltage Source Inverter COE Cost of Energy
DC Direct Current
DOD Depth of Discharge EDL Electricité Du Liban
η Efficiency
ηBBOS Battery Balance of System Efficiency
EMS Energy Management System ESS Energy Storage System HES Hybrid Energy System
LBP Lebanese Pound
LCOE Levelized Cost of Energy MED Mediterranean Sea
NASA National Aeronautics and Space Administration
n Number of Autonomy Days
Ppv Photovoltaic Power
PSH Peak Sun Hour
PV Photovoltaic
RE Renewable Energy
STC Standard Test Condition USD United States Dollar
1 Introduction
The energy shortage started in 1975 during the civil war in Lebanon. The impact of the energy shortage and the political instability led to the increased use of diesel generators that covered a 4 million population area of 10452 km 2. These diesel generators have to cover the electricity shortage when the main grid is down.
Daily electricity shortage is a common problem all around Lebanon, there is an outage rotation of eight to sixteen hours of blackout in the village daytime. Due to outage rotation, consumers have to pay two different bills every month, the consumption price from the grid is around 13 cents USD/kWh, and from the diesel generator is about 26 cents USD/kWh. (MEDSOLAR, 2015)
Thecountry is located on the Mediterranean Sea between northern latitudes 33°03' and 34°41' and eastern longitudes 35°06' and 36°37', Khiam village is located at latitude 33°19' north and longitude 35°36' east at 697 m above sea level. The country’s location has an average annual solar radiation of 2200 kWh/m2. This solar energy potential, the track of the
sun and the nature of the geographical site, are significant enough to implement renewable photovoltaic (PV) energy in the region. One factor which increases the attractiveness of PV as a renewable energy solution in Lebanon, is the government heavily relies on fossil-fuel and natural gas imports from neighbouring countries like Turkey and Egypt. The high dependency on diesel generators to compensate the electricity shortages is the reason behind the government’s decision to increase the renewable share from 3% to 12% at 2020 (Republic of Lebanon, 2015).
Figure 1.1 shows the existing mini-grid diesel system as well as the future integrated PV generator. Simulations performed in this project are aimed at studying the PV generator effectiveness at reducing fuel consumptions, operation hours of generators and air pollution.
A test study analysis performed by (Shihadeh, et al., 2012), in a section of the city of Beirut, shows the gravity of the situation for people surrounded by open-space noisy diesel generators. The result clearly identifies that three hours of private generator uses ”is leading to higher airborne pollution levels and inhalation exposure to carcinogenic compounds”.
Aims
The aim of this thesis is to examine the feasibility of implementing PV systems in an existing unreliable hybrid diesel mini-grid system in a village in Lebanon.
The aim of PV implementation is to reduce the consumption of diesel fuel, the working hours of diesel generators, as well as the domestic electricity bills. The optimal system design will be achieved through the pre-design preparation and system design simulation.
Another aim of this thesis is to evaluate the economic feasibility of a PV-diesel hybrid system over a 25 years lifetime compared to a diesel grid unreliable system.
Method
The following steps should be used to achieve the aims of this thesis work:
1. Literature review regarding the implementing of PV to an existing diesel generator. 2. Pre-design preparation:
a- Creation of load profiles based on information from the Khiam village household energy equipment.
b- Creation of village annual load based on household monthly energy consumption c- Estimation of load profile PV area and battery storage size.
3. System design and simulation in HOMER software tool:
a- PV system design needs collection of all necessary data from NASA resources. b- A grid modelling in HOMER configured with the actual electricity price. c- Battery size to supply the load and reduce diesel generator operation time. d- Adding converter from HOMER component database to convert DC/AC load. e- Information on existing diesel generator included in the system design.
f- Different system HOMER configuration and simulation.
4. Analysis of simulation results and comparison of the cost of energy (COE) with the actual cost of electricity. Conclusions regarding the feasibility of the system. 5. Analysis of results and preparation of recommendation for the use of the system.
Constraints
The integration of PV-diesel hybrid system is purely theoretical and HOMER software tool will be used. The component selection of charge controller and inverter was limited from HOMER to a combi/inverter.
Solar equipment selected in the system, like charge controller and inverter, are imported from Europe and China. The price for these components is configured according to the European market price.
The electricity consumption input bills to create the village load profile was gathered from different households supplied by diesel generator and the unreliable grid.
The diesel generator selected from the village is rated to 200 kVA.
Previous work
A comprehensive literature review was applied for the completion of this thesis work, including materials focusing on the Lebanese unreliable grid case situation, experience from using small PV-diesel hybrid system and pollution problems related to diesel generators.
The successive government promises to provide constant power supply, can be the beginning of PV-diesel hybrid system connected to a grid net-metering. A project started for a case study of a 54 kWp PV generator introduction to aLebanese village (Zein &
Bazzoun, 2013 a) showed high financial attractiveness. A payback periods of 4.6 years has been demonstrated, and an internal rate of return of 21% is expected.
More information on how these systems are working to be technically and financially attractive to a diesel operator in a village in Lebanon, is found in Chedid, et al., (2015 a). A techno-economic analysis of PV-diesel hybrid system on a small industrial factory with 8 hours per business day and a daily energy demand of 161 kWh/day, demonstrates a 10 years payback period and the PV system levelized cost of energy was 0.17 USD/kWh, which is lower than the levelized diesel cost of 0.32 USD/kWh. These existing systems in Lebanon are interesting to this thesis, with PV integrated area at 270 kWp and daily energy demand
1775 kWh/day. In case of implementing this project, it will be the first village installation in Lebanon.
The study of (Achraf, 2014 a) is a good example on comparing a diesel generator system with a PV-diesel hybrid system. A common load shedding in Gazipur-Bangladesh, shows more than 15 hours of load shedding every day during summer time. Their research is an analysis of the cost and optimization of a PV-diesel system to secure works in IUT (Islamic University of Technology) campus. HOMER simulation tool was used and they found cost reducing up to 10BDT/kWh compared to the conventional model. Use of the hybrid system reduced greenhouse gas production by almost 27%.
Dehbonei, et al (2004 a ) outlines a description of extracting maximum power from solar photovoltaic panels. It is a combination of a voltage controlled voltage source inverter (VCVSI) and a current controlled voltage source inverter (CCVSI), connected in series on the DC side and in parallel on the AC side.
A designed implementation and experimental analysis was completed by (Riasat, et al., 2013 a) on a PV-diesel hybrid power system to meet the residential loads in Dhaka city. The use of PV-diesel hybrid system with battery (one kWp PV array, two diesel generator of
This system gave the lowest COE 0.36 USD/kWh and a total net present cost (NPC) of 164106 USD with a renewable fraction of 25%. This proposed hybrid power system could reduce CO2 emission by about 922 tons per year compared to diesel generator only. The
revenue of using PV over the diesel will save 18440 USD annually at a rate of saving 20 USD per ton of CO2. Therefore, over a 30 years lifetime, there will be revenue of 553200
USD.
Che Fung, et al (2002) carried out a useful investigation of PV-diesel hybrid system for research and education in Australia. Their focus was on remote areas that are not connected to the grid, and their system comprises a PV module of 1.2 kWp, a 5 kVA diesel generator,
a 5 kVA bidirectional inverter and a 13 kWh battery bank. The measurement result showed a performance ratio of 0.6 for the PV-array. The average efficiency of the motor generator was 1.7 kWh/ltr. The battery efficiency was 0.96 and the system efficiency 0.64. This groundwork study has provided the foundation and information for future studies on optimal control and intelligent control strategies.
One study, on load profile estimation for a village, was based on genetic algorithm support vector regression according to Yi-feng and Shu-wen (2010). Another research on profile estimation (Lecoufle & Kuhn, 2012) was on the present electricity generation and consumption patterns as well as the categorization of the different consumers with their respective needs. This study was made in Chad, central Africa, at three levels: 1) Interviews with the central and local governments to get an understanding of their views on the current situation for electricity generation, distribution and use. 2) Interviews with the local electricity grid, and customers; 3) Interviews on consumption habits through questionnaires. As a result of this extensive data collection a national pattern could be created. This national pattern covered the settlement type, number of inhabitants, load demand and the needed electricity characteristics.
2 Method/Modelling
Pre-design preparation
This section is a pre-design for the load profile of households based on main useful electrical equipment and users’ behaviour. A detailed hourly load data profile for a single year was added to these preparations as an input for simulation with HOMER. The hourly load data will cover the demand for energy consumption in Khiam village
The main requirements as PV-diesel system design are the site information, such as a profile load for households and time of use of the electrical appliances. This work will be implemented theoretically on a part of the village supplied by diesel generator when the grid is down.
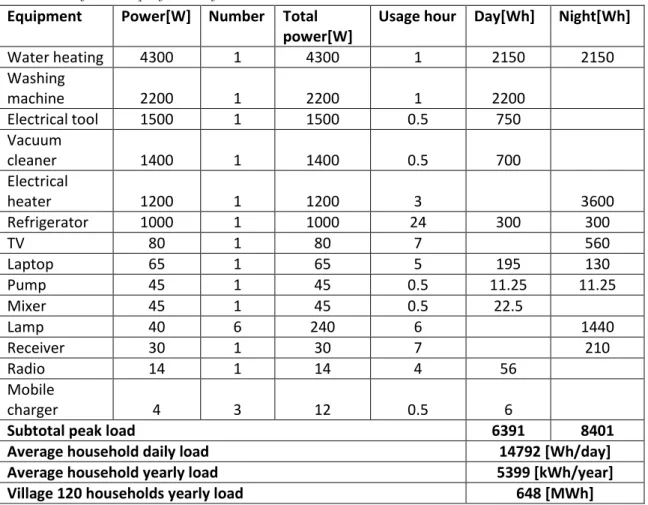
The first step is to gather data on equipment power energy, quantity, behaviour information on families’ energy consumption. The best way to get this basic information is to interview people and register the power of their usual electric appliances and the average useful time. Based on gathered data from the village, a load profile is estimated. Table 2.1 shows the standard house annual profile load.
Table 2.1 Profile load specifications for one household
Figure 2.1 shows the peak load of energy consumption over a day. People in the village use electric heaters for a couple of hours on average to warm up their bedrooms in winter. The cold season starts from December 10 to March 23 (Weather, 2012). Washing machines and water heating, which mostly consume electricity, are used when the grid is on. In general, the load demand increases during the summer season (July/August), when relatives visit the village for weekends or holidays. The electricity consumption increases during this period, and such consideration is taken into account in this study.
An excel sheet filled with 24 hours of data is used to calculate the hourly energy consumption of the household. This procedure is done on every hour of the day considering all family members and their consumption of electricity. The household average daily load is based on 14.8 kWh from table 2.1, as shown in Figure 2.1 below.
0 500 1000 1500 2000 2500 1 2 3 4 5 6 7 8 9 10 11 12 13 14 15 16 17 18 19 20 21 22 23 24 En ergy d em an d [Wh ] Time[h]
Equipment Power[W] Number Total
power[W]
Usage hour Day[Wh] Night[Wh]
Water heating 4300 1 4300 1 2150 2150 Washing machine 2200 1 2200 1 2200 Electrical tool 1500 1 1500 0.5 750 Vacuum cleaner 1400 1 1400 0.5 700 Electrical heater 1200 1 1200 3 3600 Refrigerator 1000 1 1000 24 300 300 TV 80 1 80 7 560 Laptop 65 1 65 5 195 130 Pump 45 1 45 0.5 11.25 11.25 Mixer 45 1 45 0.5 22.5 Lamp 40 6 240 6 1440 Receiver 30 1 30 7 210 Radio 14 1 14 4 56 Mobile charger 4 3 12 0.5 6
Subtotal peak load 6391 8401
Average household daily load 14792 [Wh/day]
Average household yearly load 5399 [kWh/year]
Village 120 households yearly load 648 [MWh]
Second step was to go further with expanding the load profile, manual calculation design, estimate the system equipment size and to get more detailed input on how to start the real simulation in HOMER.
Profile load estimation
This section expands the profile load for every day of every month over a single year hourly consumption profile. The result will be registered in an input file for HOMER simulation tool named as “primary load” parameter.
Based on monthly average residential consumption data, which was gathered last summer from households in Khiam village, an excel sheet will be used to develop the village annual consumption load profile. The data source, with an average of 488 kWh, is based on the bills for household’s electricity consumption.
Table 2.2 shows the hourly average load profile for one day in each month, which is the basic data to further create all the months’ hourly energy load values.
Table 2.2 Household average load consumption over 24 hour.
A new plan is needed to have monthly and annual profile load for 120 households. Further development is to copy all monthly hourly consumption to new linked cells over a whole single year and multiply the result by 120 households supplied by the system.
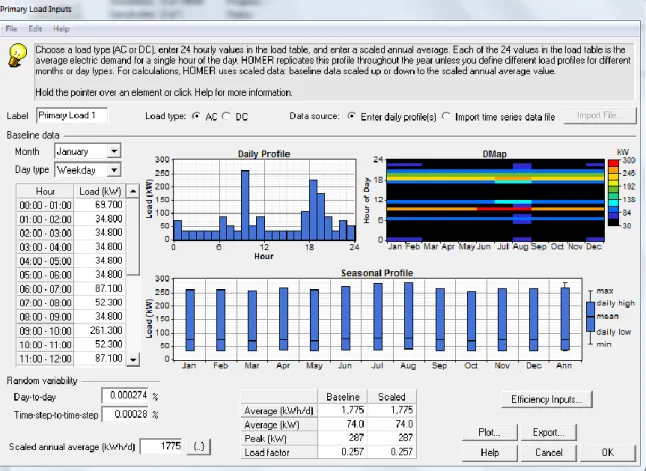
The linked cells are automatically updated when the percentage values are changed or the monthly and daily values are updated. The hourly load data for a single year, created in excel can be used to create an input text file for HOMER. This text file will be imported by HOMER, which makes a copy of the data set and integrates it with the (.hmr) file. Figure 2.2 shows result of the annual energy consumption imported text file. The “Daily Profile” window for January is shown covering the 24 hour energy consumption for 120 households. The seasonal profile diagram shows the monthly profile load over a year. At the lower left corner, a scaled annual average energy consumption per day is 1775 [kWh/d] and in the followed window the peak load is 287[kW].
Figure 2.2 Village primary load imported to HOMER simulation tool.
In addition to the automatically updated annual load profile, three different graphs will be created. The first graph will be updated automatically to present the hourly profile load as in Figure 2.3 which shows the hourly consumption for one household in January and August. The high load hour depends on the electricity heater for January and the heating water for the visitor consumption in August.
Figure 2.3 One day hourly load for January and August.
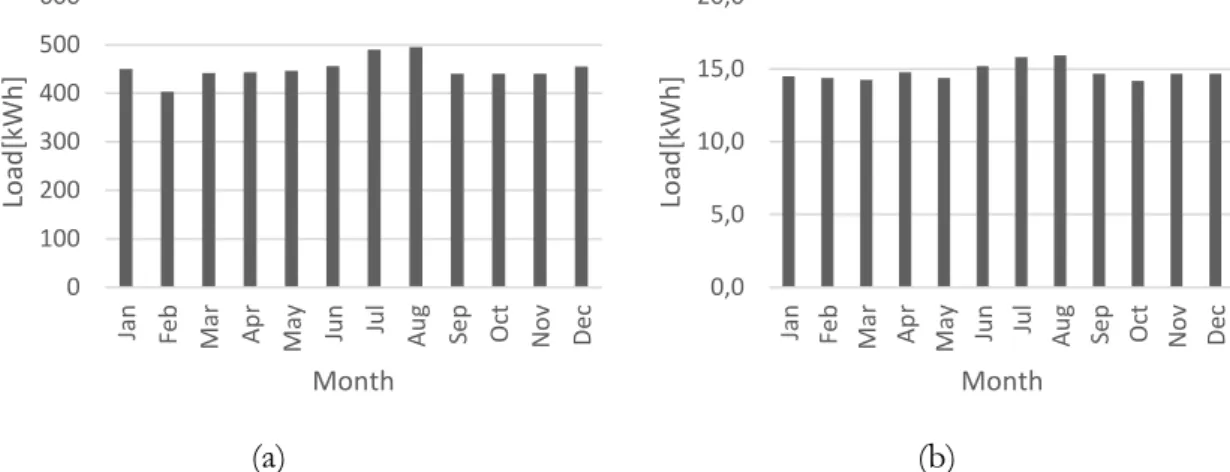
The second two graphs are shown in Figure 2.4 (a) presenting the monthly load used for the village and (b) shows the average daily load for every month.
0 500 1000 1500 2000 2500 3000 1 2 3 4 5 6 7 8 9 101112131415161718192021222324 Lo ad [Wh ] January August
(a) (b)
Figure 2.4 Monthly load for (a) and (b) is the average daily profile for one household
PV array size and battery calculation
This section, will include manual calculations which will not affect the simulation part, it is only to show how to design a PV power and storage battery bank needed to supply the village as an off grid system.
Using the result from the daily load profile for 120 households, the calculation of total energy load (EloadTotal) is done by using equation (1) and the result is 2536 kWh.
𝐸𝑙𝑜𝑎𝑑𝑇𝑜𝑡𝑎𝑙 =𝐸𝜂𝑙𝑜𝑎𝑑
𝐵𝑂𝑆 ( 1 )
Where 𝐸lo𝑎dis the daily load profile calculated for the village (1775kWh) and 𝜂𝐵𝑂𝑆 is
thebalance of system efficiency estimated to 70%.
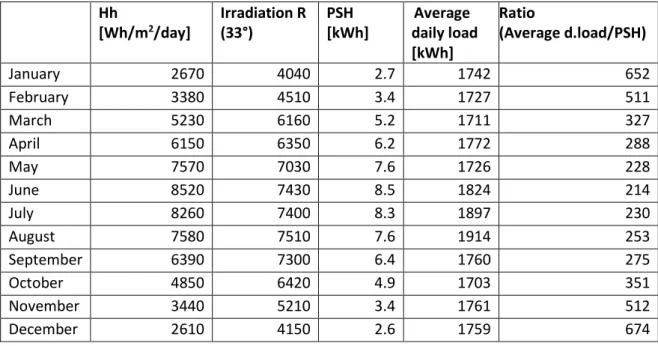
Table 2.3 presents five parameters, which are the irradiation on the horizontal plane, the irradiation on a 33° tilted plane, the peak sun hours, the average daily load and the operation ratio. The first two parameters were obtained from (NASA, 2012 a) for the village. The
Peak Sun Hours parameter represents the irradiation on the horizontal plane. The average
daily load, for each month, is calculated from the consumption data collected from the village households (Table 2.2). The operation ratio is a basic value for sizing a PV system for the “design month” which is the month with highest ratio of load to insulation. The ratio between the average daily load and peak sun hour corresponds to December as the highest ratio, so that the system must be designed to accommodate the energy needs of this month.
0 100 200 300 400 500 600 Jan Feb Mar Ap r May Ju n Jul A u g Se p O ct N o v De c Loa d [kWh ] Month 0,0 5,0 10,0 15,0 20,0 Jan Feb Mar Ap r May Ju n Jul A u g Se p O ct N o v De c Lo ad [kW h ] Month
Table 2.3 Horizontal and tilted irradiation including PSH of the village
The power needed to accommodate the load is calculated using equation (2)
𝑃pv= 𝐸𝑙𝑜𝑎𝑑𝑇𝑜𝑡𝑎𝑙
𝑃𝑆𝐻∙ɳ𝑛𝑜𝑛𝑆𝑡𝑐 ( 2 )
Where Elo𝑎𝑑Total is the total electrical load, PSH is the Peak Sun Hour and 𝜂𝑛𝑜𝑛𝑆𝑡𝑐 is the
balance of system efficiency. (2). The balance of system efficiency estimated value is 70%, the Peak Sun Hours for December is 2.6 kWh and the total electrical load is 2536 kWh. The power needed is 1393 kW.
Considering that two days of autonomy will not affect the system simulated with HOMER, the size of the batteries is calculated using equation (3). The result is 6961 kWh within depth of discharge assumed value 60%. Battery balance of system efficiency estimated value is 85%. Calculations using a 48V system, give a result for the battery capacity of 145000 Ah.
The electrical load for the battery storage can be calculated using equation (3) E𝑏𝑎𝑡𝑡𝑒𝑟𝑦= 𝐷𝑂𝐷∙𝜂𝐸𝑙𝑜𝑎𝑑 ∙𝑛
𝐵𝐵𝑂𝑆 ( 3 )
Where Eload is the daily load profile and n is the number of autonomy days. DOD is the battery depth of discharge and ɳBBOS is the efficiency balance of system for the battery i.e. the inverter losses.
3 System design and simulation
This section consists of two parts: The first one is the detailed system design using HOMER, also including the selection of the components, the inverter preliminary calculation for future use and the information on the existing diesel generator. The second part is HOMER configuration within four different system simulations:
Hh [Wh/m2/day] Irradiation R (33°) PSH [kWh] Average daily load [kWh] Ratio (Average d.load/PSH) January 2670 4040 2.7 1742 652 February 3380 4510 3.4 1727 511 March 5230 6160 5.2 1711 327 April 6150 6350 6.2 1772 288 May 7570 7030 7.6 1726 228 June 8520 7430 8.5 1824 214 July 8260 7400 8.3 1897 230 August 7580 7510 7.6 1914 253 September 6390 7300 6.4 1760 275 October 4850 6420 4.9 1703 351 November 3440 5210 3.4 1761 512 December 2610 4150 2.6 1759 674
Diesel generator back up and the unreliable grid. PV generator and the unreliable grid.
PV-diesel generator only.
PV-diesel hybrid system connected to the unreliable grid.
Detailed system design
The following steps are included in the system design:
The main software tool used to simulate system design is the hybrid optimization model for electric renewable (HOMER).
PV module selection.
Grid modelling configuration in HOMER. Battery type selection.
Inverter type selection and string sizing of the proposed module.
Details on the existing 200 kVA diesel generator according to the owner.
3.1.1. HOMER description
The Hybrid Optimization Model for Electric Renewable (HOMER), is the software developed by the National Renewable Energy Laboratory (NREL). This software simulation tool is used for PV/genset /wind /hydrogen systems design, and economical system size optimization (HOMER Legacy, 2012 a)
.
3.1.2. PV module
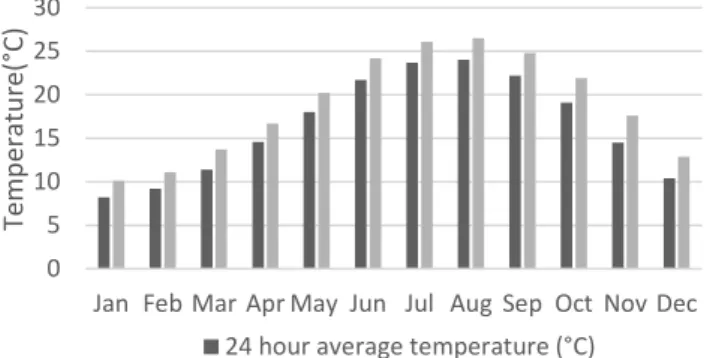
Polycrystalline solar panels will be selected for this system with efficiency up to 14%. More details are given in Table 3.1. The power output of PV array is a function on the prevailing wind speed and the maximum ambient temperature recorded in the village as 26.5°C.
Table 3.1 Details of PV cell technologies considered
The highest average daytime temperature in August is shown in Figure 3.1. These temperatures were used in HOMER (NASA, 2012 b). The range of sizes and cost are filled in HOMER that simplifies for the user the selection of the PV size meeting the hourly load profile for this part of the village. The lifetime of the system is 25 years.
Photovoltaic module
PV module type ECO280A156P-72 (280W)
Total cost/ kW 1200USD
Installed PV power 270kWp
Efficiency 14%
Inclination/orientation 33°
3.1.3. Unreliable grid modelling
The critical situation in this study is the configuration of the hourly scheduled time for the electricity. They are two alternatives to implement this special case.
The first alternative is to select, in HOMER, the grid option ”system is connected to grid” and provide the actual electricity cost for the grid in Rate1 with (0.13USD/kWh). Rate2 will be provided with higher electricity cost (100USD/kWh) to secure purchasing energy from the lower cost Rate1. Figure 3.2 shows the rates cost configuration.
The second alternative is to create and reconfigure an existing generator with a new description name” Unreliable Grid” and label it ” Unrel”. This alternative can be turned ON and OFF based on the actual configuration. This alternative was already implemented on a small industrial factory in a village in Lebanon (Chedid, et al., 2015 b). Their further studies were on the techno-economic analysis and test for the feasibility of the PV-diesel hybrid system. To make this process working, a specific grid fuel file with 3.6MJ/kg is created at one kg/m3 as density. The simulation amount of grid fuel will be equivalent to kWh production for the grid.
Figure 3.3 shows the first solutions for (a) with Rate1, for low cost supplied hours, and Rate2 for high cost equivalent to the shortage hours when the grid is down. For (b) a special configured generator handling the ON/OFF setting based on the unreliable grid schedule. The light hours is the ” Forced on” supplying hours from the grid and the dark hours is the ”Forced off” shortage hours. The set up cost for this configuration is the actual cost for the grid (0.13USD/kWh).
The configuration hours shown in Figure 3.3 are according to a blackout schedule with two alternating blackout schema: one day with 16hrs/day as follow: 00pm-6am, 10am-14pm and 6pm-00pm. The next day blackout schedule is 8hrs/day as follow: 6am-10am and 14pm-6pm. These hours are supplied by the diesel generator connected to 120 subscribers. The
0 5 10 15 20 25 30
Jan Feb Mar Apr May Jun Jul Aug Sep Oct Nov Dec
Te m p era tu re (° C)
24 hour average temperature (°C) Average daytime temperature (°C)
Figure 3.2 The cost set up on supply/shortage hour for the grid Figure 3.1 Village monthly average temperature
solution for this critical schedule was based on monthly configuration depending on HOMER configuration limit.
(a) (b)
Figure 3.3 (a) schedule supply/shortage hours cost rated and (b) turning ON/OFF model (HOMER Legacy, 2012).
3.1.4. Battery storage
The storage battery is used in the hybrid system to supply energy with its allowable limit. This storage operation is meant to decrease the diesel generator working hours. The diesel generator is a backup for the peak load when the battery charge falls to a set level. For the technical design, mixing the PV power stored in the battery with the diesel generation connected to a grid-tied inverter seemed to be the best approach.
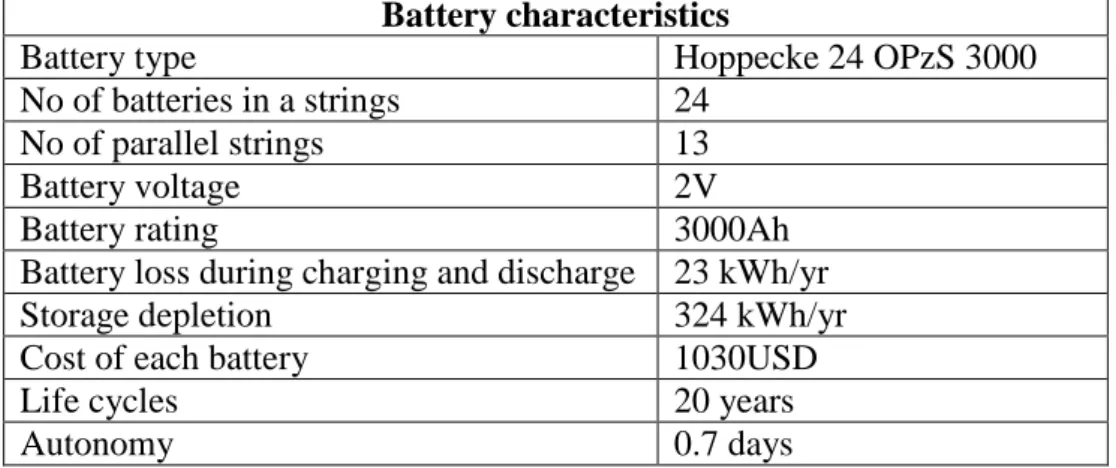
The battery range introduced with HOMER given that the actual cost in Lebanon is 1033 USD with 20% of discount for more than 500 batteries. The simulation will find the accurate size for the load demand based on a 48V system.
Battery type selection will affect the designed system lifetime depending on the number of operation cycles. The battery types considered are vented lead-acid, tubular-plate and deep-cycle battery, (Hoppecke 24 OPzS 3000) for this PV system design because of its low cost. The battery specifications are given in Table 3.2, the size of the battery pack for the PV plant is considered to be 3000 Ah. The results shown in this table are from HOMER over PV-diesel hybrid system, the battery loss during charge and discharge is 23 kWh/year and the storage depletion is 324 kWh/year. To protect the battery from overcharging/under charging, a maximum power point tracking (MPPT) charge controller will be integrated in the system. This charger is able to work with all established module technologies and solar system with module voltage higher than the battery voltage.
Table 3.2 Battery specifications
Battery characteristics
Battery type Hoppecke 24 OPzS 3000
No of batteries in a strings 24
No of parallel strings 13
Battery voltage 2V
Battery rating 3000Ah
Battery loss during charging and discharge 23 kWh/yr
Storage depletion 324 kWh/yr
Cost of each battery 1030USD
Life cycles 20 years
Autonomy 0.7 days
3.1.5. Inverter
HOMER database technology limitation to a combi inverter allowed this selection with a range of size and cost to simulate and optimize an inverter size meeting the PV area and load demand. A grid-tied inverter is needed to connect the PV DC to the AC grid. A bi- directional inverter connected between Batteries and load converting DC/AC and charging the batteries when the power from PV is low. Adding to these inverters a number of string inverters are needed for the PV string arrays. The advantages of string inverters are reduction of combiner boxes and easier system troubleshooting and monitoring. In case of inverter failure, only a small fraction of the production will be lost.
Generally, residential system uses 230V/50 Hz single phase connection to the grid. The 200 kVA diesel generator is connected with an automatic switch that closes when the grid is down. The backup generator starts supplying load after one minute delay.
Several studies and research were done by (Datta, et al., 2011) on controlling voltage distortion and frequency fluctuation between PV-diesel hybrid system and grid connection, mostly on a fuzzy control unit to improve the PV-grid connected inverter system stability. Another study was conducted by ( Dehbonei, et al., 2004 b) to combine a voltage controlled voltage source inverter (VCVSI) and a current voltage source inverter (CCVSI), connected in series on the DC side and in parallel on the AC side
The selected inverter is shown in Table 3.3. The model SMA TriPower 15000TL, has a large Vmpp range of 360-800V, which gives some flexibility in using different modules
voltage characteristics and design with different string lengths. The maximum voltage is 1 000V and the efficiency is 98.1 %. This high efficiency makes the SMA TriPower 15000TL the best selection for the design.
Table 3.3 Inverter specifications
Inverter characteristics
Inverter type Sunny TriPowerSTP 15000TL-10
Inverter/ efficiency 98.1 %
Max voltage 1000V
Mpp voltage range 360V-800V
String inverter size 15kW
Lifetime 15 years
Table 3.4 shows the STC characteristics of ECO280A156P-72 polycrystalline module selected. Using Microsoft excel and the corresponding temperature coefficient of the module voltage Voc min(at 15°C), Vmpp min(at 15°C) and Vmpp max(at 80°C) was
determined as shown in this table. Once this is done, the maximum and minimum module operating voltages calculated with the Vmpp voltage of the inverter (360V-800V) allows for
a maximum and minimum possible string length for each module as shown in Table 3.4. The selection of ECO280A156P-72 module and SMA TriPower 15000TL will be followed by preliminary calculations to size the string length in accordance to the inverter voltage capacity. A necessary step in string size calculation is to determine the operation cell temperature range used which influence the maximum and minimum string length due to the module temperature coefficient of voltage characteristic. The maximum operating cell temperature was assumed to be 80°C based on the usual operating cell temperature.
The maximum string length for ECO280A156P-72 module was 21.5 modules. The optimum string length that satisfied the voltage constraints of the inverter, is 17 modules. However, it must be noted that with 19 modules or more per string, the input voltage will exceed the limit of 800V for the inverter.
Table 3.4 Module characteristics being analysed (Appendix A)
Polycrystalline ECO280A156P-72 Module dimensions Length(m) 1.956 Width(m) 0.992 Height(m) 0.05 Weight(kg) 23 Vmpp(V) 35.85 Impp(A) 7.81 Voc(V) 45.22 Isc(A) 8.25 V temp Coefficient (V/ °C) 0.30% Voc(V) at 15°C 46.58 Vmpp(V) at 15°C 36.93 Vmpp(V) at 80°C 29.93
Min string length in order to operate in Mpp range (360V) 12
Max string length to be within inverter Vmpp 21.5
Chosen string length 17
SMA has a unique inverter model with two MPP trackers, one for input A and one for input B. Input A can be connected to five strings with a maximum input current of 33A. Input B can only be connected to one string and has a maximum input current of 11A. The current constraints for this input will determine the number of string connections. A current calculation will be done to ensure that the maximum PV array current does not exceed the maximum inverter input current. Impp at STC for the polycrystalline modules is 7.8A. As a
result (33/7.8), the number of parallel strings which could be connected to Input A with a maximum input current of 33A was four. Similarly for input B with a maximum input
Table 3.5 shows the current and voltage characteristics for the 15kW inverter utilizing ECO280A156P-72 polycrystalline module. Since there are four strings of length 17 for input A, which gives a total of 68 modules on this input and one string of 17 on input B, thus giving a total number of 85 modules that can be connected to each inverter. Polycrystalline module and inverter input details can be found in Appendix A and B.
Table 3.5 Inverter input details for ECO280A156P-72 (280W)module (Appendix B)
Inverter input details for ECO280A156P-72
Inverter type Sunny Tripower STP 15000TL
Mpp voltage range 360-800V
String length 17
Strings per MPP input A 4
Strings per MPP input B 1
Total number of modules per 15kW inverter 85
Inverter details Input A Input B
Module count 68 17
Max inverter Vmpp 800V 800V
Max input voltage, Voc at 15°C 792V 792V
Min string voltage to be within inverter Vmpp 360V 360V
Min input voltage Vmpp at 80°C 509V 509V
Maximum input current 33A 11A
String input current (Impp) 31.24A 7.81A
3.1.6. Diesel generator
The main part of the existing mini-grid system is the diesel generator, Table 3.6 shows the main data, according to the owner, needed for HOMER.
The research presented in (Zein & Bazzoun, 2013 b) on a 550 kVA diesel generator integrated with PV, without storage, in the village of Deir-Kanoun southern Lebanon shows how the load measurements decrease during the night (90kW), start increasing in the morning and stabilize from 11am-14pm at 155 kW. At sunset, they start to rise up to 230 kW.
After this scenario, they determined the PV impact on fuel consumption and smaller diesel as more effective.
Table 3.6 Diesel generator owner details information
Existing generator details Characteristics
Diesel generator type Volvo D10
No of cylinders 6
Fuel diesel diesel
Fuel supply system (Direct Injection) DI electronically controlled
Rating 200 kVA
Diesel tank capacity 100 ltr
Specific fuel consumption 25 ltr/h
Cost of the fuel 0.37 USD/ltr
Capacity kW 201 kW
Simulation systems
The simulation study will be performed on different cases to verify the effectiveness of adding a PV generator to an existing mini-grid supply system. Case one, will be run using the existing diesel generator and the supply scheduled grid. Case two will be run using the grid, the PV generator and the storage. Case three will consider the diesel generator, the PV generator and the storage. Case will include a PV-diesel hybrid system grid connected to supply 120 households. The last case will be studied in details as it is the main objective of the thesis work.
The renewable energy resources gathered from (NASA, 2012 c) as 33° tilted angle and temperature for the village site, are configured in HOMER, as well as a range of components selection provided with size and appropriate cost. The optimization HOMER model (HOMER Legacy, 2012 b) is the theoretical study to assess the feasibility of the PV-diesel hybrid system.
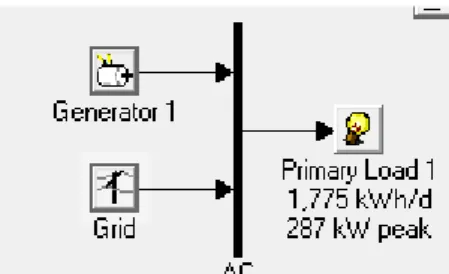
3.2.1. Diesel generator and grid system
The basic configuration shown in Figure 3.4 consists of a diesel generator and the shortage grid connected to the load. The simulation performed with HOMER for the existing system will be compared with the PV-diesel hybrid grid connected system.
Figure 3.4 Diesel and grid simulation system
3.2.2. PV generator and grid system
The proposed system shown in Figure 3.5 consists of the grid, the PV generator, the converter and the storage. Diesel generator is not included in the system. This simulation is to compare the technical and economic impact of integrating PV generator to the grid of the system performance.
3.2.3. PV-diesel generator
The configuration of the system in Figure 3.6 is based on adding the PV generator, the converter and the battery storage to the diesel generator without considering grid connection. This simulation will show the impact of PV on fuel-fossil consumption over a year.
Figure 3.6 PV-diesel hybrid system
.
3.2.4. PV-diesel hybrid grid connected system
The main system configuration for the thesis project shown in Figure 3.7 includes the basic existing mini-grid which consists on the unreliable grid connected to a 200 kVA diesel generator. This mini-grid will expand with the PV generator, the converter and the battery bank storage. The system will be analysed in details comparing it to the basic existing system.
Figure 3.7 PV-diesel grid connected system
4 Results
This section is an analysis result on four system models. This analysis will cover the technical and economical system performance for 25 years lifetime. The simulation performed with HOMER is aimed towards finding the optimized system based on the cost and size for the existing components.
Diesel generator and grid system simulation
This configuration presents the basic system that supplies the electricity demand of the village. Grid configuration in HOMER is based on two different rate prices, as seen in Figure 3.3 (a). A low price Rate1 (0.13 USD/kWh) for supplied hour and Rate2 for shortage hour (100 USD/kWh). In this case the generator’s capacity is too low to cover the blackout hour, the simulation started purchasing energy from Rate2 with high price which needs higher diesel capacity from 200 kVA to 288 kVA. Diesel consumption was 217000 ltr/year. Figure 4.1 shows the total net present cost for the system, which is 4000000 USD and the cost of energy (COE) is 0.24 USD/kWh.
Figure 4.1 Optimized result of diesel grid connected system
Figure 4.2 shows the monthly average electrical production, the black fraction of the bar, is supplied by diesel generator, and the light fraction, is supplied by the grid.
Figure 4.2 Diesel and grid system monthly production.
PV generator and grid system simulation
This configuration consists of the grid, a 420 kWp PV array size, 288 kW converter and
456 pcs (Hoppecke 24 OPzS 3000) storage batteries. The storage battery bank will be able to supply power for one autonomy day according to HOMER simulation result. The renewable fraction is 70% and bank battery life is 18 years.
Figure 4.3 shows the total net present cost of the system that is 2000000 USD and cost of energy (COE) is 0.14 USD/kWh.
Figure 4.3 Simulation of PV generator and grid system
Figure 4.4 shows the monthly average electrical production.
Figure 4.4 PV generator and grid monthly production.
PV-diesel generator system simulation
The simulation performed with HOMER in this case includes the PV system and the diesel generator. The operation and maintenance cost is 0.87 USD/h.
HOMER configuration input for diesel generator could optimize two systems within same simulation. The first row result shown in Figure 4.5 presents a PV system with capacity shortage of 5%. This step was simulated without the diesel generator backup. The net present cost is 2000000 USD and cost of energy (COE) is 0.11 USD/kWh.
The second row includes a diesel generator size 200 kVA with fuel-fossil consumption 22000 ltr/year. The net present cost is 2000000 USD and the cost of energy (COE) is 0.12 USD/kWh. The renewable fraction is 92% with two autonomy days. Both systems could reduce the cost of energy comparing to the utility cost (0.13 USD/kWh).
Figure 4.5 PV-diesel generator simulation
A similar study was performed by (Achraf, 2014 b) on a PV-diesel hybrid energy generation system for IUT academic building in Bangladesh. HOMER was used to perform the techno-economic evaluation of both configurations. Comparisons between models show that the proposed PV-Diesel hybrid model could reduce to 10BDT/kWh compared to the conventional model (1 Dollar = 78 BDT).
Figure 4.6 shows the monthly average production result for the PV-diesel hybrid system. The black part is supplied by the backup diesel generator and the light part, supplied by the PV generator.
Figure 4.6 PV-diesel system for monthly production.
Figure 4.7 shows the simulation part of the PV integration together with the battery bank storage. This could cover the load demand for the village with two autonomy days, according to the simulation tool result. The renewable fraction is 100% and battery life with standalone PV system is 15 years.
Figure 4.7 PV integration system monthly production.
PV-diesel hybrid grid connected system
This main section of the simulation work covers all components to supply 120 households load demand. The Figure 4.8 consists of PV-diesel generator connected to the grid. The PV array optimized to 270 kWp from the range of PV area size values between 50
to 330 kWp, existing diesel generator 200 kVA and the grid sized to 200 kW. Simulation
results with total net present cost (NPC) is 2000000 USD and cost of energy (COE) is 0.12 USD/kWh. The autonomy day, according to this system simulation result, is one day, battery life is twenty years and battery bank consists of 312 batteries. The system renewable fraction is 53% and diesel consumption is 40000 ltr/year.
A case study conducted in Deir-Kanoun village in Lebanon, mentioned by (Zein & Bazzoun, 2013 c), showed that the preliminary results from PV systems integration into diesel generator mini-grids resulted in financial attractiveness, and that an internal rate of return of 21 % was expected.The payback period was 4.6 years in conditions of low interest loans, as low as 0.3% with a repayment period of up to 14 years and a 2 years grace period for decentralized PV systems.
The monthly average electric production is generated by the PV-diesel grid connection. The upper fraction of the graph, which is shown in Figure 4.9, is the solar radiation supply. The black (middle) fraction is the electricity supplied by the diesel generator, and the light (lower) fraction is the electricity supplied by the grid.
.
Figure 4.9 Monthly electricity production.
Figure 4.10 shows the site simulation result of the cell temperature across 8760 steps/year for a single year, which is up to 50°C in the hot season.
Figure 4.10 PV system cell temperature
0 10 20 30 40 50 60 1 382 763 1144 1525 1906 2287 2668 3049 3430 3811 4192 4573 4954 5335 5716 6097 6478 6859 7240 7621 8002 8383 Te m p era tu re [° C] Hours
5 Financial analysis results
Economic analysis
This section is a basic analysis on the current system used in the village. The load is supplied by the unreliable grid and the diesel generator.
Table 5.1 shows the fuel consumption according to the diesel generator owner, the working hours and the production cost from the diesel generator per year. The generator capital cost is not included in the table since it was purchased before and its cost was already amortized. In this analysis, the fee subscription is 10USD per month for diesel generator as set by government.
Table 5.1 Diesel generator cost
Annual diesel generator and unreliable grid cost analysis
Diesel generator Unit
Working hour/yr 4160 hr
Diesel consumption/yr [25ltr/h] 104000 ltr
Fuel-fossil cost/yr [0.37/ltr] 38000 USD
Operational and M/yr [130/150 production hours] 3600 USD
Diesel generator total cost 42000 USD
Table 5.2 shows two diesel generator bills paid by two consumers with 10A subscription. The fee subscription cost for consumer (a) was higher than consumer (b). This example shows the situation where access to electricity is not guaranteed at the same fee subscription across the country. This example, from two different villages, shows the owner unreliability of private diesel generators.
Table 5.2 Different fee diesel generator subscription cost
The financial simulation results were obtained for different configuration, starting from the existing system to a complete PV-diesel hybrid system connected to the unreliable grid. The simulation predicts the production of annual village load demand up to 648 MWh.
The financial assessment is completed with a sensitivity analysis on each component and parameter variation according to an average market price in Lebanon. The diesel fuel price is given monthly by the authority Electricité Du Liban (EDL). Lebanon’s fuel prices affected by the international market prices, with a global trend of oil price increase, the diesel prices are expected to increase. The latest price used in this study was 0.37 USD/ltr for the month of April 2016, the electricity tariff given by EDL is 0.13 USD/kWh.
The polycrystalline PV panel price is 1200 USD/kWp. The converter, the charge
controller and the battery unit price are considered to be 900 USD/kW, 500 USD/unit and 1030 USD/unit respectively. A discount of 20% will be considered with higher purchased quantity for each component. This discount is included in the simulation.
01-04-2016 Fee subscription[LBP] Fee subscription[USD]
Consumer (a) 10A 25000 17
Table 5.3 Economic result for basic and modified hybrid systems
Economic result Existing Hybrid system Units
Initial cost 960 618000 USD
Net Present Cost (NPC) 4000000 2000000 USD
Cost of Energy (COE) 0.24 0.12 USD
The diesel consumption was higher than the modified system and the simulation result is shown in Table 5.4. The diesel cost is based on 0.37 USD/ltr annual consumption and operation and maintenance on annual production hours (0.87 USD/hr).
Table 5.4 Diesel generator simulation result for existing and modified system
The cost difference shows significant contribution of the PV generator to the energy mix as opposed to the diesel-unreliable grid system. The difference value is up to 68621 USD/year, and this is shown in Figure 5.1 by the average monthly production for the existing system (a) and (b) for the mixed hybrid system.
(a) (b)
Figure 5.1 Simulation production result for (a) existing system and (b) modified system‘
System simulation and sensitivity analysis
5.2.1.
Basic system analysis
Base line analysis reflects the load supplied by the diesel generator and the unreliable grid to 120 households. The power supply from two resources is consistent with an outage timing rotated schedule.
A detailed purchase analysis is shown in Table 5.5. The energy production cost from the grid is 0.13 USD/kWh, and annual production cost, according to HOMER simulation,
Diesel
Value
Units
Existing Modified
Hours of operation 4392 634 hr/yr
Number of starts 736 402 starts/yr
Operational life 3 24 yr
Fuel consumption 217000 40000 ltr/yr
is up to 42000 USD. The energy production cost purchased from the diesel generator is 0.26 USD/kWh, and the total cost is up to 120000 USD.
Table 5.5 Purchased energy and bill cost for basic system
Source Energy purchased from grid [kWh/yr] Energy Bill (USD)
Jan 19976 2597 Feb 30458 3960 Mar 19620 2551 Apr 33489 4354 May 19799 2574 Jun 34473 4481 Jul 21749 2827 Aug 37361 4857 Sep 19536 2540 Oct 33272 4325 Nov 19536 2540 Dec 34394 4471 Annual 324000 42000
Energy purchased diesel [kWh/yr] Annual 463000
Bills(USD) 120000
5.2.2. Hybrid PV diesel unreliable grid system analysis
Figure 5.2 shows the combinations of the new component added to the generator and the grid. Combinations of new power sources will supply the same load to 120 households.
Figure 5.2 PV generator power supply added to the existing system.
The results of the monthly average production from the grid, the diesel generator and the PV are shown in Table 5.6. The impact of integration of PV on the energy production shows annual production up to 439 MWh. The PV impact on diesel consumption have a significant financial result.
Table 5.6 Annual energy purchased from grid and diesel generator modified system
Source Energy purchased from grid [kWh/yr] Energy Bill (USD)
Jan 20052 2607 Feb 24477 3182 Mar 17855 2321 Apr 25740 3346 May 13524 1758 Jun 26029 3384 Jul 15329 1993 Aug 28277 3676 Sep 14329 1863 Oct 26006 3381 Nov 19821 2577 Dec 30450 3959 Annual 262000 34000
Energy purchased diesel [kWh/yr] PV production [kWh/yr]
Annual 121000 439000
Bills(USD) 31000 53000
Table 5.7 summarizes the operational cost for the basic diesel generator system connected to the grid and the PV-diesel hybrid grid connected system. The diesel electricity cost is 0.26 USD/kWh. The grid electricity cost is 0.13 USD/kWh and the PV electricity cost according to the simulation result is 0.12 USD/kWh.
Table 5.7 Basic and hybrid system operational cost
Source
Operational cost (USD/yr) Basic system Hybrid system
PV system 52672
Diesel generator 120374 31372
Grid 42076 34046
Total 162000 118000
5.2.3. Greenhouse gas emission
The Lebanese government has planned to increase the share of renewable energy to 12% by 2020. This plan is taken into consideration by using the PV-diesel hybrid system to reduce the pollution and the greenhouse gases emitted from electricity generation. This system has significantly reduced the pollutant of carbon dioxide from 776 to 272 tons per year which is a reduction of 65%. Table 5.8 shows the difference of greenhouse gas emission between the result of the existing system and the modified system designs.
These calculations are performed by HOMER. The advantages of this eco-friendly system are healthier environment, lower electricity and reduction of medical bills, under 25 years project lifecycle.
Table 5.8 Greenhouse gas emission
Pollutant Emission [kg/yr]
System type Existing
Diesel+Grid Modified PV-diesel-grid
Carbon dioxide 775817 271662 Carbon monoxide 1410 262 Unburned hydrocarbons 156 29 Particulate matter 106 19.8 Sulfur dioxide 2034 931 Nitrogen oxides 13016 2689
A previous study performed by (Riasat, et al., 2013 b) mentioned the benefit of using PV over diesel which saves 18440 USD annually at a rate of saving 20 USD per ton of CO2.
The total lifetime of 30-years calculations has a revenue of 553200 USD.
6 Discussion and conclusions
The main goal of this thesis is to design and optimize a photovoltaic system integrated with an already existing diesel-unreliable grid system. The system will supply power energy to one hundred-twenty households connected to an unreliable grid and a backup diesel generator.
Before starting the designing phase, there is a need to review the literature on PV-diesel hybrid system studies to find out new technology to add. The system design started with a detailed study on data input collection that could be used with HOMER. One fundamental data estimation was the load profile for the village. This part was based on facts according to diesel bills information and grid residential electricity consumption for one hundred twenty households.
The procedure to create an average consumption profile, was to estimate consumption for one resident based on daily useful equipment power consumption. The simulation performed with HOMER required an imported file that contains the annual load profile covering 8760 consumption hours. This file was created using excel, which was also adapted for HOMER. The included necessary graph was added to the excel tool to be automatically updated for thesis documentation. Simultaneously, all components, costs and range were added to build up the PV-diesel hybrid system. Due to the daily load, a manual calculation was done to estimate the PV array size and battery bank needed.
An existing system situation discussion shows the rotation of the outage schedule between the diesel generator and the unreliable grid, fuel-fossil consumption cost, and financial analysis of facts based on real bills for the diesel subscribers. An example of diesel energy subscription for two separate subscribers is shown in Table 5.2.
The discussion about system modeling is to select the most available component in the market. The PV polycrystalline panels and the size can vary between 160W to 280W. The PV cost of 1200 USD/kW and a range of PV sizes were introduced in HOMER, so that the optimized size is 270 kWp which, in combination with other energy sources, shows the
higher penetration PV system as in Figure 5.1 (b). Also, it was possible rolling blackout using two different rates, Rate1 for supplied hours and Rate2 for shortage hours
Once this was done, a range of different battery sizes for different models, which are the vented-lead-acid, tubular-plate and deep-cycle battery, (Hoppecke 24 OPzS 3000) is considered for the PV system. This battery is available in the market and in the HOMER technology data base. Inverter selection is the critical part in Lebanon, and the solution is to investigate the import market situation from Europe to use the SMA 15000kW inverter. Added to this inverter, the connection between the PV system, the diesel generator and the unreliable grid to shift the power supply according to the schedule of the rolling blackout, an extra inverter will be used between the PV system and the diesel generator where the first priority is using PV integrated system XANTREX DR inverter/charger (Appendix C). An automatic switch transfer is included in a real system to start and stop energy power resources, in case of low PV power supply and battery bank capacity (Appendix D).
The PV panel model selection is the polycrystalline ECO280A156P-72 with 280W and 72 cells. Together with the 15000 kW SMA sunny inverter led to preliminary calculations on string length sizing. As a result, a five strings with 17 modules in each, could be connected to the inverter input. In comparison the HOMER simulation for PV-diesel hybrid system shows the system energy resources where the PV size is 270 kWp and the converter
115 kW. The critical comparison with this case and module size selected at 280 W, gives a 964 total number of modules needed, and the total input strings is 85 modules which will get a quantity of 11 inverters. This result is acceptable, but the converter with 115 kW size shows that at least 8 inverters are needed. This result from the simulation shows the difference between the components selected, where a combi inverter in HOMER database is different from the real SMA Sunny inverter.
Several steps were performed in the simulation: parametric variation for the simulation of the sensitivity to study further, which was presented in graph and tables in section 3.2. This study started with the basic simulation system showing the existing situation for 120 households using diesel generator and unreliable grid subscriptions.
The second system configuration was simulated with the grid and the PV system integrated, followed by the new configuration of the diesel generator and the PV system. Each system was simulated separately with the same cost and a variety of size range. The last system was the main PV-diesel hybrid system connected to the unreliable grid.
The simulation results work is a detailed simulation on the output system size, initial cost, net present cost, operational cost and levelized cost of energy. In addition to the sizing process and the economic analysis, a daily production on fossil fuel consumption and the generator operation hour over one year are included in the results. The simulation graph shows the results of the average monthly electricity production for the energy sources included in every configuration. Due to these findings, further work analysis is performed on the financial part of the project and more detailed information on power production, fuel savings and CO2emission reduction is provided.
The financial simulation result is based on the actual market component price, the purchase price per kWh for subscribers connected to the grid as well as to the diesel generator. The electricity from the grid, at 0.13 USD/kWh fixed cost, and the electricity from backup subscription at 0.26 USD/kWh. The PV-diesel hybrid system shows an LCOE of 0.12 USD/kWh compared to 0.24 USD/kWh from the basic simulated system. This result highlights the merit and potential market of PV in Lebanon.
The limitation in this analysis was the 200 kVA diesel generator used in this part of the village. HOMER simulation shows that the generator size in the basic system was not enough to optimize the lower cost system. It starts purchasing electricity from the grid at a higher rate (100 USD/kWh), which was considered for the outage schedule configuration. To perform the simulation, the diesel generator size was increased to 288 kW and the result
shows high cost fuel consumption. Further analysis on annual energy production is shown in Table 5.5
The modified system simulation result shows significant impact of the PV on the energy production, fuel consumption and financial situation for the whole project. PV annual production was up to 439 MWh. Table 5.7 summarizes the operational cost for the diesel generator and the grid basic system at 162000 USD, while the operational cost from the modified system was 118000 USD. A similar study was conducted by (Achraf, 2014 c) on a PV-diesel hybrid energy generation system for the IUT academic building in Bangladesh. They simulated two models: one with only diesel generators, and the other with a PV-diesel hybrid generator. The result of their investigation shows that the proposed PV-diesel hybrid model could reduce to 10BDT/kWh compared to the conventional model (1 Dollar = 78 BDT).
The result of this project related to greenhouse gas emission strengthens the argument of the Lebanese government plan to increase the share of renewable energy to 12% by 2020. This system has significantly reduced the pollutant gas production by 65% as shown in Table 5.8.
Another idea proposed in this study, is autonomous PV installation for every household, to produce electricity in combination with the grid. Figure 4.3 shows that 420 kWp PV array
size with battery bank consisting of 456 batteries and 288 kW converter will supply the 120 households shortage hours. Figure 4.4 shows the 100% PV penetration which covered the household’s energy demand, and some kilowatt hours were supplied by the scheduled grid hour generation. Each household could have four batteries and 3.5 kWp PV size on the roof
satisfying its own consumption and feeding into the grid the excess energy. A 1.5 kWp
system, with very close design and components, was installed in 2012 in the same area near this part of the village. This resident system, has four days of autonomy to produce sustainable electricity. The resident grid connection is still used to operate heavy devices.
Future recommended work would be a further study on the rest of diesel generators to cover the whole village. In addition to this, it would be interesting to collect yearly load data from the household’s electricity consumption for accurate profile load estimation. This information is very useful to implement similar projects across the country and decrease the diesel generator operation hours and size.
7 References
Achraf, H. A., 2014. 2014 2nd International Conference on Green Energy and Technology (ICGET). Design and economic analysis of PV-diesel hybrid system for particular section of IUT campus, pp. 91-94.
Che Fung, C., Buntoon, W. & Chern, V. N., 2002. An investigation on the characteristics and performance of a PV-diesel hybrid energy system for teaching and research. 2002 IEEE
Region 10 Conference on Computers, Communications, Control and Power Engineering TENCON '02. Proceedings, Volym 3, pp. 1962 - 1965 .
Chedid, R. o.a., 2015. Techno-economic analysis of a PV generator operating in a hybrid diesel-unreliable grid system. 2015 International Conference on Clean Electrical Power (ICCEP), pp. 134-139.
Datta, M. o.a., 2011. A Frequency-Control Approach by Photovoltaic Generator in a PV– Diesel Hybrid Power System. IEEE TRANSACTIONS ON ENERGY CONVERSION, Volym 26.
Dehbonei, H., Nayar, C. V. & Borle, L., 2004. A Multi-Functional Power Processing Unit for an Off-Grid PV Diesel Hybrid Power System. 2004 35th Annul IEEE Power Electronics
Specialists Conference, pp. 1969-1975.
HOMER Legacy, v. b., 2012. Kayako. [Online] Available at:
http://support.homerenergy.com/index.php?/Knowledgebase/Article/View/435/1/10433----how-to-download-and-install-homer-legacy-v268
Lebanon, B., 2015. World weather & climate information. [Online]
Available at: https://weather-and-climate.com/average-monthly-hours-Sunshine,Beirut,Lebanon
Lecoufle, D. & Kuhn, F., 2012. Photovoltaic as economic alternative for a diversification of the energy mix
in new energy markets – example Chad. Stuttgart, u.n.
MEDSOLAR, 2015. Web document The electrical problem in Lebanon, Palestine and Jordan. [Online] Available at: www.medsolarproject.com/index.php/en/noticias/1
NASA, 2012. Photovoltaic Geographical Information System - Interactive Maps. [Online] Available at: http://re.jrc.ec.europa.eu/pvgis/apps4/pvest.php
Republic of Lebanon, 2015. Republic of Lebanon - unfccc. [Online] Available at: www4.unfccc.int/.../Lebanon/.../Republic%20of%
Riasat, M. T. o.a., 2013. Design and performance analysis for hybrid PV-Diesel-Battery power system for residential area in Dhaka city. 2013 IEEE 39th Photovoltaic Specialists Conference
(PVSC), pp. 1515 - 1520.
Shihadeh, A. o.a., 2012. American University of Beirut. [Online] Available at: https://www.aub.edu.lb/.../20121217_IFI_Diesel_F. Weather, 2012. WeatherSpark. [Online]
Yi-feng, J. & Shu-wen, W., 2010. Village Electrical Load Prediction by Genetic Algorithm and SVR. 3rd IEEE International Conference on Computer Science and Information Technology (ICCSIT),
2010, Volym 2, pp. 278 - 281.
Zein, A. & Bazzoun, G., 2013. 2013 25th International Conference on Microelectronics (ICM). Integration of Photo voltaic Generators into Existing Diesel Mini-Grids in Lebanon , Issue , pp. 1-4.
List of Appendices
Appendix A: Module component specification sheets………..41
Appendix B: SMA sunny tripower inverter………... 43
Appendix C: DR inverter/charger………....45