MIRIAM
_____________________________________________
Models for rolling resistance In Road Infrastructure Asset Management systems
Rolling Resistance – Measurement Methods for
Studies of Road Surface Effects
Authors:
Ulf Sandberg,
Swedish National Road and Transport Research Institute (VTI)
Anneleen Bergiers,
Belgian Road Research Centre (BRRC)
Jerzy A. Ejsmont,
Technical University of Gdansk (TUG)
Luc Goubert,
Belgian Road Research Centre (BRRC)
Marek Zöller,
The Federal Highway Research Institute (BASt)
Deliverable # 2 in MIRIAM SP 1 2012-02-26
Document type and No. Report MIRIAM_SP1_02
Sub-project SP 1 Measurement methods and source models
Author(s) Ulf Sandberg (a), Anneleen Bergiers (b), Jerzy A. Ejsmont (c), Luc Goubert (b), Marek Zöller (d)
Authors' affiliations (acronyms) (a) VTI, (b) BRRC, (c) TUG, d (BASt) Contact data for main author ulf.sandberg@vti.se
Document status and date Deliverable Version 120226 Dissemination level Public
Foreword
MIRIAM, an acronym for "Models for rolling resistance In Road Infrastructure Asset Manage-ment systems", is a project started by twelve partners from Europe and USA. They have collectively contributed internal and external funding for this project. The managing partner is the Danish Road Institute.
The overall purpose of MIRIAM is to provide information useful for achieving a sustainable and environmentally friendly road infrastructure. In this project, the focus is on reducing the energy consumption due to the tyre/road interaction, by selection of pavements with lower rolling resistance – and hence lowering CO2 emissions and increasing energy efficiency.
MIRIAM has been divided into five sub-projects (SP). The work reported here has been made within SP 1 "Measurement methods and surface properties model".
A first phase of the project has included investigation of pavement characteristics, energy efficiency, modelling, and raising awareness of the project in order to secure economical and political support for a second phase. The second phase will focus on development and implementation of CO2 controlling models into the road infrastructure asset management
systems.
The website of MIRIAM is http://www.miriam-co2.net/ where extensive project information can be found.
The order of authors on the title page, following the main author Ulf Sandberg, is alphabetical and is not related with the extent or importance of the co-authors' contributions.
This report is the second Deliverable of SP 1. The Deliverables of Phase 1 are the following: Deliverable 1:
“Rolling Resistance – Basic Information and State-of-the-Art on Measurement methods” Deliverable 2:
"Rolling Resistance – Measurement Methods for Studies of Road Surface Effects" Deliverable 3:
“Comparison of Rolling Resistance Measuring Equipment - Pilot Study" Deliverable 4:
“Road surface influence on tyre/road rolling resistance"
These are all represented by written reports. See the MIRIAM website to download the reports, or to check where the reports may be downloaded.
Acknowledgements and disclaimer
It is gratefully acknowledged that the studies reported here and the production of this report have been funded by the following organizations (in alphabetical order only):
Belgian Road Research Centre (BRRC) Pooled funds of project MIRIAM
Swedish National Road and Transport Research Institute (VTI) Swedish Transport Administration (STA)
Technical University of Gdansk (TUG), Gdansk, Poland The Federal Highway Research Institute (BASt)
The funding organizations have no responsibility for the contents of this report. Only the authors are responsible for the contents. Any views expressed are views of the authors only.
Table of contents
SUMMARY IX
1 INTRODUCTION 1
2 PURPOSE, LIMITATIONS AND CONCEPT 2
3 MEASURES RELATED TO ROLLING RESISTANCE OF VEHICLES 3
3.1 Direct measures of rolling resistance 3
3.2 Indirect measures - Road surface parameters influencing rolling resistance useful for prediction purposes 4
4 DISCUSSION ABOUT MEASURING VERSUS PREDICTING ROLLING RESISTANCE 5
4.1 Availability of predicting parameters 5
4.2 Prediction of rolling resistance 5
4.3 Measuring rolling resistance but predicting unevenness influence 5
4.4 Measuring rolling resistance versus predicting it 6
5 MEASUREMENT METHODS 7
5.1 General 7
5.2 A few historical remarks 7
5.3 Existing standards 8
5.4 Laboratory drum 9
5.5 Trailer method 11
5.6 Coastdown 12
5.7 Steady State Wheel Torque 13
5.8 Fuel consumption 13
5.9 Fuel consumption versus road parameter mapping 14
5.10 Overall evaluation and recommended method 14
6 EXISTING TRAILER EQUIPMENT 16
6.1 General 16
6.2 BASt 16
6.2.1 Test vehicle (trailer) 16
6.2.2 The BASt measurement method 17
6.2.3 Calibration procedure 18
6.2.3.1
Introduction 18
6.2.3.2
Static calibration 18
6.2.3.2.1 Introduction 18
6.2.3.2.2 Operating point 19
6.2.3.2.3 Functional correlation between longitudinal force and difference of height 19
6.3 BRRC 20
6.3.1 Test vehicle (trailer) 20
6.3.2 The BRRC measurement method 21
6.3.3 Calibration procedure 22
6.4 TUG 24
6.4.3 Calibration procedure 26
6.5 Other trailers – described in earlier MIRIAM report 27
6.6 Other trailers – supplement 27
7 REPEATABILITY AND REPRODUCIBILITY 31
7.1 Short-term repeatability according to TUG repeated measurements in Sweden 31
7.2 Belgian measurements in project Artesis 31
7.2.1 Short- and long-term repeatability 31
7.2.2 Calibration issue for the BRRC trailer 33
7.3 Short-term (within-day) repeatability according to the MIRIAM RRT project 34
7.3.1 Introduction 34
7.3.2 Results for the BASt trailer 34
7.3.3 Results for the BRRC trailer 35
7.3.4 Results for the TUG trailer 35
7.3.5 Comparison of the trailers 36
7.4 Short-term (day-to-day) repeatability according to the MIRIAM RRT project 36
7.4.1 Introduction 36
7.4.2 Results for the BASt trailer 36
7.4.3 Results for the BRRC trailer 36
7.4.4 Results for the TUG trailer 37
7.5 Reproducibility according to the MIRIAM RRT project 38
7.5.1 Introduction 38
7.5.2 Comparison of results obtained with the BASt and TUG trailers 38 7.5.3 Comparison of results obtained with the BRRC and TUG trailers 41
7.5.4 Trailer-related differences 43
8 INFLUENCE OF TESTING PARAMETERS 44
8.1 Tyre 44
8.2 Tyre condition (quality, wear, rubber hardness) 46
8.3 Tyre load 49
8.3.1 Artesis project - background 49
8.3.2 Artesis project – effect of tyre load 49
8.4 Tyre inflation 50
8.5 Tyre warmup 51
8.6 Speed 51
8.7 Temperature 52
8.8 Road curvature, ruts, slope and cross-slope 53
8.9 The influence of wind shielding 53
9 REFERENCE TYRES 54
9.1 Introduction 54
9.2 Reference tyres for noise measurements 54
9.3 SRTT and AAV4 54
9.4 SRTT and AAV4 as rolling resistance reference tyres? 55
10 IDEAS FOR FURTHER WORK 57
10.3 Further studies of the coastdown method 58
10.4 Drum method 58
10.5 Improvement of the BRRC trailer 58
10.6 Use of reference surface 59
10.7 Use of megatexture and enveloped MPD parameters 59
10.8 Study how orientated textures affect rolling resistance 59
10.9 Study the effect of drum curvature on rolling resistance measurements compared to testing on a flat surface 59
11 FURTHER WORK IN MIRIAM: MAJOR PROBLEMS TO SOLVE 60
11.1 Background 60
11.2 Unevenness 60
11.3 Heavy vehicles 60
11.4
60 Conduct a new RRT, including the trailer as well as coastdown method and use at least one heavy vehicle in coastdown
11.5 Reproducibility and stability of calibrations 60
11.6 Stability of reference tyres 60
11.7 Enveloped MPD 61
11.8 Temperature correction 61
11.9 International standard measurement method 61
12 RECOMMENDATIONS REGARDING EQUIPMENT AND OPERATION 62
13 CONCLUSIONS 63
SUMMARY
MIRIAM has established a sub-project (SP), designated SP 1, to deal with measurement methods for rolling resistance and related issues. This subject forms the most fundamental basis for the MIRIAM ambition to consider rolling resistance in pavement management or other types of infrastructure systems. Without robust measurement methods and equipment that can use them there will be no reliable data as input to such systems and the end result will be most uncertain, if useful at all.
This report is intended to provide basic knowledge about measurement methods which relate to the road surface influence on rolling resistance, as well as to provide some information about equipment that are useful for collecting rolling resistance data. The methods used were literature studies, compiling experience from recent research projects (not yet reported), using other Deliverables in MIRIAM SP 1 and, above all; a rather extensive field experiment within MIRIAM called the round robin test.
The work in MIRIAM is the first time one has looked at rolling resistance measurement methods applicable to road surface effects systematically, and evaluated various measure-ment equipmeasure-ment, both in some detail and from an overall point of view.
As an overall conclusion it may be stated that rolling resistance measurement methods are still in their infancy. This applies to testing of tyres, where the many standards produced so far totally miss that the rolling resistance is a tyre/road interaction and therefore have serious drawbacks. This also applies to testing road surfaces where the tyre/road interaction has indeed been a major concern from the beginning, but where field testing appears to be extremely difficult.
In the MIRIAM round robin test (RRT), conducted in June 2011, the results of using three trailers for measurement of the rolling resistance of 11 test sections on the IFSTTAR test track in Nantes have been analyzed. This experiment is the subject of a separate report, but many of the results are used in this report. It is the major source of information for this report. However, before the RRT was conducted the partners involved in SP 1 met and discussed the major measurement issues; including what equipment to use, and test parameters; such as tyre load, inflation pressure, test speeds, etc. This was a first attempt of "standardization". In the RRT, essentially, the trailer method was used, with some supplements by the drum method. Two drum facilities and three trailers have been available. The trailers came from BASt, BRRC and TUG. In addition, BRRC made texture measurements, and IFSTTAR supplemented with some other data, as well as taking care of practical matters. Comparison of all the rolling resistance equipment has shown partly inconsistent and questionable results. While repeatability within the same day was shown to be acceptable to excellent for the three trailers (between 1 and 3 % of the actual Cr), repeatability between consecutive days was
unacceptably poor (between 7 and 25 % of the actual Cr). The latter did not include the TUG
trailer which did not conduct such tests.
Reproducibility was found to be totally unacceptable, with large differences between the trailers (up to 40 %).
Only one of the trailers showed consistent measurement results with respect to repetitions, different speeds and ranking of surfaces with different tyres.
Despite the partly good, partly poor results, the RRT was conducted in a careful and successful way, given the time and economic resources that were available. All test crews performed their tasks with great ambition and competence. The weather conditions were also favourable.
Some of the reasons for the problems are identified and can be corrected (such as the lack of cover over the test tyre for one trailer). Other error sources are identified, such as tempe-rature variations, but it is not yet known what the most relevant tempetempe-rature correction is. Also, some of the test sections were a little too short; especially for the testing by the BASt trailer.
It must be concluded that one of the most serious problems is the instability from day to day of calibrations and this must be studied much more.
The tyres used seem to have been well chosen. They performed approximately as expected and the SRTT and AAV4 tyres so far seem to be useful as reference tyres in the next few years; at least they may serve as such until better tyres are identified.
Whereas Phase One provided fair possibilities to study rolling resistance of car tyres, there was very little possibility to study measurements with heavy vehicles and their tyres. As the latter are the sources for a major part of the transportation fuel consumption and air pollution (perhaps up to half of it), this means that Phase One of MIRIAM SP1 had resources to address only a limited part of the measurement problem.
This report includes comprehensive lists of research needs, both in general and within the next Phase of MIRIAM.
Phase One of MIRIAM gave the partners a lot more knowledge about rolling resistance measurements, which will be most useful in further work. The work and its result have created a good platform from which further steps can be taken in Phase Two of MIRIAM. This report should provide major progress towards the goal of producing a useful measurement method and standard.
1 INTRODUCTION
Other parts of project MIRIAM have demonstrated that tyre/road rolling resistance contribu-tion by road surfaces are influenced substantially by texture and unevenness and maybe other fundamental road surface properties as well. Despite the influence this has on energy consumption and CO2 emissions, rolling resistance is hardly ever given any importance in
road management, whereas the tyre contribution is given a lot of attention; even regulations. This is due to a general ignorance about the effect of road surfaces on rolling resistance which, in turn, is due to the lack of practical measurement methods by which one could collect data.
Standard rolling resistance measurement methods are indeed available but only with respect to testing of the tyres. These are measured on laboratory drums using ISO and SAE methods but taking these methods out on the road is virtually impossible.
In order to develop and study measurement methods, there must be a basic understanding of the influencing parameters as well as what energy losses that should be included in the concept of rolling resistance. A report, which intended to provide basic knowledge about the influence on rolling resistance of various parameters, suggest a definition of rolling resistance and provide some detailed state-of-the-art knowledge about the measurement methods and equipment that are useful for collecting rolling resistance data, is already published within project MIRIAM [Sandberg (ed), 2011].
In parallel to this work, another Deliverable in MIRIAM has explored the road surface influence on rolling resistance; the work of which has several issues in common with measurement methods [Sandberg et al, 2011].
This present report focuses on the measurement methods suitable to determine the road surface influence on rolling resistance and attempts to bring the subject to a new level of development. It explores the major measurement problems and suggests how to solve or get around them, recommends the most suitable method and finally presents a first draft for a standard for such a method.
2 PURPOSE, LIMITATIONS AND CONCEPT
The overall purpose of project MIRIAM is to study the potential for saving energy and CO2
emissions by adding rolling resistance data in road surface management systems.
The particular purpose of this report is to provide basic and up-to-date knowledge about the measurement methods which are suitable to measure the influence of road surfaces on vehicle rolling resistance.
The concept behind this report is the following:
Rolling resistance is one of the most important functional properties of road pave-ments, applicable to the entire road network, which means that road authorities need to have information about it and to be able to control it
The direct measurement of rolling resistance is very difficult and requires the use of rather advanced equipment and methodology, operated by very skilled and experienced staff. Consequently, direct measurement of rolling resistance is possible only on a very small part of the road network
Measurement methods and equipment for rolling resistance related to road surface influence are underdeveloped and need further development, testing and validation. Especially, development and testing must focus on a number of difficult-to-control
influencing parameters (temperature is one of them) as well as how to make measurements relevant for heavy vehicles without having to use heavy vehicles. Also selection, availability and stability of reference tyres are crucial problems.
With regard to limitations, it is important to note the following:
Rolling resistance is an interaction between tyre and road; although for the purpose of serving MIRIAM, this project has its focus on the road surface contribution and deals with tyres only as reference tyres for measuring purposes
Although it contributes significantly to driving resistance, air resistance of the tyres is not a parameter intended to be included in the relations studied here as it is not a road-related property.
3 MEASURES RELATED TO ROLLING RESISTANCE OF VEHICLES
3.1 Direct measures of rolling resistance
The most relevant measure of rolling resistance, as well as practical to use, seems to be something based on the force (Frr) that is required to move the rolling tyre in the desired
direction. However, it is clear that this force will depend on the load that is applied to the wheel and thus the tyre.
Studies have found an approximately linear relation between rolling resistance and wheel load, represented by a force Fz (equal to the mass m of the load times the gravitational
constant g). Since wheel loads can vary under different conditions, a near-constant coefficient, rolling resistance coefficient, RRC or Cr (both terms are commonly used), has been created to represent the characteristic of tyre/road rolling resistance: the dimensionless ratio of rolling resistance to wheel load: RRC = Cr = Frr/Fz. ISO 28580 uses the notion Cr.
Thus:
Rolling resistance coefficient (RRC) = Cr = Frr/Fz
where the forces Frr and Fz (see the preceding paragraphs) are magnitudes and not vectors.
This coefficient in turn depends on several tyre and road surface parameters as well as (to some extent) the vehicle speed. It is important to note that the RRC or Cr is a relative measure. It can be used to compare tyres and pavements.
Typical values of Cr for tyres in new condition are in the range 0.006 to 0.015 for passenger car tyres, and 0.004 to 0.012 for heavy truck tyres [FEHRL, 2006-1][FEHRL, 2006-2]. It is substantially lower for heavy vehicle tyres than for light vehicle tyres, not the least due to the higher inflation.
However, the problem is that rolling resistance of a full vehicle is not identical to that of the tyre/road interaction (times the number of tyres), and its measurement includes or may not include some components which are arguable. An attempt to analyze these various contribu-tions to driving and rolling resistance of a driving vehicle and a logical terminology was made in [Sandberg (ed), 2011]. A graph from that report is reproduced in Figure 3.1.
It is known from [Sandberg et al, 2011] that the road surface causes not only energy losses in the tyres but also in the suspension system which provides the link between the tyres and the vehicle chassis. To some extent, losses occur also in parts of the transmission and in the wheel bearings, but the road surface does not have any obvious influence on those.
It is important to remember that when it comes to the road surface influence of vehicle rolling resistance one must include both the tyre and the suspension losses. These two contribu-tions may be measured as one integrated "vehicle rolling resistance" parameter or as a pure "tyre rolling resistance" parameter plus a suspension contribution by two different measuring systems.
For wheel bearings and transmissions in good condition (which it is assumed that any measuring system should be) present knowledge suggests that one may neglect these contributions as they do not change the relative influence of the road surface on the measured resistance.
It follows that the rest of this report is focused on tyre rolling resistance and the suspension losses related to the road surface.
Inertial resistance
(Vehicle) Gravitational resistance
Propulsion resistance
Level 1 Level 2 Level 3
Figure 3.1: Illustration of the suggested terminology structure (only the upper 3 levels). See further explanations in [Sandberg (ed), 2011].
3.2 Indirect measures - Road surface parameters influencing rolling
resistance useful for prediction purposes
At least at present and in the foreseeable future, the direct measurement of rolling resistance is very difficult and requires the use of rather advanced equipment and methodology, operated by very skilled and experienced staff. Consequently, direct measurement of rolling resistance is practical only on a very small part of the road network and for research purposes.
For larger networks, an alternative possibility is to predict rolling resistance from other road surface parameters; especially from such parameters that are often collected routinely by road surveying vehicles. Such a method would require as a minimum a collection of the Mean Profile Depth (MPD) measured according to ISO 13473-1, and the International (Road) Roughness Index (IRI) measured according to the international standard ASTM E1926 – 08. Once these parameters have been measured one may use the source model suggested in [Sandberg et al, 2011] to estimate the Cr values of road surfaces, with or without including also the suspension losses. However, the present report will deal mainly with the direct measurement of rolling resistance.
(Vehicle) Driving resistance Vehicle rolling resistance (Vehicle) Aerodynamic resistance Engine resistance Auxiliary equipment resistance
Body air resistance Tyre air resistance Tyre/road rolling resistance
Bearing resistance
Transmission resist. (churning & mech.) Suspension resistance
4 DISCUSSION ABOUT MEASURING VERSUS PREDICTING
ROLLING RESISTANCE
4.1 Availability of predicting parameters
MPD and IRI are probably the two most commonly and widely measured parameters by the kind of road surface surveying vehicles that are used by most national and/or regional road authorities in industrialized countries in order to collect data for their pavement management systems. Some countries collect them year by year; some do it at less frequent intervals. MPD is often collected both in wheel tracks and between wheel tracks. Therefore, the MPD and IRI parameters are suitable for use in a prediction scheme for rolling resistance, since they would allow, in principle, a nationwide estimation of rolling resistance properties.
Other parameters that are widely collected include rut depth (transverse profile), megatexture and skid resistance.
4.2 Prediction of rolling resistance
In another MIRIAM report it is suggested that Cr may be predicted as follows [Sandberg et al, 2011].
The best source model for the road surface influence is currently proposed to be: Cr = Rolling resistance coefficient = C0 + 0.0020·MPD + X·IRI
where MPD is Mean Profile Depth in mm, measured according to ISO 13473-1 and X is a constant yet to be determined
and "C0" is a constant unique to a certain tyre and several other circumstances; usually in the range 0.0080 to 0.0100. A reasonable "best average" may be 0.0090. C0 can be considered to be the average (for the test tyres) Cr when run on a completely smooth texture (which should never exist on roads but is the ISO 28580 standard surface on drum facilities). In this case the equation would be:
Cr = 0.0090 + 0.0020·MPD + X·IRI
This simple model is useful over a speed range of at least 50-110 km/h for the rolling resistance part of the driving resistance. Suspension losses are included only if the IRI term above is specified by assigning a number to its constant "X".
The equation is based on light vehicle data. For heavy vehicles, one may use the same model, scaled to representative values of Cr for heavy vehicle tyres, as long as no better
model is available, but one must be aware that it is still very uncertain for this category.
4.3 Measuring rolling resistance but predicting unevenness influence
Present practical measurement equipment, i.e. rolling resistance trailers, seem to be taking road unevenness effects (IRI) into no or questionable account [Sandberg et al, 2011]. At least the TUG trailer seems to be insensitive to at least low and medium unevenness. To measure the unevenness effect on rolling resistance separately is presently very difficult, with no appa-rent equipment available for this particular purpose.
Until such equipment is available, a possibility that should be considered is a "hybrid solution" consisting of measuring the Cr by trailers but adding the IRI contribution by a prediction. This of course is possible only when the "X" in the equation above has been determined; something which should be a primary objective of the next phase of MIRIAM.
4.4 Measuring rolling resistance versus predicting it
Direct measurement of Cr is associated with several uncertainty factors, such as tempera-ture, poor reproducibility, questionable stability of test tyres, etc. It can be made only to a limited extent as driving around and measuring Cr on an extensive road network is very time consuming and expensive, and exposes the equipment and tyres to substantial wear.
Prediction of Cr based on MPD and IRI has the problem of the correctness and representa-tivity of the model on which the prediction is based; also on the uncertainties of the collected MPD and IRI values. On the other hand, as MPD and IRI values are probably available for a very extensive road network, estimation of rolling resistance for such a large network can be made. Weather and temperature will have no effect. Instead of doing this on-the-road it can be calculated easily, which is inexpensive and free from the hazards when doing road measurements.
It should be obvious that for road management purposes the latter option is the preferable one. However, until the source models are complete and of high quality one will have to make direct measurements of rolling resistance. Even when the models are considered satisfactory, they must be validated now and then, and new surface types may come up which require further studies. Therefore, a limited extent of direct rolling resistance measure-ments will always be necessary. However, these measuremeasure-ments must be of high quality in all respects if they are going to serve as validation or calibration of prediction methods.
The situation is somewhat similar with respect to environmental noise immission, where prediction methods are widely used as a rule, and more or less nationwide, but where direct noise measurements are also conducted, but to a very limited extent.
5 MEASUREMENT METHODS
5.1 General
Measurement methods and equipment for rolling resistance are the primary focus of SP 1 of MIRIAM. The methods which are available can be grouped into five general categories: Laboratory drum (DR) method: Laboratory measurements made with test tyres rotating
on drums. The drums may be equipped with sandpaper or replica road surfaces, apart from the "normal" steel surface of the drum.
Trailer (TR) method: Measurements with test tyres in a special towed trailer rolling at constant speed. The trailer may be designed either for passenger car tyres or for heavy truck tyres.
The Steady State Wheel Torque (WT) method: A test vehicle (car or truck) is driven at constant speeds 20-75 km/h while the driving torque of one (driven) tyre, together with the relative wind speed and direction are continuously measured. The driving torque is divided by the dynamic tyre radius and corrected for ambient wind to obtain the driving force required to overcome all resistive forces with the exception of driveline losses. Coastdown (CD) method: Coastdown measurements are using any type of vehicle,
measuring deceleration and a number of other parameters, from which rolling resistance may be calculated. The test vehicle is coasted (gearbox in neutral) from a higher to a lower speed.
Fuel consumption (FC) method: Fuel consumption measurements are using especially instrumented (normal) vehicles, from which rolling resistance may be calculated by means of a fuel consumption/rolling resistance model. A variant of this would be when using a vehicle not powered by fuel, such as an electric vehicle. Then the method should be called Energy Consumption (EC) method instead. Note that driver influence might be high in this method.
These methods can be supplemented by additional measurements of e.g. suspension forces. However it is necessary to realize that the choice of the measurement method implies also some assumptions and limitations concerning the model derived from the results. The main challenge in most cases consists in the difficulty of isolating the effects of rolling resistance from other contributors to the total driving resistance and fuel consumption.
A State-of-the-Art report about rolling resistance measurements is produced by [Sandberg (ed), 2011]. This will give more detailed information than this chapter.
This chapter is focused on measurement methods applied for measurement of road surface influence on rolling resistance. Tyre testing is treated only very briefly.
5.2 A few historical remarks
Rolling resistance measurements on tyres were introduced essentially in the 1970's, partly pushed by the "oil crisis"; most commonly made with the drum method. Maybe a few were made even earlier than that. For example, a measurement in 1928 is reported in [Agg, 1928]; see further [Sandberg (ed), 2011].
In most of the early measurements (more than 30 years ago) the test objects were tyres rather than pavements. An example when it was realized that also the road surface was an important factor is reported in [Williams, 1981]. Work at Dunlop Tyres in the U.K. to reduce rolling resistance of tyres around 1980 involved the use of a drum facility on which a number of tyres were tested on a number of replica road surfaces. Figure 5.1 shows some of the replica surfaces at the Dunlop facility. The results of these efforts are summarized in [Sandberg et al, 2011].
Figure 5.1: Sets of replica road sur-face segments for mounting on a drum. Photo by the main author, at the Dunlop Tyres Development Centre, in Fort Dunlop, Birmingham, U.K., in the 1980's (by permission).
5.3 Existing standards
There are a number of international or industry standards intended for measurement of rolling resistance of tyres. No standard or common practice has been published for measure-ment of rolling resistance properties of pavemeasure-ments. All standards so far are based on laboratory drum measurements.
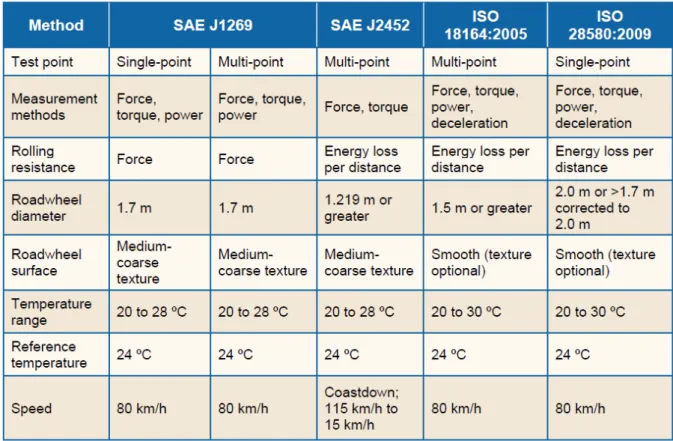
The existing test standards include two set by the Society of Automotive Engineers (SAE), SAE J1269 and SAE J2452, which may be seen as industry standards, and two set by the International Organization for Standardization (ISO), ISO 18164:2005 and ISO 28580:2009. These standards are used extensively in the tyre and automotive industries for rolling resis-tance measurement. Table 5.1 compares the available standards which are all based on the laboratory drum principle.
In addition, the United Nations Economic Commission for Europe (ECE) has issued a Regulation, ECE R117, which includes a measurement method for rolling resistance. This is not unlike the ISO standards and is expected to be revised for greater harmonization.
These standards may be used for testing the influence of road surface on rolling resistance provided the drums are equipped with relevant road surfaces. Normally, it is not possible or at least not safe to construct normal road surfaces on drums as centrifugal forces may cause particles to be thrown off. This problem can be solved by producing replicas, in epoxy or similar strong materials, of real road surfaces and mount them on the drum; an example of which is shown in Figure 5.1. An exception is when using a so-called internal drum; i.e. when the tyre is rolled on the interior rather than the exterior periphery of the drum. The German PFF facility is an example of the latter; see [Sandberg (ed), 2011].
Table 5.1: SAE and ISO standards for measurement of rolling resistance of tyres.
5.4 Laboratory drum
A typical laboratory test for rolling resistance consists of a test drum, a cylinder aligned with the centre of the drum, and a tyre to be tested. The tyre is held against the drum, which is run by a motor coupled to it. The tyre’s rolling resistance applies a braking effect to the drum’s rotation, and this effect is translated into measurements of forces, torques, decelerations, etc. Rolling resistance is then calculated from these measurements. Figure 5.2 shows the configuration of this procedure [Gent & Walters, 2005]. The Society of Automotive Engineers (SAE) and the International Organization for Standardization (ISO) have both prescribed test standards for this procedure.
The standards for rolling resistance testing include four common measurement methods (although not all of them are specified in each standard). These measurement methods include:
measurement of the resistive force at the tyre spindle (force method) measurement of the resistive torque on the drum hub (torque method)
measurement of the electrical power used by the motor to keep the drum rotating (power method)
measurement of deceleration after the driving force at the drum is discontinued (deceleration method).
During the measurement of rolling resistance, aerodynamic drag, which can account for up to 15 % of the laboratory measurement of rolling resistance [Gent & Walters, 2005], may need to be measured and subtracted from the result, and this is commonly though not always done. Because the magnitude of aerodynamic drag on the tyre in a laboratory test differs significantly from that on an actual vehicle, the inclusion of aerodynamic drag in laboratory tests makes the results unrepresentative of the real situation. However, because there are
practical limitations on the measurement of aerodynamic drag in some test methods, such as techniques to remove systematic errors associated with machine offset [Gent & Walters, 2005], some measurement methods (including the torque and power methods) do not mandate that aerodynamic drag be subtracted.
Test drum
Tire to be
tested Motor
Actuating cylinder
From Gent et al., 2005, pp 516
Figure 5.2: Typical test configuration for tyre rolling resistance. From page 516 in [Gent & Walters, 2005].
In addition to the measurement methods, the number of testing points can also differ, depending on the test condition. A single-point test includes only one setting for tyre pressure and tyre load, while a multi-point test includes a series of settings of tyre pressure and tyre load. Rolling resistance is then calculated from the regression of the multi-point measure-ments. Different testing standards prescribe different numbers of testing points.
SAE J2452, ISO 18164:2005, and ISO 28580:2009 all adopt the concept of “energy loss per distance travelled” as the definition of rolling resistance, but note that it is equivalent to a drag force with the unit Newton. For measuring the rolling resistance of car tyres, drums having a diameter of 1.7 m are the most common, while for truck tyres, drums with greater diameter (at least 2.0 m) are used.
Major facilities for drum measurements of rolling resistance include, but are not limited to: The PFF at the BASt, Bergish-Gladbach, Germany, see [Sandberg (ed), 2011] Two drums at the TUG, Gdansk, Poland, see [Sandberg (ed), 2011]
A great number of drums at TÜV-SÜD Automotive, Munich, Germany FAST at Karlsruhe Institute of Technology (KIT), Karlsruhe, Germany Three facilities at Standards Testing Labs (STL), Massillon, OH, USA
In addition, most technical centres at the tyre manufacturers have drums for testing rolling resistance
Among the above facilities, as far as the authors are aware, the only facilities which are equipped with road surfaces or replicas of such are the ones at BASt and TUG; see further description in [Sandberg (ed), 2011].
5.5 Trailer method
The trailer method is a method where rolling resistance measurements are made with test tyre(s) in a special towed trailer, while rolling at constant speed. The trailer may be designed either for passenger car tyres or for heavy truck tyres. The measurement may be made either of the torque on the test tyre, the towing force between towing vehicle and trailer, or the angle by which the tyre vertical support is displaced when a rolling resistance force is acting in the tyre/road interface (which is actually a measurement of the rolling resistance force on the tyre). See Figure 5.3 and further Chapter 10 in [Sandberg (ed), 2011].
Figure 5.3: The measuring principle of the BRRC and TUG trailers (simplified).
The trailer may be either a single-wheel trailer or a three-wheel trailer. In the latter case the test wheel is in the middle and there are two supporting wheels at the sides. There will normally be some kind of suspension, which may or may not be deactivated during measure-ment. Trailers of this type are normally designed for being towed by a powerful car or a van. The trailers may or may not have enclosures over the test tyre in order to avoid measuring the air resistance of the test tyre. The air resistance is of course part of the driving resistance of a vehicle and the tyre influences this, but when road surface effects are studied the air resistance is just a disturbing factor.
In principle, a heavy vehicle version may be constructed based on the same principle. How-ever, the only known heavy vehicle trailer so far is just a regular full-size four-wheeled (or more) truck trailer towed by a truck with measurement of the towing force in the tow bar or in the hook. In order to avoid the air resistance, the towing speed is very low. The method is sensitive to all kinds of irrelevant influences, such as wind, cross-fall, gradient, and measure-ments on trafficked roads are not practical.
A more advanced truck semitrailer device is under construction in Germany; see Chapter 10.9 in [Sandberg (ed), 2011].
One shall be aware that the rolling resistance force is extremely low in comparison to other forces. Typically it may be 0.5-1.2 % of the vertical force and load on the tyre. If one wants to measure it with an inaccuracy of 1 % of the measured value, one must reduce errors and irrelevant influences to less than 0.005 % of the tyre load (50 ppm); and this in a driving environment when speed is not exactly constant, where driving direction needs small
correc-tions all the time and where there may be ambient wind gusts, wind gusts from other vehicles, pavement ruts, varying cross-fall and longitudinal gradients. It goes without saying that this requires the utmost of design and analysis considerations. In some cases, patented technical solutions take care of some of the unwanted influences. Figure 5.4 illustrates this by showing a close-up of the mechanical design of the TUG trailer.
A problem with the trailer method is that it is unclear as to what extent road unevenness influences the measurements in a representative way; essentially the part which causes energy losses in the suspension. The wheel suspension may not be typical and it may even be blocked during measurements.
Figure 5.4: The central mechanical design of the TUG trailer. Wheel cover partly removed. Photo by Hans Bendtsen, DRI, Denmark, 2010.
5.6 Coastdown
A coastdown measurement on a road section is performed by letting a selected test vehicle, equipped with selected test tyres, roll freely (clutch down, gear in neutral position) between defined start and end points. The speed is measured continuously along the road section. The acceleration is either measured directly or is derived from the speed curves. A possible alternative is to measure the speed only at the start and end points.
The various resistive forces acting on the vehicle will make it slow down. The rolling tance is one of these forces. Air resistance is another major force. The larger the rolling resis-tance the larger the retardation becomes. Normally, measurements are made in both direc-tions on the road, in an attempt to "average out" influences such as gradient and wind, and to get highly varying conditions. Nevertheless, ambient winds may not be too high. By per-forming several coastdown measurements, under various conditions, it is possible to distin-guish and separate the contributions of the different resistances acting on the vehicle. Thus, most of the air resistance can be separated out from rolling resistance and by clever
measurement and analysis design one can separate a number of other energy losses as well such as in transmission and wheel suspension.
The coastdown method is equally sensitive to various influences as the trailer method, since the rolling resistance is such a small component of the total momentary forces (see above). It requires very careful measurement and analysis design, as well as experience and extensive competence. Its advantages are that it may equally well be performed with heavy vehicles as with light vehicles (albeit less practical and more expensive) and that also wheel suspension losses are measured.
See further Chapter 11 in [Sandberg (ed), 2011].
5.7 Steady State Wheel Torque
In New Zealand a special measurement method was developed in the late 1980's and early 1990's, called the steady state torque method [Cenek, 1994]. It essentially involves a test vehicle (both a car and a truck have been used) being driven at steady speeds between 20 and 75 km/h. At each speed, the driving torque of one (driven) tyre, together with the relative wind speed and direction are continuously measured. The latter are parts of an on-board anemometry system by which air resistance is controlled. The driving torque is divided by the dynamic tyre radius (1.03 x Static Radius) and corrected for ambient wind to obtain the driving force required to overcome all resistive forces with the exception of driveline losses. It should be noted that this method measures rolling resistance including the contribution by suspension losses.
The latter is one of the advantages with the method; another advantage is that it may be used also with a heavy vehicle. It shares the problems of the other methods, but in this case the elimination of the air resistance effect from the rolling resistance effect of the pavement is the major problem. For this reason, high speeds are not useful.
5.8 Fuel consumption
An indirect way of measuring rolling resistance is to measure fuel consumption (FC) and estimate the rolling resistance contribution by means of some model. At least this is feasible if one only wants to study the road surface influence, in which case one needs to determine an approximate rolling resistance contribution to FC. Or, one is satisfied with studying the road surface influence on FC. Such measurements have been made several times both in Europe and USA [Sandberg et al, 2011].
In the FC method, a test vehicle is used which is equipped with precision fuel flow meters. Also, vehicle speed must be measured with high precision and ambient air, fuel and engine temperatures should also be measured. Wind speed and direction affect results and should be measured as well. In some cases the air speed at some point near the vehicle may be measured.
FC measurements are made between two defined points on the road, in both directions, assuming a road is used with no or small gradients and bends with very high curve radius. This method is sensitive to the condition of all parts of the power unit, apart from all ambient and road parameters; especially wind conditions. The driver's skill to keep a constant speed, or the efficiency of a cruise controller, are also potential error sources.
5.9 Fuel consumption versus road parameter mapping
A rather special method of relating FC to road parameters was first proposed by Mr J Elsander of the Swedish Transport Administration. It is based on measurements made by one or more vehicles equipped with fuel flow meters and travelling over a large and varying road network. Fuel consumption is measured and recorded per (say) km. These FC values per km are then regressed on corresponding road parameters per the same km. Such road parameters may be MPD, megatexture and IRI – parameters which should be available for the road network or maybe even collected by the same vehicle at the same time as when making FC measurements. An obvious possibility is to use the road surveying vehicles which collect data for the national and regional networks annually.
Of course, factors such as vehicle speed, acceleration, wind speed and direction, road topo-graphy, driving style, different climate, etc, influence each measurement point in a way which makes any correlation based on a small number of points insignificant and meaningless to try. However, if such data are collected over several months, perhaps a full year, and for a very large road network, maybe even using more than one vehicle, a multiple regression of FC on (say) MPD, megatexture and IRI may turn out to show interesting relations.
The difficulty and danger of such a study would be if there is a systematic bias in the measurements, such as a correlation between MPD or IRI and road type. For example, MPD and IRI may systematically be higher on smaller than on larger roads, in mountain areas than in flatland areas, etc. Drivers may drive slower on rougher roads than on smoother roads. Temperatures may be higher in northern parts of the country than in southern parts, which may co-vary with MPD and IRI. One may imagine several such "uncontrolled" effects which may co-vary with the road parameters. Temperature may in fact be one of the measured parameters and also be included in the multiple regressions. Therefore, one may try to separate the data into boxes, each representing a uniform road type and maybe region. Then one can in some way try to combine the results per each of these boxes into a uniform model. An alternative way is classifying road type and region into some categories and introducing them as test parameters.
The method is planned to be tested in Sweden. It is not feasible for studies on project or lower levels.
5.10 Overall evaluation and recommended method
In order to be able to recommend one or a few methods for standard measurements of the rolling resistance properties of road surfaces, the methods described above have been evaluated according to ten criteria. Table 5.2 shows the criteria as well as the estimated marks of the five methods (the one in 5.9 is not considered useful for standard measure-ments).
The drum method is a highly arguable method here, but it has been included since, in principle, it is possible to put road surfaces or replicas of road surfaces on drums.
Marks are assigned in a scale from - - - (three minus) signs to +++ (three plus) signs; where plus signs mean positive performance.
The method which comes out the best is the trailer method. The coastdown method is not far behind but especially its complexity in measurement and required manpower are penalties which gives the trailer method an advantage. Complexity is an important criterion since it is a highly influencing factor on possibilities of making errors and mistakes and thus is related to data quality and risks of collecting poor data. When using high-competence staff such risks may be minimized, but that is expensive and it will not always be done.
Note that for trailers it is unclear as to what extent they measure the suspension losses; therefore, the cell is blank with a ? for this option. Some trailers may be better than others in this respect.
Following the evaluation, with present knowledge and experience, the authors recommend using the trailer method for further studies and for first standardization.
Table 5.2: Evaluation of the methods suitable for measuring rolling resistance properties of road surfaces. See the text for information. Colour code: green = good, red = bad, yellow = neutral.
Method Drum Trailer
Coast-down Wheel torque Fuel con-sumption +++ +++ ++ + - -
Purity of rolling resistance measurement
- - ? ++ ++ ++
Including / not including suspension energy losses
- - - +++ ++ ++ ++
Easy to conduct in the field
- - +++ +++ +++ +++
Representativity of real road measurement +++ +++ ++ ++ + Resolution +++ +++ ++ ++ ++ Repeatability + + + - - - Reproducibility - - - - ++ + ++ Cost of equipment +/- + - +/- + Complexity of equipment, measurement and analysis
+++ +++ - - - -
Required time/manpower for measurement & analysis
+++ ++++++++++ +++++++++ +++++++ ++++++ +++++ +++++ ++++++++ Overall mark
6 EXISTING TRAILER EQUIPMENT
6.1 General
The previous chapter concluded that the trailer method presently is the recommended one for measuring the rolling resistance properties of road surfaces. This chapter describes the equipment that may conduct such measurements and which have demonstrated usefulness in this respect.
The three trailers presented here have in common that they use single car tyres as test tyres (two of them may use also the smallest light truck tyres) mounted in the middle of the vehicle. Other trailers are mentioned only briefly at the end of the chapter.
6.2 BASt
6.2.1 Test vehicle (trailer)
The BASt rolling resistance trailer for passenger car tyres applies a separate wheel suspen-sion for the test tyre/wheel combination (see Figures 6.1-6.3). This wheel suspensuspen-sion is mounted in the same geometric axis as the supporting tyres of the two-wheeled trailer. For applying the desired tyre load a pneumatic cylinder in combination with a nitrogen reservoir is used.
The test tyre/wheel combination is joined at point "B" and "C" with five links (three transversal and two longitudinal links in a parallelogram alignment) to the trailer chassis with a camber angle of 0°. The lower longitudinal suspension link is equipped with a force transducer for the longitudinal force. The pressure accumulator based vertical force FZ is passed via a force
transducer and a bearing towards point "C".
The BASt trailer has been used for measurements since 1994.
Figure 6.2: Principle of the test wheel suspension on the BASt trailer
Figure 6.3: The suspension of the BASt trailer.
6.2.2 The BASt measurement method
The method used is illustrated in Chapter 9.1.3 ("two point method") in [Sandberg (ed); 2011]. The different tyre loads FZ high and FZ low are obtained by a dual pressure control unit
with adjustable pressure values. Two electro-pneumatic valves supply the pressure for the tyre load cylinder.
The signal from the force transducers for the forces FX and FZ is sampled at a rate of 500 Hz
RRC is calculated from the mean values of FX and FZ at high and low load, so there is only
one single value for the whole test track length. It is assumed that the rolling resistance value does not change significantly along the test track.
Besides the two force transducers for vertical tyre load FZ and longitudinal force FX (= FLU)
the trailer is equipped with a platinum temperature sensor (Pt100) to measure the ambient air temperature either in an enclosure around the test tyre or outside of it, as well as an infrared temperature sensor to measure the tyre temperature at its shoulder. Since there is an unavoidable influence from FZ towards FX if the trailer chassis is not parallel to the road, it is
necessary to measure the position of the trailer platform with two laser displacement sensors mounted in the front and rear.
6.2.3 Calibration procedure
6.2.3.1 Introduction
Calibrations are made only in the laboratory before each measurement campaign, or when there is a change in the setup, such as change to a test tyre with different diameter. Calibrations are not made in the field as it would be too complicated and probably not needed.
Besides the rolling resistance force R measured by the force transducer K1 in the lower suspension link B-E (Figure 6.2) there are other influences on the measurement value of FX.
These may be such as bearing friction, air drag caused by wind turbulences of the tyre/wheel combination, influence on the longitudinal force caused by a suboptimal vertical position of the wheel suspension, electrical and mechanical offset or zero drift of the force transducer used. The general relation for the longitudinal force is:
O XZ B W X R F F F F F with
rolling resistance force FW air drag and wind turbulence loss
R
bearing friction FXZ influence of vertical load FZ on
longitudinal force FX (to be
determined by a “static” calibration)
FB
zero drift of force transducer
FO
Provided that there is a linear relation between tyre load (FZ) and longitudinal force (FX) for a
certain tyre/road combination, a so-called "two point measurement" (see Chapter Fel! Hittar
inte referenskälla.) is used to eliminate the additive parts of FX which are not causally
associated to the rolling resistance force R. The two points are called "high" and "low". O XZhigh B W high X R F F F F F
FXhighFXlow RFXZ (Eq.1) O low XZ B W low X F F F F F
For a very low tyre load FZ low (~100...150 N) the value of FXZ low can be neglected.
6.2.3.2 Static calibration
6.2.3.2.1 Introduction
The operating point of the trailer measurement mechanism (suspension linkage with force transducers); i.e. the position of the trailer in relation to the ground, plus the appropriate error
of the longitudinal force FXZ, and the functional correlation between longitudinal force and
difference of height, are determined by two separate measurements in a so-called "static calibration".
The position of the trailer chassis platform is determined by two laser displacement sensors (mounted at the front and at the rear of the trailer chassis) during a rolling resistance measurement and during the static calibration.
6.2.3.2.2 Operating point
The "static calibration" is also carried out by using the “two point measurement” method. For that reason the tested tyre/wheel combination is mounted on the trailer which is placed on flat and even ground of a hall. The tyre is loaded with the same nominal vertical load (FZ high)
and a reduced load (FZ low) as when operated on the road. This calibration has to be redone
for each tyre-wheel combination that has a different diameter compared to the previous one, for each change in vertical tyre load, and for each adaption of the suspension links to the current tyre size used.
S O S high XZ S high X F F F
FXhighS FXlowS FXZS (Eq.2) S O S low XZ S low X F F F with
influence on longitudinal force during “static” condition at vertical load FZ high S
FXZ low S influence on longitudinal force
during “static” conditions at vertical load FZ low S
FXZ high S
zero drift of force transducer during “static” conditions
FO S
For a very low tyre load FZ low S (~100...150 N) the value of FXZ low S can be neglected. If the
conditions during a road measurement are largely the same as during a static calibration then FXZ S can be equated with FXZ (Eq.1).
6.2.3.2.3 Functional correlation between longitudinal force and difference of height In order to determine the influence FX high = f(∂h) of the clearance of the coupling point
(between towing vehicle and trailer at a certain operating point of the trailer) to the ground the boot of the towing vehicle is loaded stepwise with weights. For each step of weight the tyre load FZ high is applied.
FX high = f([hfront - hrear]S - [hfront - hrear]C) = f(ΔhS - ΔhC) = f(∂h) (Eq.3)
with
clearance between front of trailer chassis and ground
hrear clearance between rear of trailer
chassis and ground
hfront
difference of height during static calibration
ΔhC difference of height during
determining f(∂h)
ΔhS
longitudinal force at high vertical tyre load FZ high
∂h difference between difference of
height at the static calibration and difference of height when determining the function f(∂h)
With the functional correlation between longitudinal force and difference of height, together with the calibrated operating point, it is possible to correct FX at all subsequent
measure-ments.
6.3 BRRC
6.3.1 Test vehicle (trailer)
In 2009 BRRC decided to continue research started in the early 1980’s and refurbished the original trailer. New sensors were added and calibration procedures were tweaked. Figure 6.4 shows the new trailer and its towing car.
Figure 6.4: The new BRRC trailer and its towing car.
The BRRC trailer is designed as a quarter-car with an ordinary car suspension. The suspen-sion dates from the 1980’s and was originally designed for a small car. Technological developments over the last years lead to larger tyres and heavier vehicles. As the trailer of BRRC was originally designed for tyres and cars commonly used in the 1980’s, it now encounters some limitations. Only tyres with a maximum diameter of 14 inches and a maxi-mum width of 195 mm can be mounted. A maximaxi-mum load of 2000 N is imposed in order not to force the suspension system.
In 2011 a new tyre was mounted on the trailer: Michelin Energy Saver 195/70 R14 91T (see Figure 6.5). Until then a slick tyre had been used: Michelin SB-15/63-14X (see Figure 6.5). A tyre inflation pressure of 200 kPa was used for the old tyre, while for the new test tyre a pressure of 220 kPa is used.
Figure 6.5: The new BRRC test tyre on the left (Michelin Energy Saver) and the old test tyre (Michelin SB) on the right.
The trailer presently has no enclosure that can prevent the tyre air drag from affecting the results. This means that speed influences the measured results; i.e. the measured rolling resistance is higher for higher speeds.
6.3.2 The BRRC measurement method
The measuring principle is shown in Figure 5.3. The rolling resistance force causes the wheel to incline backwards with an angle θ with respect to the frame of the trailer. The rolling resistance coefficient is defined as the ratio of the rolling resistance force and the load on the wheel and equals the tangent of θ. For small angles, θ is equal to the rolling resistance coefficient provided it is expressed in radians. A symmetric, friction-free pneumatic damper of bellows damps fluctuations of θ.
Different parameters are recorded continuously during measurement:
Inclination θ of the wheel carrier with respect to the frame of the trailer (Figure 6.6) Inclination μ of the frame of the trailer with respect to the horizontal plane (Figure 6.6) Inclination α between the trailer and the towing vehicle (Figure 6.6)
An external infrared sensor is directed at the sidewall near the shoulder of the tyre to record tyre temperature
Speed Acceleration
Figure 6.6: The BRRC rolling resistance test trailer and illustration of the three inclination angles measured.
A software tool for data acquisition has been developed in LabVIEW. During monitoring, the graphs of the different parameters are shown on the laptop screen. In this way the operator may be notified of possible errors during measurement. All data are registered in a file. Corrections are applied afterwards according to this formula:
Cr = θ + ε1 * μ + ε2 * α
where ε1 and ε2 are experimentally determined coefficients. So far, only a correction of the
inclination α0 at standstill has been applied and measurements have been performed only at
constant speed.
- Cold tyre inflation is adjusted to 220 kPa.
- The height of the trailer with respect to the towing vehicle is measured to determine α0 at
standstill.
- A calibration round is made to adjust μ0.and to eliminate the influence of differences in
the car load (e.g. by a different number of passengers).
- A test tyre warm-up procedure is carried out, consisting of driving about 15 minutes at approximately 80 km/h.
- The test section is measured three times.
- Ambient air and road surface temperature are measured.
- Corrections of the data are applied in the laboratory using an Excel sheet. - Data are corrected for tyre temperature following this formula[Descornet, 1990]:
Cr (T) = Cr (T0) * e( (T0 - T) / T1)
where T = 30 °C, T1 = 50 °C
- Average RRC and corresponding standard deviation are calculated.
6.3.3 Calibration procedure
Two angles in the trailer system influence the measured RRC (where RRC is measured as the angle θ expressed in radians); see Fig. 6.7. These are:
The longitudinal inclination μ (slope)
The angle α between the shaft of the towing vehicle and the shaft of the trailer
Small deviations in these two angles have a significant influence on θ and, therefore, the trailer setup regarding these are checked before every measurement. A deviation of only 0,1° leads to a deviation of 10 % of the RRC and a deviation of 0,1° on μ to an error of 3 %.
Figure 6.7: Angles μ and α in the BRRC rolling resistance trailer influencing the measured RRC (which is the angle θ expressed in radians).
The angle μ is checked every time the trailer is attached to the towing vehicle. This is done by measuring the angle μ while the trailer is run "full circle" around a paved area. The average value of the angle, which is denoted μ0 at calibration, must then be adjusted to be
zero. Normally this procedure is carried out at the BRRC premises in Sterrebeek, before driving to the test sites. The vehicle starts at a given point in front of the BRRC main building and the measurement of μ0 is started. The vehicle drives around the building over a distance
of about 320 m until it arrives again at the starting point where the measurement is stopped. The sensor is readjusted to show zero if the average of μ0 was found to be outside the
interval [-0.1°, +0.1°]. If a recalibration is necessary, it is checked by driving a second round. When there is a non-zero slope μ during a road measurement, it is used as a correction to the RRC value according to the equation given in 6.3.2.
As the second part of the calibration, the angle α is measured, which can be deduced from height measurements of the frame of the non-moveable part of the trailer with respect to the pavement; see Figures 6.7 and 6.8. The calibration value of α is denoted α0.
Non-moveable part of frame Moveable part of frame with load
Figure 6.8: Moveable and non-moveable parts of the BRRC rolling resistance trailer.
The towing car and trailer are, therefore, first parked “perfectly” aligned and on a “perfectly” horizontal surface, which can be checked with a manual inclinometer. The heights of the non-moveable part of the trailer frame are measured at the four corners. From the two heights at the left hand side the “left hand α0” is calculated and the “right hand α0” is calculated and
determined in an analogue way. The average of the left hand and right hand angle α0 is then
further denoted as the angle α0. Calculations are done by means of a simple Excel spread
sheet. Important is that α0 is determined with the vehicle loaded in the same way as during
the RRC measurement. If the operator is not in the vehicle during the measurements of the heights of the frame, it has to be indicated in the Excel sheet, which will take this into account for the calculation of α0.
If larger distances are driven between measurement locations, α0 is measured before RRC
measurements take place and recalculated to compensate for the loss of load of the consumed fuel.
If α during an RRC measurement is found to be different from zero it is used as a correction α to the RRC value according to the equation given in 6.3.2.
After a series of road measurements, this calibration round is repeated to verify that the angle is still inside the accepted interval around zero. If this is not the case, the road measurement is considered as incorrect and the calibration and measurement have to be redone.
6.4 TUG
6.4.1 Test vehicle (trailer)
The Technical University of Gdańsk (TUG) designed and built a test trailer for rolling resis-tance measurements of passenger car tyres in the late 1990's, but the first "production" measurements were made around 2005. The idea with this construction was taken from the original BRRC trailer from the 1980's shown in Fig. 10.1 in [Sandberg (ed), 2011], but TUG developed it further and improved the concept in several ways. Some of the constructions are patented, and it has been improved continuously during the past 10 years. The TUG trailer, called the R2 trailer, in its condition of 2010 is shown in Figure 6.9.
Figure 6.9: The tyre/road rolling resistance measurement trailer from TUG in the shape and condition of 2010.
The trailer is designed to be towed by a reasonably powerful passenger car. The construc-tion of the trailer is self-supporting (three-wheeler) which means that the trailer may be easily connected/disconnected from the towing car. The front wheels that stabilize the trailer have self-aligning properties. The hydraulic brake system of the trailer is operating on front wheels only and provides efficient braking of the trailer during transportation and tests. Trailer construction assures good stability of the trailer. Independent front suspension, based on double transverse arms was constructed as an adaptation of passenger car suspension. During tests the suspension is blocked by removable bars. Blocking of the suspension ascertains proper leveling of the trailer. The test wheel is supported by a vertical arm (4) that is an important element of the force measuring system (Figure 6.10).
The front and rear suspension are connected to the horizontal arm 1. Rotation axis 3 is placed directly in the geometrical centre of the rotation axis of the front wheels. The load is provided by arm 2 that has a common rotation axis with arm 1. The load block (6) is resting on arm 2.
Suspension element 7 carries the load from arm 2 to arm 1. The rear end of the horizontal arm 1 is connected to the vertical arm 4 which is equipped with the test wheel hub. Undesirable vibrations of the vertical arm 4 that may be induced during tests are suppressed by Foucault currents electromagnetic brake (not shown in the Figure 6.8). Inflation pressure in the test wheel is maintained by remote controlled release valve and pressure sensor.
6
5
4
1
2
3
7
Balastf = P
f/F
z Direction of travelP
fF
z
Figure 6.10: The measurement principle of the TUG R2 rolling resistance trailer.
During tests the rolling resistance force acting on the test wheel pulls (deflects) the vertical arm 4. The deflection rate is measured by the laser sensor installed on arm 1 and sending the laser beam towards arm 4. Rolling resistance coefficient is defined as a ratio of rolling resistance force Pf and vertical load FZ. The trailer is equipped with a patented
compensation device that eliminates influence of factors such as road inclination and longitudinal acceleration that otherwise very substantially would disturb the measurements. The position of arm 1 in relation to the road surface is monitored by two laser sensors. A data logger (DaqBook/200) which is installed in the car receives signals form three laser sensors and two rotation sensors installed in the wheels. All measurements are controlled via a notebook computer (see Figure 6.11).
The test wheel and the vertical arm, as well as the inclination compensation system are covered by a protecting enclosure (Figure 6.9). Both theoretical considerations and practical experience show that such an enclosure is necessary to reduce the influence of the air drag on the test results.
During measurements the front suspension system is blocked by special bars to ascertain stable position of the trailer frame in relation to the plane of the road. Steel loads that load the test wheel are mounted on the arm (2 in Figure 6.10) that has its own suspension based on a motorcycle spring and damper unit. This suspension unit is in operation both during transportation and testing.