A N A L Y S I S OF T H E E F F E C T S OF R O C K P R O P E R T I E S
A N D S Y S T E M P A R A M E T E R S ON T H E P E R F O R M A N C E
OF T W O T Y P E S OF R O T A R Y D R A G B I T S
BY
INFORMATION TO ALL USERS
The qu ality of this repro d u ctio n is d e p e n d e n t upon the q u ality of the copy subm itted. In the unlikely e v e n t that the a u th o r did not send a c o m p le te m anuscript and there are missing pages, these will be note d . Also, if m aterial had to be rem oved,
a n o te will in d ica te the deletion.
uest
ProQuest 10781983Published by ProQuest LLC(2018). C op yrig ht of the Dissertation is held by the Author.
All rights reserved.
This work is protected against unauthorized copying under Title 17, United States C o d e M icroform Edition © ProQuest LLC.
ProQuest LLC.
789 East Eisenhower Parkway P.O. Box 1346
A Thesis submitted to the Faculty and the Board of Trustees of the Colorado School of Mines in partial
ful-\
fillment of the requirements for the degree of Master of Science. Golden, Colorado Date; \7 , 19 7S" Golden, Colorado Date: '9r)*.*r
7,
19?r
— iiABSTRACT
The primary purpose of this investigation was a parame tric study of scaled 3/4-inch rotary drag bits.
The system parameters affecting rotary drilling perform ance (thrust, rpm, flushing agents and rates of flushing) were varied and evaluations made of their effects on pene tration rates. Thrust and rpm were found to have an approxi
mate linear relation to penetration rates. Air and water
flushings were found to have a very critical effect at low quantities but little effect when large amounts were used.
The drilling was performed in seven different rock
types. The effects of rock properties on penetration rates
were evaluated. Four rock engineering properties; compres
sive strength, Young1s modules, Shore hardness, and Schmidt
hammer values were determined for each rock type. All physi
cal properties except Schmidt hammer values were found to have good correlation to penetration rates.
Wear rates for the 6%- and 10%-cobalt alloy carbide rotary drag bits were determined by three techniques; weight loss, penetration rate loss, and cutting edge pro
file loss, to determine the reliability of each. Penetra tion rate loss was found to be the most informative of the three.
A preliminary study of the performance of a new dia-iii
mond composite insert was also performed. It was found that this bit is far superior to carbide bits in wear resistance. A slight decrease in drilling rates for the cutting edge geometry evaluated, was measured.
TABLE OF CONTENTS
\
Title Page
ACKNOWLEDGEMENTS ... X
I INTRODUCTION ... 1
II DISCUSSION OF THE PROBLEM ... 3
A. Statement of the P r o b l e m ... 3
B. Scope of S t u d y ... 4
C. Rock Failure Due to Rotary Drag Bits . . . 5
1. Static Failure ... 6 2. Dynamic F a i l u r e ... 13 D. Literature R e v i e w ... 15 1. System Parameters . 15 2. Rock P r o p e r t i e s ... 20 3. Wear Rate M e a s u r e m e n t s ... 22 4. Bit Insertion C o m p o s i t i o n ...24
III TESTING PROCEDURES AND TEST EQUIPMENT ... 28
A. Drill B i t s ...28
1. Cutting E d g e s ... 31
B. Drilling Machine and Controls ... 34
C. Physical Property Tests ... 39
D. Wear Rate M e a s u r e m e n t s ... 43
E. Drilling Procedures ... 45
IV DATA COMPILATION AND R E S U L T S ... 46
A. Effects of System Parameters on Penetration Rates ... 46
Title Page 1. The Effect of Thrust on Penetration
. R a t e s ... 46
2. Effects of RPM on Penetration Rates . . . . 50
3. The Effect of Flushing Agents and Quantity on Penetration Rates ... 51
B. Effects of Rock Properties on Penetration Rates ... 55
1. Uniaxial Compressive Strength ... 56
2. Young's M o d u l u s ... 58
3. Shore Scleroscope Hardness ... 60
4. Schmidt Hammer Values ... 60
C. Wear Rate Measurements with an Evaluation of Carbide Grades ... 64
1. Penetration Rate Changes ... 65
2. Bit Weight L o s s ... 65
3. Area Profile Change ...68
4. Wear Composition of 6% and 10% Cobalt Carbide ... . . . 71
D. Evaluation of the Diamond COMP AX B i t ...72
V CONCLUSIONS . ... 87
VI R E C O M M E N D A T I O N S ... 89
APPENDIX A Computer Programs for Handling Data and Stress-Strain Plots ... 91
B Petrographic Description ar.d Photographs for Rock Types D r i l l e d ... 106
C Tabulated Data for Drilling Resultjs... H 6
..r1
D ~Stress-Strain Plots for the Seven Rock
Types D r i l l e d ...1 6 9
Title Page B I B L I O G R A P H Y ... 2 35 \ LIST OF FIGURES Figure Page 1 Drag Bit N o m e n c l a t u r e ... 5
2 Chip Development in Drag Bit Drilling . . . . 7
3 Basic Thrust/Penetration Rate Curve for
Rotary Drilling ... 17
4 The Effects of Rotation Speed on
Penetration R a t e ...18
5 Progressive Bit Wear Using Carbides of
Variable Hardness ... 25
6 The Effect of Cobalt Content on Hardness
and Strength in Carbide Inserts . . 27
7 Geometry of the Cobalt Carbide Bits ...29
8 Geometry of Diamond COMPAX Cutting Edge . . . . 30
9 Thrust vs Penetration Rate in Limestone . . . . 47
10 Thrust vs Penetration Rate in M a r b l e ... 48
11 Penetration per Revolution versus Thrust . . . . 49
12 RPM vs Penetration Rate for Limestone
and M a r b l e ... 50
13 Penetration per Revolution vs R P M ... 51
14 Drilling Study with Water as Flushing Agent . . 52
15 Drilling Study with Air as Flushing Agent . . . 53
16 Penetration Rates vs Uniaxial Compressive
Strength ... 57
Figure Page
17 Penetration Rate vs Young's M o d u l u s ... 59
18 Shore Hardness vs Penetration R a t e ...61
19 Schmidt Hammer Values vs Penetration Rates . . 62
20 Distance Drilled vs Penetration Rate ... 66
21 Distance Drilled vs Penetration Rate ... 67
22 Distance Drilled vs Weight L o s s ... 69
23 Distance Drilled vs Area Profile L o s s ... 70
24 Cutting Edge of the COMPAX B i t s ... . . 73
LIST OF TABLES 1 Variation of Hardness of Tungsten Carbide/Cobalt Alloy with Temperature ... 26
2 Penetration Rate Decrease and Quartz Content of R o c k s ... 68
3 Engineering Rock Properties of Rock Types T e s t e d ... 75
4 Penetrations Data for Different Rock Types and Carbide G r a d e s ... 78
5 Thrust Study with Air and Water Flushing . . . . 80
6 RPM Study with Air Flushing Agent . . . . . . 81
7 Drilling Study with Air as Flushing Agent . . . 82
8 Drilling Study with Water as Flushing Agent . . 83
9 Penetration Data for 180° and 360° COMPAX Bits in M a r b l e ... 84
10 Penetration Data for 180° and 360° COMPAX Bits in Limestone and G r a n i t e ...85
Table Page 11 Rotary Dr i n a b i l i t y Index for Carbide Bits . . . 8 6
12 Computer Listing of Strain Program ... 92
13 Computer Listing of SS Program ... 95
14 Sample Data Format for Data Input to SS Program 9 7 15 Computer Listing of Data Conversion Program . . 98
16 Computer Listing of Plot P r o g r a m ... 100
17 Computer Listing of Sample Data File for the Plot P r o g r a m ... 104
LIST OF PHOTOGRAPHS Photograph Page 1 3/4-inch Rotary Drag B i t s ... 32
2 3/4-inch Rotary Drag B i t s ... 32
3 Drill and Controls ... 34
4 Drill and Cage A s s e m b l y ... 35
5 Rock Samples Taken to F a i l u r e ... 42
6 Type of Sample Failure for M a r b l e ... 42
7 Photomicrograph of the S a n d s t o n e ... 107
8 Photomicrograph of the Limestone ... 109
9 Photomicrograph of the T r o n a ... 110
10 Photomicrograph of the Fremont Dolomite . . . . Ill 11 Photomicrograph of the Manitou Dolomite . . . . 113
12 Photomicrograph of the Oil S h a l e ... 114
13 Photomicrograph of the Yule M a r b l e ... 115 ix
ACKNOWLEDGEMENTS
The author wishes to express his sincere appreciation to Carboloy Systems Department for their financial support
and drilling materials. Special thanks go to Arnold Bower
and his staff for information and assistance.
Thanks are extended to my thesis committee, Dr. Donald W. Gentry, Dr. Thys B. Johnson, and Dr. John F. Abel, Jr. for their guidance and support during the entirety of this work.
The author would also like to thank Thomas Clark for his help with the computer programming, Ricardo Rodriguez for helping take data, and Joey Tucker for photographs.
Doctor Joseph J. Finney and Dr. Samuel E. Romberger of the Geology Department of the Colorado School of Mines receive appreciation for their petrographic work on the rock samples tested.
I . INTRODUCTION
\
Considerable attention has been devoted to improving
drilling performances and efficiencies. The successful per
formance and economy of a drilling operation depend on many
factors. Factors that influence the drilling process can be
grouped into three basic areas:
1) Operating parameters ARTHUR LAKES LIBRARY
COLORADO SCHOOL of MINES
2) Rock properties GOLDEN, COLORADO 80401
3) Bit design
The operating parameters are usually the first to be related to the drilling process and can be easily controlled.
Included in the operating parameters are: thrust, rpm, flush
ing, and torque.
Of all the factors affecting drilling, the most diffi cult to model or control are the physical properties of the rock being drilled. Factors in this group are numerous and include such properties as density, fractures, porosity, com pressive strength, mineral composition and grain size.
The last group of parameters associated with the drill ing process involve bit design. Included in bit design are composition and geometry of the drill bit cutting edge.
Operating parameters of the drilling operation and the
physical properties of the rock being drilled determine bit type and design. The strength and abrasiveness of the rock
feet the composition and strength of the cutting edge. Bit geometry must also produce the best possible cutting action
N
and yet withstand the operational parameters.
All three groups of factors affecting the drilling pro cess must be combined to produce the best possible drilling
performance. These factors apply to all forms of mechanical
rock drilling.
Measurements of important drilling parameters during underground tests have proven unfeasible due to variability in drilling conditions, harsh working environment, accessi bility to the work area, inadequacy of required measuring
equipment, lack of equipment control, etc. These problems
are well known to those who have attempted comprehensive underground evaluations of drilling tools and/or equipment. Consequently, a precisely controlled laboratory drilling test program involving characteristics similar to those in the underground environment should provide information to evaluate and improve drilling performance.
The drilling system parameters and their effect on rotary drag bit drilling performance were studied in this
investigation using 3/4-inch drag bits. Conclusions
drawn based on these tests will aid in understanding
the drilling process and lead to improved rotary drilling techniques.
II. DISCUSSION OF THE PROBLEM
A. STATEMENT OF THE PROBLEM
The primary purpose of this study was to examine rotary
(drag bit) drilling using scaled 3/4-inch bits. Specific
objectives to the investigation were as follows:
1) To study the effects of drilling-system parameters
on penetration rates. The parameters of thrust, rpm,
flushing agents, and the quantities of flushing were varied and the effects analyzed.
2) To study the influence of rock engineering proper
ties on penetration rates. Specific physical tests
were performed on seven rock types and correlated with drilling rates.
3) To test different wear-rate measuring techniques
and to evaluate the effectiveness of each. Three
techniques were studied: change in penetration rates;
bit weight loss; and change in cutting edge profile area. 4) To test and compare two different grades of cemented
tungsten carbide inserts, one containing 1 0% cobalt
and the other 6% cobalt by weight.
5) To test 180° and 360° COMPAX diamond bits developed by Carboloy System Department, a division of General Elec
tric. These bits were compared with conventional car
bide bits having similar cutting edges of 6% and 1 0% cobalt by weight.
B, SCOPE OF STUDY
x
In order to study the effects of drilling-system para meters on penetration rates, each parameter was varied over a wide range of values while keeping all other parameters constant. Axial thrust loads were tested at levels rang
ing from zero to 1500 lbs in Yule Marble and Leadville Lime
stone using both water and air as flushing agents. Rota
tion and thrust were maintained at 500 rpm and 500 lbs re spectively.
To test the effects of flushing rates on penetration, flow rates were varied from zero to 4 gpm for water and from
zero to 9 cfm for air. Penetration rates were measured with
constant 500 lbs thrust and 500 rpm. These tests were con ducted in Yule Marble using one bit with a 10% cobalt car bide insert.
Four engineering physical properties, Schmidt impact hammer, Shore scleroscope hardness, uniaxial compressive strength, and Young's modulus, were measured on each of the
seven rock types tested. Each rock type was subsequently
drilled at 500 lbs thrust, 500 rpm, and with 4 cfm air
flushing and penetration rates determined. From this the
effects of physical properties on rotary drilling were evaluated.
To study wear measuring techniques, all rock types were drilled at 500 lbs thrust and 500 rpm with both 6% and 10%
cobalt carbine inserts. Ten, 4-inch deep holes were drilled in each rock type, and penetration times were taken over the final three inches of each hole. Weights and profiles were obtained for each bit, before drilling, after three holes, after 5 holes, and at the end of 10 holes.
Two types of diamond-composite bit inserts were tested
in Yule Marble and Leadville Limestone, Eleven 180° and
seven 360° COMPAX bits were used and only visible inspec tion of wear was made.
C. ROCK FAILURE DUE TO ROTARY DRAG BITS
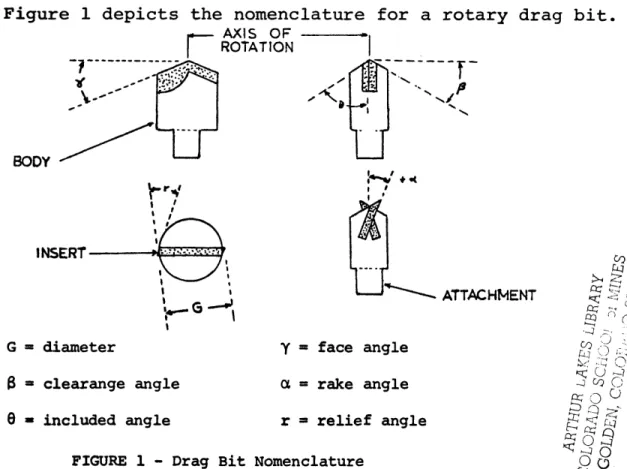
Figure 1 depicts the nomenclature for a rotary drag bit
AXIS O F ROTATION BODY INSERT G = diameter 3 * clearange angle 6 * included angle ATTACHMENT Y = face angle a = rake angle r ■ relief angle FIGURE 1 - Drag Bit Nomenclature
co N O oa ; f ^ ° cq to r, SS ■-4 :: CO Cq O -z Q O -j co O K O ° ^ 5 S o 3 rt O 8 °
Although the nomenclature may vary between different indus tries and manufacturers, that illustrated in Fig. 1 is gener
is ally accepted.
1. Static Failure
Rotary drilling results in three basic types of rock
failure: shearing, tensile fracture, and crushing. When
presented as models at the cutting edge during the drilling process, they present an explanation to some of the observed
phenomena in rotary drilling. Data and observations made by
authors in the past offer support for these theories. Each
model can only represent an idealized condition or a speci fic observation, not the complete actual rock failure pro
cess. With these observations, however, the models can be
used to draw conclusions regarding the rotary drilling pro cess.
The first model chosen to represent the physical situ ation encountered by a drag bit cutting edge is shown sche
matically in Fig. 2a. The direction of movement of the bit
blade is from left to right and the thrust is vertical. It is assumed that the clearance angle is such that frictional drag or crushing under the bit can be neglected and a rake angle of zero degrees is used. As the blade advances, stress builds up in the rock ahead of the bit until a chip develops, relieving the bit's strain energy. The chip is indicated by
Torque
\r Thrust
Clear ancet Shear plane
Figure 2a Tensile fracture Figure 2b Crushed zone ^ ; W / 7 ^ J i / ^ J J 5 s I / / ^ | | Figure 2c
the dotted line in Fig. 2a, where 0 is the angle the shear plane makes with the surface. Two factors control the size
\
and shape of the chip formed. One is the depth of penetra tion (d), which must be large enough so the front surface of the bit can build up stress. Chip size increases with increases in (d) and results in lower specific energy for the rock removed. The specific energy is a measure of cutting e f f i c i e n c i e s a n d is defined as the work done in
excavating a unit volume or mass of rock. The other in
fluencing factor on chip size is the angle (0) which change the area of the plane of failure. The angle 0 is a charac teristic of the rock type and depends on the coefficient of internal friction of the rock.
Assuming the chip was formed by pure shear and the Coulomb-Navier theory of failure applied, the angle 0 and the forces involved can be resolved. In this theory, the stress needed to rupture the rock must be great enough to overcome the shear stress (t) and the internal friction forces (ycr) at the plane of failure, therefore,
stress = t + ya
Where:
t = shear stress,
y = coefficient of internal friction and o = normal stress on shear plane.
If the principle stress is parallel to the surface, then the angle 0 will be (tan ^ l/y)/2, and the force present
at failure is F = iI§-? (t + yo)X, where X is the width of
the cut. This assumes X is large in comparison to d and side forces^can be neglected.
The second type of rock failure found in drag bit drill ing, tensile fracturing, occurs mainly in medium hard to soft rock drilling with bits that have large rake angfelfs. In coal mechanics, tensile fracturing is more commonly called coal
ploughing or cutting. In the drilling process, the tensile
strength of the rock is overcome and the bit acts as a pick and splits the chip out, as in Fig. 2b. Only a small surface of the bit is in contact with the rock surface during failure. The failure surface is not planar, as was found with shearing, but instead is curvilinear. A crack develops ahead of the tip and runs out and up to the rock surface, relieving the strain.
Fig. 2b is the idealized tensile fracturing suggested by Evans (1962) for coal cutting. In Evan's theory, it is assumed that the arc of failure is circular and tangential to the wedged tip. From this, he found the force on the wedge in the direction of cutting and at the instant of
failure to be:
F = 2 t wd s i n ^ s (tt/ 2 - a)
1 - sinJ$ (tt/2 - a) Where:
t = tensile strength of rock, w = width of wedge,
a = wedge rake angle.
This equation is the simplified outcome of detailed analyses that assumed the distance of penetration by the tip is small compared to the depth of the cut, d.
Roxborough (1973) showed that Evans' theory on the basic mechanics of Coal cutting was equally relevant to the cutting
of three quite distinctive sedimentary rocks: anhydrite,
limestone, and sandstone. In fact, Roxborough's results were
much closer to Evans' theory than the work done in coal. Since rock is relatively weak in tension, the specific energy of the cutting is relatively low. Over a limited range, the forces required for failure are independent of the cut depth. The specific energy can be generalized as being inversely proportional to the cut depth, d. In deep
cuts, the side effects or "breakout" must also be considered. Roxborough hypothesized that the specific energy would then be:
_ F c '
” wd + d2 tan 0
Whe r e :
Fc' = mean peak cutting force for deep cuts effected by breakout,
0 = breakout angle, w = width of wedge, and d = depth of cut.
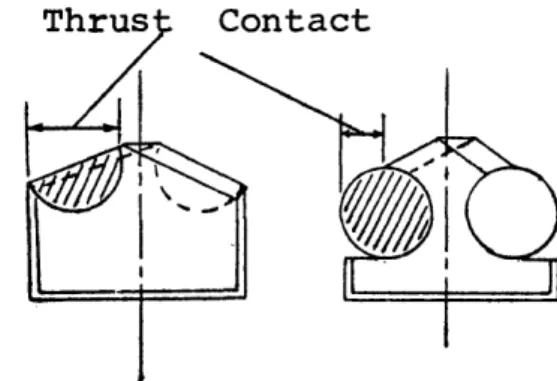
The third physical process observed in' rotary drilling, crushing, occurs in front of the bit where too small a
sur-face area is in contact with the rock. The forces involved are too large for the loaded area of rock and the
compres-\
sive strength of the rock is overcome. Crushing takes place on the underside of the rounded tip, (see Fig. 2c) and be neath the bottom surface of the bit. Most of the bottom bit surface bears the thrust load, with resulting rock
crushing and subsequent wear on this portion of the bit. In soft rock a sharp tip can be maintained and very little crush
ing takes place. In harder formations, blunting of the tip
develops rapidly and increases the amount of crushing. Dull ing is accelerated and larger thrust loads are required to maintain a specific penetration.
Early work (Evans (1962), Fish (1965), Goodrich (1956), Gray and Gatlin (1961)) on drag bit rock failure explained the cutting action by one of the above processes. Recent work shows that all three failure mechanisms are present with the degree of each dependent on the rock being drilled
and the individual bit design. Present literature agrees almost totally on a cyclic cutting process with the type of rock failure changing over the period of the cycle.
Fairhurst (1954) and later, Fairhurst and Lacabanne (1957), employed photographic techniques to show that the drilling of brittle rock by a drag bit is a cyclic process where instantaneous loads on the bit varied from some maxi mum to almost zero.
ject and again postulated the failure mechanism as periodic
with alternate chipping and crushing. According to Goodrich,
the volume 'removed by the grinding and chipping phases were roughly equal.
High speed photographic work by Gray and Gatlin (1961) also shows that the cutting action was cyclic and the major ity of the rock was removed by chips formed by tensile frac
turing. They noted that the direction of the separation
crack was curved, beginning very nearly horizontal and curv ing toward the upper free face. This sort of chip formation was typical and failure was not observed to occur along a
straight shear plane. Movies and visual inspection of the
cuttings indicated that the volume of rock removed by chip ping was much lc^rger than that by grinding mechanisms, even
for tips having negative rake angles. Gray and Gatlin's work
was not done at high speeds, where time dependent factors and dynamic properties are pronounced.
Fish (1961), with high-speed cutting, found the reverse to be true in that the chip shapes suggested shear planing as
the means by which the chips were generated. Fish used a
cyclic model, showing when the larger fragments failed, the elastic strain energy built up in the bit was released and impacted tne flat cutting edge of the new rock surface, caus
ing comminuation. Under the high stress concentration, the
rock is further crushed until the face of the cutting edge is effectively bearing on a step of unbroken rock, which
subsequently fails in shear, creating a larger fragment and starting the cycle over.
\
From work done in the past, it appears that the type of rock being drilled is the biggest factor controlling the type of rock failure at low cutting speeds, The softer rocks be ing cut by the advancing edge and hard brittle rocks being subject to increasing stress until sudden shear failure pro duces a rock chip. The high stress developed also causes crushing to take place in the harder formations.
2. Dynamic Failure
Static models can be used to understand the basics in rock failure, but they do not fully represent the actual rock
cutting process in field drilling. In field drilling, very
high rotational speeds are used to obtain increased drilling rates. Work in this area is very sparse and conclusions drawn come from a few multispeed cutting observations, most of which were not correlated to dynamic failure.
Rocks can resist a high magnitude of dynamic stress than static stress. Because of this, failure based on dynamic
stress in drag bit drilling must be carefully evaluated. The
reason for the larger increase in strength under dynamic load ing conditions lies in the transient nature of the stress pulse ahead of the bit and the localized area of immediate action. This means that failure mechanisms which are time-dependent
are incapable of completion during the stress pulse. In a perfectly elastic material, induced strain is instantaneous; however, rock is by no means elastic. At high drilling rates, plastic rock response may well be obscured and dynamic failure
predominates. In a rock where strain is induced by interatom
ic movement and movement along grain boundaries, deformation
is time-dependent causing strain to lag behind stress. The
process of fracture development through rock is also definite
ly time-dependent. Failure by tensile fracturing in high
speed drilling may not occur due to time-dependent crack pro
pagation. Therefore, failure by shear should be more promin
ent in high speed drilling.
Gray and Gatlin (1961) found that the size of cuttings decreased as rotation speed increased, indicating that large chips formed by tensile fracturing do not have time to develop. The abundance of fine particles suggests that the rock in con tact with the bit was locally crushed before the stress was relieved by the rupture of the overlying chip. Most investi gations have found that the maximum cutting force is smaller at higher speeds. This possibly suggests that stresses do not have time to build up and impact momentum adds to the
failing forces.
Experiments in coal (Evans, 1962) have shown that the principle cutting forces are unaffected by cutting speeds, which suggests that there are smaller dynamic effects in volved in coal cutting. The coal fails almost totally by
cutting action and no time-dependent factors are involved. However, the coal cutting speeds used by Evans were much lower
than those 'used in hard rock drilling. They may possibly be
the reason for the lack of any evidence of dynamic effects. No single process can adequately explain the drilling action in rotary drag bits, for the interactions of these cut ting processes lead to rock failure. The degree to which these processes are present during drilling is quite varied and de pends on the bit, the rock being drilled, the drilling system and the stage of the cutting cycle.
D. LITERATURE STUDY
An extensive literature study was conducted to obtain the best possible understanding of the rotary drilling pro cess, with respect to system parameters, effects of rock properties, and bit wear.
1. System Parameters
Thrust. When reviewing drilling studies the most ob
vious parameter affecting penetration rate is thrust. Thrust
has been accepted by most authors as being one of the most
important variables in any drilling process. In rotary
cutting action. Many investigators have presented thrust vs.
penetration rate data. Most investigators (Fish, 1961; Whe-
lan, 1962? Rose and Utter, 1955; and Kimoshita, 1956), work ing in a variety of rock types, show that penetration rates increase linearly with an increase in thrust.
Whelan (1962) and Rose and Utter (1955) showed that in creases in thrust increase drilling rates and depth of pene tration per bit revolution, provided all other conditions are
constant. They noted that at lower thrusts, the penetration
curve did not stay constant but flattened out. This, Whelan
claims, is due to the change in the mode of rock failure. At these lower thrusts grinding is predominant and the cutting action is lost. Rose and Utter, working at full scale, pro pose that this slope change is due to bit wear and friction between the drill rod and the walls of the drill hole with increased depths.
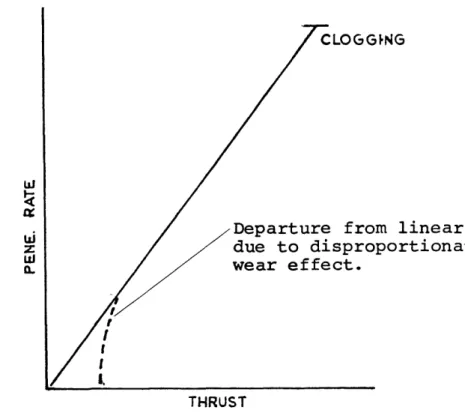
Fish (1961) also showed the relation of penetration rates to thrust to be linear for large thrusts but that the curve steepens at lower thrusts. Figure 3 illustrates his basic thrust/penetration rate curve.
Of particular interest is the marked departure of the data from a linear relationship at lower thrust levels.
Fish explains this to be the result of bit wear. As wear
occurs the thrust required to maintain a given penetration
rate increases. At lower penetration rates, wear increases
due to the greater number of total revolutions over a given
ARTHUR LAKES LIBRARY
o ^? S ADOSCil 1 amines
Hi S DC
Departure from linear due to disproportionate wear effect. UJ z UJ 0. THRUST
Figure 3 - Basic thrust/penetration rate curve for rotary drilling
drilling depth at constant rpm.
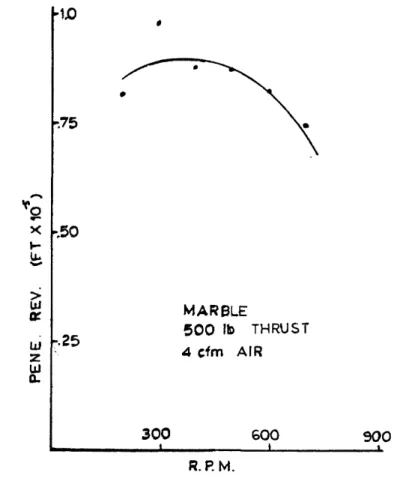
RPM. Rotation speed has been found to have a marked and consistant effect not only on the drilling forces, but also on the cutting process.
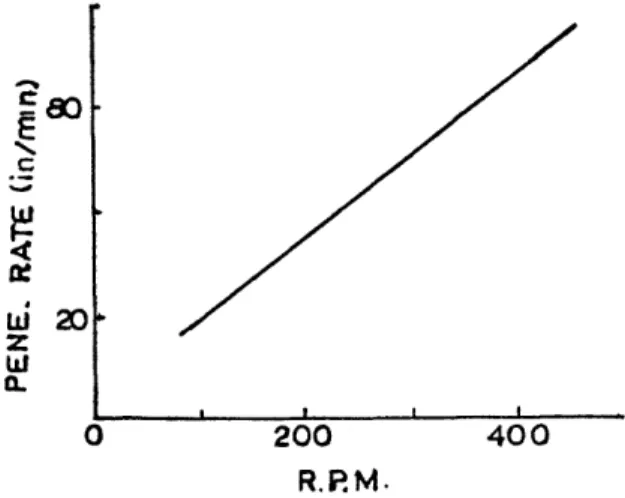
Fish (1961) states that for a given thrust there is a continuous increase in penetration rate with increase in ro tational speed. Over the range examined, he found the rela
tionship to be approximately linear (see Figure 4). This
relationship, he claims, follows logically from the reduc tion in penetration per revolution with increased rotation speed and the consequent proportional reduction in thrust
the frictional forces because of the associated reduction in thrust. But in cutting edge wear this is more than offset by
\
the increased distance traversed for high rotation rates over a given drilling distance. Fish also states that the lower
hi 2 0
4 0 0
0 200
R.RM.
Figure 4 - The effect of rotation speed on penetration rate
the rotational speed the greater the penetration per revolu tion due to larger fragments created in fracture and greater subsequent impact at the cutting edge. These findings have been confirmed by rotary drilling .studied of Whelan (1962) and Rose and Utter (1955).
Kim (1964), working at very low thrusts in slate, found that rotational speeds have a much smaller effect on penetra tion rates. In fact, at low clearange angles (5°) (see Fig.
1) the increase in rotation speed caused a decrease in pene
tration rate. At higher clearance angles only slightly higher
penetration rates were found for greater rotational speeds. This relationship does not correspond with other studies
found in the literature and may be due to extremely different conditions. Kim's tests were performed at 4 and 5 lbs of thrust where others have worked with thrusts ranging some where between 300 and 1500 lbs. At very low thrust the cutting action is different resulting in differences in thrust vs. penetration curves. #
Roxborough (1973) performed cutting studies with picks in coal and found strong evidence that the principle cutting
parameters are unaffected by cutting speeds. This work was
done with a shaping machine making the cutting process lin ear, not circular, as was the case in the other studies.
Flushing Agents. Several studies have been reported
comparing water and air as flushing agents (Fish, 1961 and
Kim, 1964). Most studies have concentrated on the manner
in which flushing agents affect drilling rates, bit tempera ture and bit wear.
Kim (1969) states that bit temperature increases with decreases in flushing rate and that the temperature gradi ent is highest at the cutting edge, which is most critically affected. The higher the temperature the weaker the carbide becomes, causing increased wear and lower penetration rates. He also found that air flushing may be more advantageous than water flushing because of its faster cleaning action even though water is far better for lowering bit tempera tures.
stone found that dry drilling requires lower forces than wet drilling and produces higher penetration rates for a given
\
thrust. He also states that there is no significant differ ence in bit wear with the two flushing agents, despite the fact that high temperatures were found with dry drilling. From this he suggests that the rate of wear from abrasion
swamps the surface temperature effects.
2. Rock Properties
In rotary drilling, the physical rock properties are of
utmost importance. These properties can be grouped into
three categories:
1) The strength properties, which determine the force
required during the drilling process;
2) The abrasive properties, that influence bit wear
rates and insert composition and;
3) The structural properties, such as fractures, bed ding, porosity, alteration, etc.
The first extensive research on drillability based on correlation of measurements of physical properties of rock was reported by Sheperd (1950). He concluded that Shore
scleroscope readings, unless correctly analyzed, give no useful guide to rock drillability, and toughness of rock is a property important in percussive drilling, but not necessarily so in rotary drilling.
Correlation of physical and mechanical properties of 15 rocks types with drilling rates was investigated by Kimoshita
\
(1956) . His report shows that some relationship exists be tween penetration rates and the number and size of quartz
grains in the rock. Shore hardness correlated with penetra
tion but the data showed large deviations. From his experi
ments he concluded that rock properties are, by themselves, insufficient to act as a measure of drillability.
Paone and Bruce (1963) have done a series of drilling
studies with AX-size diamond coring bits. The main object
tive of the investigation being to determine correlations between penetration rates and physical rock properties.
The properties included in the study were compressive strength, tensile strength, Young*s modulus, shear modulus, Shore schlero-
scope hardness and specific gravity. They concluded that pene
tration of a diamond coring bit is directly related to the strength of the rock which, as first approximation, approaches the compressive strength of the rock.
Paone, Bruce and Virciglio (1966) used regression analysis to study the effects of rock properties on penetration rates in
diamond coring bits. This work involved laboratory drilling
and also field drilling. They determined that the parameters
affecting penetration rates for surface-set diamond bits were compressive strength, Shore hardness and quartz content of the
rock. With impregnated diamond bits, the significant para
and compressive strength. All the physical properties used in the study were found to be highly correlated with each
\
other.
In his work on correlation of physical properties with penetration, Alpan (1950) measured crushing strength, Shore hardness, toughness, and resistance to abrasion. Each had a similar effect on penetration rates and any one of the
properties could represent drillability. He found, as did
Paone and Bruce, that all rock properties had an inverse relation with rotary drilling penetration rates.
White (1969) using regression techniques, found Shore hardness, compressive strength and thrust to correlate to
rotary drillability. Schmidt hammer and Young's modulus
were also measured with little correlation to drilling rates.
3. Wear Rate Measurements
A number of techniques have been employed in past drill ing studies to measure wear rates of rotary bits. None of these techniques have proven to be superior or received wide acceptance.
White (1969), working with 3/4-inch drag bits, employed a microprojector to obtain profiles of the cutting edge. Bit profiles were traced and a planimeter used to measure the area. After drilling the loss of profile area was calculated and
an abrasive index that represented the wear per foot of hole drilled.
\
Montgomery (1969) also used the profile technique for wear measurements on carbide buttons in percussive bits.
He found this technique quite successful because the buttons wore down symmetrically, whereas with White's rotary bits, wear was different in all dimensions.
Using a micrometer screw gauges, Fish (1961) measured bit wear by the average width of the wear flat developed on the cutting edge. He found that at low bit temperatures
wear was largely due to fractional forces. Wear was found
to be a function of unit thrust on the cutting edge and the
distance drilled. At elevated temperatures wear was greatly
increase due to the weakening effects of high temperatures on the carbide.
Fairhurst and Lacabanne (1957) and later Kim (1964) employed a microscope to measure the average width of the
cutting edge wear flat for wear measurements. Kim also used
bit weight loss to study wear conditions. He found that the width of the wear flat is a less sensitive measure of total
wear than weight loss. The flat measurement does not show
loss of gauge and is influenced by the clearange angle of the bit. During the same study, Kim made penetration rate measurements to show wear rates and their effect on penetra
tion rates. From his investigation, he concluded that in
rapid in initial drilling but decrease in later phases. He also found that there is an increase in wear rates with in
's
creasing thrusts. Bit wear by weight loss was found to vary
directly with bit clearance angle but wear measured by the width of wear flat varied inversely with clearance angles. He stated that high bit temperature from decreased flushing rates caused increased bit wear and decreased penetration rates.
Whelan (1962) used wear flat measurements and penetra
tion rates for evaluating wear rates in limestone. He found
that initial penetration rates of a new bit decreased rapid ly because of wear. After a few inches of drilling the pene tration rate became essentially constant with additional drilling.
4. Bit Insertion Composition
Rotary drilling may be described as a continuous con test between the cutting edge of the bit and the rock being drilled. The usefullness of the cutting edge depends on its ability to stand up to all possible drilling conditions. It must withstand large thrust loads, abrasive wear and possi
bly high temperatures. Tungsten carbide alloys have been
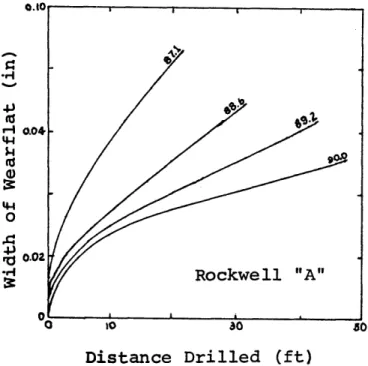
shown to be one of the best materials for cutting edges. The effects of hardness of tungsten carbide cutting edges on the rates of wear are clearly illustrated by Fish
(1961) in Figure 5. The graph shows the wear vs. distance curve for a range of different carbide hardness from 87.1
x
to 90.0 Rockwell "A". It can be seen that it would be de
sirable to use the hardest possible carbide bit edges. How
ever, the harder the carbide the more brittle it is and the most likely to fracture under rotational impact. Fish states that it would be best not to use carbide with a hardness
greater than 89.3 Rockwell "A".
o.to •H rQ 0.02 •r| Rockwell "A ao *o Distance Drilled (ft)
Figure 5 - Progressive bit wear using carbides of variable hardness
Bit temperatures can greatly affect carbide hardness.
The softening effect of high temperatures on carbide alloys is
found that in dry drilling temperatures in excess of 400°C were reached and would explain the increased bit wear
com-N
pared with wet drilling.
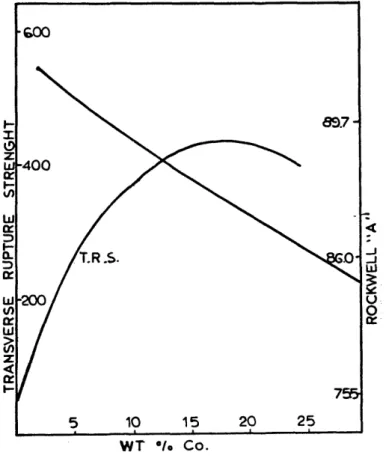
Wear of cemented tungsten carbide inserts is an extremely
sensitive function of its cobalt content and hardness. Figure
6 (by Roxborough) shows the effects of cobalt content on hard
ness and transverse rupture strength. Harder carbides can be
obtained with lower cobalt content but are very brittle and more likely to fracture under rotational impact forces. The best wear results are found for carbides with approximately
6% Co content by weight. With higher cobalt content and
larger grain size, cracking is reduced but with an accompany ing loss in hardness.
TABLE I
Variation of Hardness of Tungsten Carbide/Cobalt Alloy with Temperature
(after Fish, 1961)
Temperature (°C) Vickers Rockwell "A"
20 1,270 88.2 100 1,270 88.2 200 1,200 87.3 320 1,100 86.7 430 800 83.7 550 620 79.1 650 500 75.5 750 420 72.0
■600 -400 T.R .S. -200 u c r 756 2 5 20 15 W T °/o Co.
Fig. 6 - The effect of cobalt content bn hardness and strength in carbide inserts
ARTHUR LAKES LIBRARY COLORADO SCHOOL of MINES
III. TESTING PROCEDURES AND TEST EQUIPMENT
A. DRILL BITS
The 3/4-inch bit diameter was chosen on the basis of
earlier work by White (1969). White's test work was used
as the basis for the test program, drilling method and to
establish starting parameters. The bit bodies were machined
from bar stock and heat treated prior to brazing the cutting
edges to them. Brazing was accomplished with a commercial
silver brazing alloy. Parts were heated by a laboratory
induction unit. The basic carbide tipped test tool is
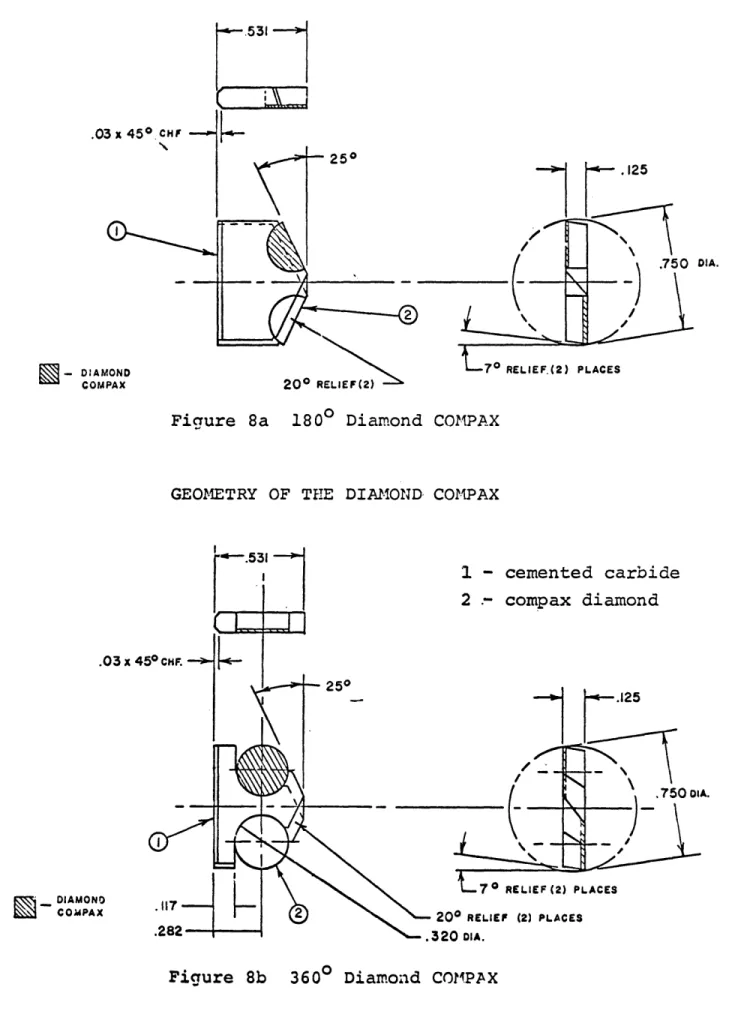
shown in Figure 7. Two geometries with carbide plus dia
mond cutting edge are shown in Figure 8.
Drill bits had cutting edges of the similar geometry and
configuration as those used by White. Specifications are
as follows:
Included angle (©) - 70°
_ _o
Clearange angle (8) - 2 0
Axial rake angle (a) - 0°
o
Face angle (y) - 25
Bit diameter (G) - 3/4 inch
Bit connection - 5/16 NC thread
Coolant, air or water was supplied to the cutting edge dur ing drilling through the hollow shank and ports on the out
be-m o 10 o w m CM in CM in _ O ro • m +» .' ro in U CD C— CD A *H CD P .Q U U 3 m (d C. O U •H o in in m <a-x CO o P P >1 CD *0 O 0 C tt H C M < ro o
.03 x 45° c h f 25 .125 7° R E L IE F .( 2 ) PLACES DIAMOND COMPAX 20° R E LIE F (2 )
Figure 8a 180° Diamond COMPAX
GEOMETRY OF THE DIAMOND COMPAX
.53! - cemented carbide comp ax diamond .03 x 45° c h f. 25° .125 ,750 o ia . 7° R E L IE F ( 2 ) PLACES DIAMOND COMPAX .117--- - 20° R E L IE F (2) PLACES .320 DIA. .282
neath the cutting edge, may be seen in the bit photographs
1 and 2. \
1. Cutting Edges
(R)
Two CARBOLOY cemented tungsten carbides were used in
the initial test sequence. The composition and physical pro perties of these straight tungsten-carbide cobalt grades are tabulated below:
Grade 44A Grade 241
Cobalt, Co, Percent 6 10
Tungsten Carbide, WC, Percent 94 90
Hardness (Rockwell A) 91 88.5
Abrasion Resistance (1/vol loss) 15 6
Impact Strength (Charoy) in-lb 12 17
Transverse Rupture Strength (psi) 320,000 4 00,000
Compressive Strength (psi) 750,000 610,000
3
Density (gms/cm ) 15 14.5
The ten percent cobalt grade (241) was selected for this test in an attempt to develop data for comparison with the
earlier work by White. This cemented carbide has the same
basic composition and physical properties as that used in the tools tested by White.
Grade 44A, six percent cobalt, was included in this evaluation because this carbide, like others of similar
m
m
Photograph 2
3 / 4 - inch Rotary Drag Bits
composition and physical properties, is used to a great extent
in current rotary drilling applications. Cemented carbide of
\
this cobalt content is the primary cutting edge used in under ground mining rotary drill bits for roof bolting.
/ R \
The COMPAXv ' diamond drill blank consists of a diamond to diamond bonded layer of multi-crystalline diamond 0 . 0 2 0 inch thick which is in turn bonded to a cemented carbide substrate nominally 0.110 inch thick. The diameter of this unique
com-(T)
bination of MAN-MADE diamond and tungsten carbide was 0.330
inch. This new manufactured diamond product is made by Speci
alty Materials Department of the General Electric Company util izing super-high pressure/temperature technology.
These diamond pills were too small to provide a complete
cutting edge diameter. Therefore, they were mounted to the
bit body along with a carbide support member as shown by the photographs 1 and 2. This fabrication method provided the proper support while maintaining a cutting edge configuration similar to that of the initial carbide tipped test bits. Cor rect clearance angles were ground after the diamond blank was brazed to the bit body.
(R) Registered Trade-Mark of General Electric Company
B. DRILLING MACHINE AND CONTROLS
The drilling machine used for these tests was designed and built by Chris White (1969) for his "Drillability Index"
work. Many modifications were made to increase the machine1s
flexibility. These modifications allowed the use of differ
ent drill steel lengths and the handling of bigger rock sam ples .
Photograph 4 Drill and Cage Assembly
Figures 3 and 4 show the drill and control assembly. Following is a brief description of the machine's components
N
and controls.
1) Chuck and Drill. The front parts of the drill con
sist of a Gardner-Denver CH3A chipping hammer. Com
pressed air can be applied to the hammer for per cussion drilling, but was not used during these
rotary drilling tests. The chuck which holds the
'drill steel is contained in the chipping hammer. The chipping hammer is bolted to a lower section
which facilitates rotation. This lower section is
mounted on slides secured to the frame. A shaft connects the hammer to the hydraulic gear motor and rotates in the lower section within chevron packings.
2) Rotation Systems and Controls. Drilling rotation
is produced by a commercial hydraulic 1-inch gear
motor, Model MD 321 GAAB 10-8, which is connected to the drill through a keyed shaft. The direction of rotation may be reversed by changing the inlet
and outlet hydraulic lines. The speed of rotation
is controlled by a Waterman 1407 pressure-compensated flow-regulator which allows speeds of 0 to 750 rpm. Speed readings were measured by a General Electric battery tachometer mounted near the lower section operated by the drive shaft.
3) Thrust System and Control. Thrust is provided by a 2-inch bore, 12-inch stroke, Model R2C Hydraline
hydraulic piston. Pressure to the cylinder was
regulated by a Vickers XTL-03-B-10 reducing valve. Pressures from 25 to 1000 psi may be regulated to the cylinder giving a thrust operating range of approximately 75 to 3000 lbs.
4) Hydraulic System. The hydraulic gear motor and
thrust cylinder were supplied by a Racine 2FA vari able volume vane pump, Model PVF-PSS010ER, with a maximum supply pressure of 1 0 0 0 pounds per square
inch. The pump was driven by a Louis Allis 7.5 horsepower, 220-volt, 3 phase, 60 cycle, 1200 rpm synchronous motor.
5) Timing System. Penetration rates were determined by
a set of micro switches operated by two cams mounted on a shaft parallel to the direction of drilling. The distance between the two cams may be set to any
desired drilling distance. The times distance was
one inch less than the distance between the cams. One micro switch starts the time at one inch of penetration and the second micro switch stops the timer and dril at a preset depth. The one inch of untimed drilling gives the operator time to stabi lize the system and eliminates any surface effects in the rock block being drilled. The micro switches
controlled a Standard Electric J-R timer and shut the hydraulic motor off when the preset distance was
\
drilled. All drilling rates were calculated from a
timed distance of 3,0 inches.
6) Mounting Cage. The blocks to be drilled were secured in a steel cage anchored to the floor by 4 threaded rods. The cage is big enough to easily handle 12x
12x12 inch blocks. The blocks could be raised or
lowered with a screw-jack at the bottom of the cage. Side movement, for changing drill hole positions, was done by adjusting screw bolts on either side of the cage. The lateral range of movement by the
screw-bolts was 6 inches. For additional movement
the entire cage was moved by loosening the anchor bolts and repositioning the cage assembly in the desired location.
7) Flushing and Controls. Air and water were supplied
by a jacket mounted around the base of the drill steel. Flushing entered the steel by 3 equally spaced holes, down the drill steel and out 2 small ports in the bit. The amount of flow was regulated by two valves on the
machine. Two Roto-sight flow indicators were used
to measure flow rates. A pressure regulator was used
ahead of the air flow indicator to supply a constant
pressure to the meter. Compensating factors were
pressure for the air flow. Water flow rates were
read directly from the meter. The cuttings and
water were collected by a collar mounted at the rock face through which the bit and steel passed. Two vacuums, one for dry and one for wet drilling, were attached to this collar.
C. PHYSICAL PROPERTY TESTS
Physical property tests were performed on each rock type before drilling. These tests are identical to those used by Chris White in his Drillability Study, and have previously been found to correlate with drilling rates by many other
investigators. Where bedding was present, the tests were
performed normal to the bedding planes to correspond with the direction of drilling.
1) Schmidt Impact Hammer Tests. The Schmidt impact
hammer is a hand held instrument designed originally
for testing concrete. The hammer consists of a
spring-loaded piston which is projected against an anvil. The anvil is held in contact with the sur face of the rock to be tested. The piston rebounds after striking the anvil and the height of rebound is indicated on an arbitrary scale of 0 to 1 0 0. This scaled reading is the Schmidt impact hammer value,
Schmidt impact hammer values were determined on each 12 x 12 x 12 inch block to be drilled. The block was
\
placed on a concrete floor and twenty readings were obtained. Care was taken to keep the instrument in the vertical position and to impact a fresh area for
each reading. An average and standard deviation was
calculated for each data set.
2) Shore Scleroscope Tests. The Shore scleroscope is
a laboratory test instrument used to determine the
relative hardness of a material. The hardness value
is expressed as the height of a rebound, on an arbi trary scale of 0 to 140, of a small pointed hammer. The hammer falls within a glass tube, from a height of 10 inches, onto the rock surface. The hammer is raised up the glass tube by a hand held vacuum bulb. The standard hammer is 1/4 inch in diameter, 3/4 inch long, weight 1 / 1 2 ounce, and has a diamond
striking tip rounded to a .01 inch radius.
Twenty shore scleroscope hardness readings were taken on a cut surface of a 1.5 x 1.5 x 3.0 inch block of each rock type. Care was taken to impact
a fresh area for each reading. Averages and stan
dard deviations were calculated for each rock type.
3) Uniaxial Compressive Strength. Many investigators
have found uniaxial compressive strength values to have a direct relation to drillability of rock.
Uniaxial compressive tests are widely accepted and can be performed easily in most engineering labora-
\ tories.
In keeping with Whi t e fs work, lh x 1% x 3 inch prisms of each rock type were tested. Ten samples of each rock type were prepared and tested in a Tinius Olsen
120,000 pound capacity testing machine. Each speci
men was cut with a diamond saw from the same block to be drilled. The ends of each sample were planed to a parallel tolerance of ±,005 inch. The evapor- ite specimens were cut and planed dry to prevent
possible dissolving. Where bedding was present,
each block was cut so that loading would be normal to the beds.
Each specimen was placed between self-aligning steel plates and loaded at a rate of 5000 pounds per min ute and taken to failure. Photographs 5 and 6 show
failure modes for the sample prisms tested. Uni axial compressive failure strength values were cal culated by dividing failure load values by the sam ple's cross-sectional area.
4) Young's Modulus. Young's modulus is defined as the
ratio of stress to strain, or the rate of change of strain for a change in stress. Young's modulus
was found for each rock type tested, A dial micro
Photograph 5
Rock Samples taken to failure A-Marble B-Dolomite C-Oil Shale
D-Trona
Photograph 6