Journal of Person-Oriented Research
2016, 2(1–2)Published by the Scandinavian Society for Person-Oriented Research Freely available at
http://www.person-research.org
DOI: 10.17505/jpor.2016.10The Potential of Mixed Methods for Person-Oriented Well-Being
Re-search
Ivo Ponocny
1, Christian Weismayer
11Department of Applied Statistics and Economics, MODUL University Vienna, Vienna, Austria
Contact
ivo.ponocny@modul.ac.at
How to cite this article
Ponocny, I. & Weismayer, C. (2016). The Potential of Mixed Methods for Person-Oriented Well-Being Research. Journal of Person-Oriented Research, 2(1–2), 102–110. DOI: 10.17505/jpor.2016.10
Abstract: The assessment of individual well-being has found its way into official statistics not only via objectively
measurable indicators, but also focusing on subjective well-being via life satisfaction or happiness self-ratings. Although a first step towards a person-centered view is taken by that (compared to classic GDP reporting), it can be demonstrated by means of qualitative interviewing that a lot of essential information gets lost when relying on aggregate life evaluation, even if subjectively reported. The database is taken from the MODUL Study of Living Conditions (Ponocny, Weismayer, Dressler, & Stross,2015), which provides, among other gathered data sources, 500 semi-structured interviews about the current quality of life from different locations in Austria, together with subjective self-ratings about life satisfaction and happiness. Numerical self-ratings are contrasted to what people actually reported about their lives. The comparison between both approaches shows that top global self-evaluations tend to hide essential problematic aspects which people tell about their lives verbally. This does not only let the single-item self-ratings look very superficial, but even essentially biased, when prematurely interpreted by researchers. Additionally, different patterns were detected how the study participants interpreted life satisfaction and happiness at all. Merging quantitative information such as implausible response patterns (found by configuration frequency analysis) with qualitative information from the interview narratives helped to explain counterintuitive responses. Summed up, this mixed method approach demonstrates the importance of considering not only aggregate information, but also following a more holistic view on individuals and their specific configurations of internal and external quality of life conditions.
Keywords: Person oriented research, qualitative methods, mixed methods, subjective well-being, social indicators,
configuration frequency analysis, official statistics, quality of life
Quality-Of-Life on an Aggregated Level
Quality of life (QoL) has become an important agenda point within the national and international systems of social re-porting. All over the world, national statistical offices and other institutions are collecting data about the individual well-being of citizens, following the belief that economic productivity is a weak proxy for judging how well single persons do, let alone as how positive or negative individ-uals themselves perceive their living conditions and the af-fective experience of life. Two marked cornerstones of this
development are the European Union’s “GDP and beyond”-movement (cf. European Commission, 2015) and the so-called Stiglitz-Report to the OECD (Stiglitz, Sen, & Fitoussi,
2010), which emphasize the need of distribution consider-ations as well as the need for subjective, individual evalua-tions of people’s individual lives.
There are different measurement concepts and many dif-ferent choices which particular variables are actually imple-mented in QoL reporting, including material living condi-tions, employment, education, participation, health, trust, crime, time use, environmental depletion, affect experience
and life satisfaction (LS in the following;OECD,2011; EU-ROSTAT,2015). On the other hand, all approaches share the view that QoL involves a lot of different aspects and that the self-perception of the individual is not identical to the “objective” information available. Therefore, person-centered considerations suggest themselves as enhance-ments regarding two aspects:
1. complexity and multidimensionality of the situation to be evaluated, and
2. interaction between the objectively observable living conditions and the respective individuals’ attitudes or emotions.
Happiness research puts a lot of emphasis on the possible discrepancies between objective and subjective conditions, and stresses that different persons will differently judge the same circumstances (Zapf,1984). Accordingly, and consid-ering the aspects as listed inBergman and Wångby(2014), there are good reasons why QoL evaluation should be de-signed in a person-oriented way: the holistic character of the matter to be studied, the individual-specific nature of part of the data, the host of interactions between different levels and the laws driving individual happiness or satis-faction, all far from being identical for different individ-uals, but nevertheless sharing common processes (such as the extremely detrimental effect of unemployment for most of the respondents affected). Typical patterns are likely to arise.
In contrast, official reporting usually takes an aggregated perspective and does not lay its focus on characteristic pat-terns, though for example individual accumulation of un-favorable conditions or societal risks in terms of multiple burdens are an issue, at least in some analytical reports. But in most cases, multivariate analysis follows linear or additive models such as OLS or WLS regression and does not investigate individual profiles. Neither does well-being assessment invest much visible effort into the second prob-lem mentioned, which is to explicitly tackle the manifold if not even idiosyncratic character of individuals’ internal reactions on external conditions. Sometimes composite in-dexes are built from aggregated variables, such as the Hu-man Development Index (life expectancy, GDP, education; seeUnited Nations Development Programme,2015), some-times indices evaluate patterns (and summarize them) on individual levels such as the method proposed byAlkire and Foster(2011), counting in how many areas (per person) certain threshold values are not reached.
Person-oriented methodology as mentioned inBergman and Wångby(2014, e.g., cluster analysis, configuration fre-quency analysis, latent class analysis, non-linear dynam-ics, etc.), or consideration of single persons or patterns hardly takes place, as it is not the traditional scope of offi-cial statistics. However, the large data basis on which these statistics rely would better allow for single-case or pattern analysis than probably many of the small-scale academic data collections; this seems desirable, since the cause-effect-structure regarding QoL is potentially complex, non-additive and contains many moderators and conditions (an influential example for a sophisticated QoL concept is given
by Costanza et al.,2007), so that well-being profiles would be a more natural basis for conclusions rather than single-item evaluations.
Unfortunately, because of the subjective character of in-dividuals’ self-assessments, the difficulties even go beyond the level of response patterns: results will show that a re-spondent’s perception or interpretation of the question is an important moderator between the objective living condi-tions and the individual judgments, or, asZapf(1984) for-mulated, there can be inconsistent welfare positions: sat-isfaction under bad circumstances, and dissatsat-isfaction in a beneficial environment. The complexity of response pro-cesses in particular in the context of life satisfaction self-ratings was pointed out by many authors in the meantime, for example referring to the variety of meanings of the terms satisfaction or happiness (for an overview, cf. Hay-bron,2008), to the difficult cognitive steps to be taken and the role of context effects (e.g.,Schwarz & Strack,1999), or to the potential insensitivity of the ratings to actual displea-sure in life (Ponocny, Weismayer, Dressler, & Stross,2016). This has led us to the belief that person-orientation should even go one step further and include qualitative methodology, which allows interviewees not only to follow, but also to communicate their own views about their lives. The extreme variation in the individual history will make it difficult to grasp such aspects within a setting of closed questions only. As a first example, an interview from the pre-test phase of our study (Ponocny et al.,2015) shall be mentioned in which a person claims to be restricted by the size of her estate, though the interviewer considered house and garden to be quite huge, referring to usual Austrian standards. In the course of the interview it turned out that she has lived on an even larger estate which was later in-herited by her brother, which makes her still feel treated unfair. Having this quite specific information, her judgment is much better understandable than before.
In the following, the methodology underlying our data collection is described and the value of qualitative infor-mation regarding “living well”, the interpretation of self-ratings, and possibly different meanings of the same re-sponses from different persons are demonstrated. Finally, a mixed-method triangulation shows how the combination of a person-oriented statistical evaluation (here: a configura-tion frequency analysis) and qualitative interview informa-tion helps to gain a deeper understanding of the data – and therefore of the living conditions which shall be mapped.
Methods
Data was gathered in course of a publicly financed research project. In order to benefit from the advantages of method triangulation, four different methodological data collection approaches were used in the years 2011 and 2012: ques-tionnaires (#908 printed+ #546 online), diaries (#335), interviews (#500), and group discussions (#20). Ten study locations were pre-selected upon a list of various indica-tors (e.g. population density/development, aging, gross regional product, available income of private households, residents’ origin/citizenship, infrastructure). A total of 500
questionnaires plus response envelopes were sent out to 7 out of the 10 study locations each. Addresses were se-lected making use of simple random sampling out of tele-phone books and lists bought from a commercial company. Alternatively, three communities distributed the question-naire on their behalf, whereby one of them used the mu-nicipality’s newspaper to attach the questionnaires plus re-sponse envelopes. Snowball sampling helped to supple-ment the pool of participants per location where needed. Finally, respondents show a quite balanced representative-ness in terms of various socio- and demographic charac-teristics (e.g. age, education). After some pre-test inter-views, 500 semi-structured interviews and 20 group discus-sions were conducted by 12 psychology graduates, and 335 completed diaries were delivered by post mailing contain-ing half-hourly statements and evaluations over the time span of one week applying the day reconstruction method (Kahneman, Krueger, Schkade, Schwarz, & Stone, 2005). Respondents were volunteers which had already been in-terviewed.
All participants, including interview partners, gave a rat-ing of their LS on a scale from 1 (“extremely dissatisfied”) to 10 (“extremely satisfied”), the wording was like in the usual standard questions, “Taking all things together, how satisfied are you with your life these days?” (in German: “Wie zufrieden sind Sie alles in allem mit Ihrem Leben?“ 1 – extrem unzufrieden, 10 – extrem zufrieden).
Data were evaluated by means of qualitative contents analysis (Mayring, 2007), contrasting actual life circum-stances with subjective self-ratings, by counting the preva-lence of different concepts of happiness and satisfaction, and by combining qualitative reasoning and the quantita-tive results of a configuration frequency analysis.
Results
Individual Narratives and Life Satisfaction
It is a trivial expectation that the contents of a life narrative provide more specific information than a single self-rating value does, and that the hedonic profile of a person’s life will give a more diversified picture than a single number. The question is rather the extent to which this takes place: does the qualitative information “just” refine in more detail what is well summarized by the self-rating, or does it actu-ally discredit statements researchers would conclude from the single item?
Inspecting Table 1, which shows leading positive or neg-ative interview content for 15 persons with the extreme LS value “10”, the authors believe that the qualitative informa-tion provides much more than just some refinements. Note that only interview content was selected for which an af-fective consequence was indicated in the interview by the interviewees themselves. Furthermore, these statements were only selected if they were considered as very influ-ential for the hedonic status. In other words, Table 1 only contains positive influences which were connected to pos-itive appraisal, and only negative circumstances the nar-rator indicated to suffer from. The 15 respondents have
been randomly selected from those who had rated them-selves as “extremely satisfied”, and listed in the order of an external rating of the reported hedonic level (each inter-view was also externally rated by a member of the project group, judged by the contents and applying the same ques-tion about LS than the interviewee had responded to). Even without a definition in the literature what life satisfaction “10” exactly means, as the maximum possible value it is ex-pected to refer to top life experience, or at least a level inter-pretable as reasonably close to it – at least this is what most researchers would probably do. In particular, high numbers would suggest that the persons’ living conditions are fine, or at least fine enough for a “good” life. And this seems rea-sonable to assume for the first entries in Table 1, but gets more and more doubtful for the later ones: in fact, there are few interviews which do not mention substantially bur-densome circumstances, many mention aspects which seem moderately burdensome, but some let the LS value of “10” even seem implausible. The list of burdens includes ma-jor health problems, severe concern about the future, and sometimes even fatalities of close relatives, in one extreme case the death of parents, husband and son in the past 10 years.
What we want to show here is not that subjective evalua-tion would not be credible – we do not doubt that, from the respondents’ point of view, the responses do express their LS in some way, but the response is not necessarily illu-minating for an external observer who does not know the individual history, the anchor level of the respondent, re-sponse style and the personal context and reference points from which the response-generating process emerged.
Similarly, Table 2 refers to contents of the narratives of 15 persons who rated their LS as “9” out of ten, which is the best but one category. Again, in spite of the positive self-ratings we observe a lot of displeasure: a widow’s feeling lonely, stress and sleeping disorder, and death of relatives or divorce. By experience, experts to whom tables like this are presented do not guess that they refer to a selection of very positive self-ratings. Considering the needs of offi-cial statistics, which has questions like this embedded into the system of social reporting indicators, the question arises how informative results can be which do not reveal so many negative circumstances about subjective experience?
Therefore, we claim that a more person-oriented view on living conditions would be desirable, and for complex matters as LS qualitative interviewing may be a valuable data collection tool. Though it has to be acknowledged that the standard LS question asks for an individual view and is person-oriented in a sense, it is still an aggregation over complex patterns and cause-effect-structures which does not allow for intra-individual analysis. As we conclude from Tables 1 and 2, this bears the danger of missing an important part of the object to be investigated, not only re-garding academic analysis, but even the actual amount of displeasure in the descriptive reporting.
Qualitative interviewing may also help to characterize the life experience of individuals which would hardly be detectable by closed-response assessment tools. One of the sample communities was selected due to the fact that most
Table 1. Contents of life narratives of “extremely satisfied (10)” respondents
Case no. Leading positive circumstances Leading negative circumstances
1 good family life, proud –
2 harmonic partnership gall operation ahead, lack of contact to children
3 family and friends study stress and lack of recognition
4 friends study stress and lack of recognition
5 leisure activities depressive mother, concern about future of children
6 family and colleagues hearing loss, herniated vertebral disc
7 social contacts, home nature death of parents, husband and son in the past 10 years
8 friends, partner and housing entrepreneur’s innovation pressure
9 harmonic and supportive family change of study location, death of grand parents
10 faith, caregiving to parents cancer of husband, death of child
11 family, friends, leisure activities financial restriction, concern about future of children
12 proud, partnership, friends financial sorrows
13 satisfied, financial security, recognition in job worries about affordability of children’s studies
14 music, sports, going out angry about school policy
15 health, sports, parents support study lack of leisure, dissatisfied with oneself and study progress Table 2. Contents of life narratives of respondents rating LS with the best (10) but one (9) evaluation
Case no. Leading positive circumstances Leading negative circumstances
1 family, friends, job, freedom dissatisfied with politicians‘ engagement
2 job, garden, pleasant life work and childcare burden, financial sorrow
3 religion, music, sports death of friend
4 children widowed, lonely
5 family, works with people, new home country stress, night shifts, few social contacts, sleepless for noise 6 partner, family, recognition in job longs for more leisure time
7 friends, health, culture, cycling father away in war area, mother burdened therefore 8 supported by partner, family, environment restricted by multiple sclerosis, but not very burdened 9 family, desired apprenticeship divorce of parents, house sold, exam stress
10 family, job, dog suicide of mother and brother, debts, nervous
11 parents and parents in law no sports studies due to shoulder problems
12 work colleagues death of brother, low-back pain, dissatisfied with
environ-ment
13 bycicle trips stress at work
14 friends, culture, housing, environment death of sister, herniated vertebral disc
15 friends, wood, nature stress (education, work, household, kids), lack of time and support
of its inhabitants live in the shadow of a mountain and have no direct sun during a long winter season. Indeed, many of the interview partners spontaneously mentioned this fact as an influence, demonstrating that the study would have detected this important local climate condition even if re-searchers would have been unaware before. Two more ex-amples show the benefit of the interviewees’ option to re-port what is imre-portant to them, from their personal point of view. Both relate to quite idiosyncratic but for the individ-ual highly relevant experience in the context of migration background and go far beyond what usual closed responses could express: “When I was 10, two boys used to chase me after school and hassled me. [...] Unfortunately they caught me one day, and one of them pressed a small knife on my throat.” – “A friend always visited me at home, and then she began to wear black boots with white laces, and I asked what this was about, and she said: ‘I am in a group, and we do not
like foreigners.’ And I thought: ‚Okay.‘“
Another cumbersome aspect the interviews pointed out – but which is not emphasized much in the literature – is that moving has a bad effect on the subjective well-being of many young people.
Individual Understanding of Life Satisfaction
The preceding section dealt with the description of liv-ing conditions which would – in our opinion – benefit from including more person-oriented elements in the as-sessment system, in order to capture the situation of in-dividuals in proper complexity. However, the need for a person-oriented, holistic view when evaluating hedonic states reaches even deeper than that, since not only idiosyn-cratic events or combinations of living conditions may be characteristic of certain persons, but already the process
through which they generate their responses, in particular self-ratings of LS or happiness. A first example illustrates that notions may be interpreted differently by different per-sons, and may lead to different responses which not nec-essarily mean differences in the substance. Asked for re-strictions in life, two persons found themselves somehow restricted by family or partner, but were not unanimous whether the word applies to their situation at all: “No, I am not restricted. You have to be considerate of the children and the wife, but I would not call this a restriction.” – “Do not take me wrong now – of course because of my girl-friend. One has to find compromises frequently, when you want to do something, but you cannot do it in the end.”
Analyzing the interviews, it more or less immedi-ately emerged that there are different interpretations of the terms “satisfaction” and “happiness” (in German: “Zufriedenheit” and “Glück”), in particular both as being the same, or satisfaction as a moderate degree of being happy. Some persons explicitly stated to be just satisfied, but not happy with some circumstances. A more systematic evaluation of different concepts of satisfaction, based on a question in the interviews about the relationship between happiness and satisfaction, was carried out by Baumann
(2015). According to her categorization, a bit more than a quarter of the sample described satisfaction as to con-tent oneself with what really counts, slightly less consid-ered happiness and satisfaction as synonyms, and about a fifth saw satisfaction as reaching a basic level whereas hap-piness is more than that: “When I can change my job situa-tion, I will be happy. Now I am only satisfied.”Other groups of responses occurred less often, including satisfaction as the feeling of having achieved something or persons with no idea what to respond. Fortunately, the specific concept used was not seen to influence the self-rating in a system-atic way: either all concepts lead to the same response on average (which is surprising regarding the category “satis-faction as reaching a basic level”), or the verbalization of the concept is hardly related to the actual subjective feel-ings at all. At any rate, considering the person’s individual interpretation of what is asked for will also help interpret the responses in a more person-centered way, closer to the actual experience of the participants.
Triangulation:
CFA Patterns and Interview
Narratives
Analysis of configuration frequencies (CFA) was used to study participants on pattern level. The idea was to locate individuals with over- or underrepresented patterns, com-pared with their expected estimated occurrence (von Eye, Spiel, & Wood,1996). The package cfa (Funke, Mair, von Eye, & Harloff, 2013) was applied which is implemented in the open source R environment for statistical computing (R Core Team, 2015). In the first stage, pattern frequen-cies were determined by making use of the package confreq (Heine, Alexandrowicz, & Stemmler,2015). Patterns were identified based on three different items: How satisfied are you with your life as a whole? (Scale: 1 – extremely dis-satisfied, 10 – extremely satisfied); How happy are you with
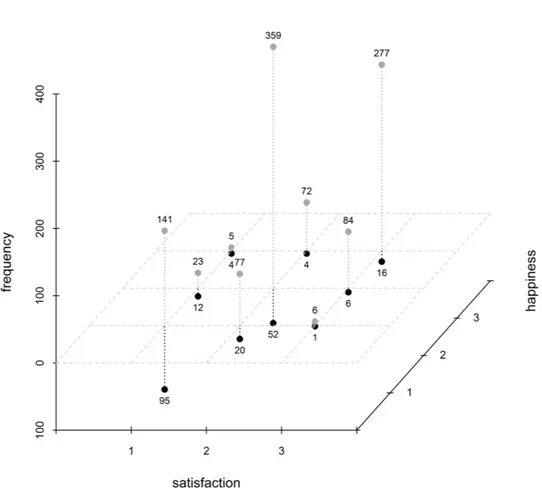
your life as a whole?(Scale: 1 – extremely unhappy, 10 – ex-tremely happy); and: I am often sleepless because of troubles. (Scale: yes vs. no). The latter statement was endorsed by 224 respondents, whereas 1,098 did not signalize that the statement describes their life in an appropriate way. With-out collapsing subcategories of single items there would be 200 different configurations taking into consideration the three before-mentioned questions. To ease the identifica-tion of outstanding patterns, the two items measured on the 10-point Likert-scale were recoded according to a rule sim-ilar to Eurostat’s aggregation in “Quality of life in Europe” (EUROSTAT,2015): 0 to 5 as “low”, 6 to 8 as “medium”, and 9 and 10 as “high”. As the scale of the two questions for the study at hand just ranged between 1 and 10 and therefore represents just a 10-point Likert scale without a “0”, collapsing the values 9 and 10, 6 to 8, and lower than 6 into three categories resulted in 18 possible configura-tions. Figure 1 gives the observed frequencies for people with/without sleeplessness because of troubles on the ver-tical axis, the recoded satisfaction scale on the horizontal axis and the transformed happiness scale on the remaining axis placed on the right side of the graph.
Below mentioned Table 3 lists the corresponding pattern frequencies and CFA results in numerical form.
The first three rows or patterns of Table 1, for which the LS and happiness ratings coincide, show significant overrepresentation and are therefore classified as types. Regarding significant underrepresentation, none of the most prominent antitypes (row 5: high-medium-no, row 6: medium-low-no, row 7: medium-high-no, and row 9: low-medium-no) mention sleeplessness. Focusing on peo-ple who stated “I am often sleepeo-pless because of troubles” (column 3: “Sleeplessness”), the combination of negative satisfaction and happiness evaluations is situated on top of the ordered frequencies (#95) which seems plausible. These observations (low-low-yes) are considered as types – being significantly overrepresented and in addition the only type mentioning sleeplessness due to troubles. The next pattern frequency within this group – evaluating both sat-isfaction and happiness as “medium” (#52) – already repre-sents a better evaluation compared to a low & medium eval-uation combination of satisfaction and happiness or vice versa. Also the following frequencies show a strong ten-dency of happiness and satisfaction to coincide, an effect which seems to outweigh the opposition between life eval-uation and sleeping problems. Still the opposite response style with labels high-high-yes is represented by respon-dents evaluating their whole life with the most positive cat-egories of the satisfaction and happiness scale but mention at the same time that they are often sleepless due to trou-bles (#16), whereby no significant over- or underrepresen-tation is present for this pattern. Such extreme discrepan-cies require some explanation, but without any further in-formation, clarification of this phenomenon would not be possible. Method triangulation using questionnaires, in-terviews and diaries conducted in the “MODUL study of Living Conditions” (Ponocny et al., 2015) allows one to uncover characteristics of single respondents from differ-ent perspectives. More concretely, two out of the 16
re-Figure 1. Observed frequencies for persons with (black) and without (grey) sleeplessness because of troubles
Table 3. Configuration frequency analysis results
LS rating Happiness Sleep- Observed Expected p-value Classification p-value Classification rating lessness frequency frequency (χ2-distribution) (z-distribution)
medium medium no 359 207.82 0.00E+00 Type 0.00E+00 Type
high high no 277 97.87 0.00E+00 Type 0.00E+00 Type
low low no 141 63.2 0.00E+00 Type 0.00E+00 Type
low low yes 95 12.71 0.00E+00 Type 0.00E+00 Type
high medium no 84 138.78 2.38E-04 Antitype 1.66E-06 Antitype
medium low no 77 131.82 1.39E-04 Antitype 8.98E-07 Antitype
medium high no 72 146.56 1.16E-07 Antitype 3.67E-10 Antitype
medium medium yes 52 41.8 6.47E-01 - 5.74E-02
-low medium no 23 99.64 4.83E-12 Antitype 8.10E-15 Antitype
medium low yes 20 26.52 8.09E-01 - 1.03E-01
-high high yes 16 19.69 9.52E-01 - 2.03E-01
-low medium yes 12 20.04 5.21E-01 - 3.62E-02
-high medium yes 6 27.92 1.76E-03 Antitype 1.68E-05 Antitype
high low no 6 88.03 9.99E-16 Antitype 0.00E+00 Antitype
low high no 5 70.27 2.15E-12 Antitype 3.44E-15 Antitype
medium high yes 4 29.48 1.98E-04 Antitype 1.35E-06 Antitype
low high yes 4 14.13 1.22E-01 - 3.51E-03
spondents, for whom interviews, questionnaires, a separate socio-demographic questionnaire and an external rating is available, are going to be discussed now in detail. Making use of quantitative and qualitative collected information of-fers a view from outside a pure numerical distributional perspective.
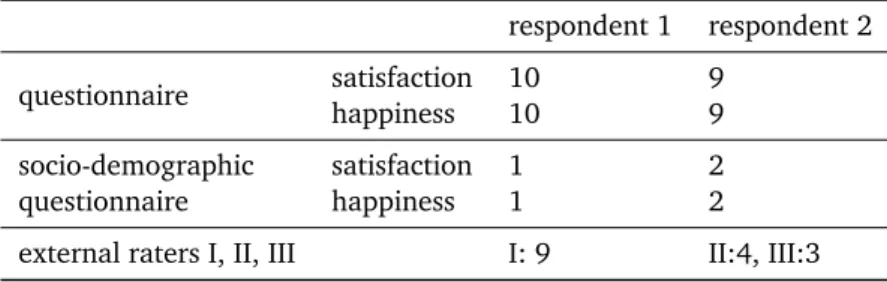
With the aim to cross-validate response patterns, before-mentioned satisfaction and happiness questions were asked two times, once on a scale coded from ‘1 – extremely dissat-isfied/unhappy’ to ‘10 – extremely satisfied/happy’ in the questionnaire, and a second time visually presented in the opposite direction in the course of the interview in form of a socio-demographic questionnaire on a scale coded from ‘1 – very satisfied/happy’ to ’10 – very dissatisfied/unhappy’ leading in a transposition of the scales’ pooling. From Ta-ble 4 one can see that for the two cases both data sources match each other perfectly (if scale category distances are assumed to be constant over the whole satisfaction and happiness scales). Positive numerical questionnaire ratings were furthermore supported by external ratings evaluating the interviews on a scale from ‘1 – positive’ to ’10 – neg-ative’. Out of 16 raters, three evaluated one of the two interviewees. Results can be retrieved from Table 4. Exter-nal rater assessments see the overall life evaluation slightly more critical.
Inspecting the questionnaire data, first of all both inter-viewees refused to identify themselves with the following two statements: “I feel glad all over.”, and “I live in har-mony with myself.” Such statements should typically go hand in hand with the most positive satisfaction and happi-ness ratings. In addition, one of them did not mark “At the moment I enjoy my life”. Summarized, the situation cannot be dissolved just based on more questionnaire data as it is still unclear why respondents give positive overall life rat-ings but judge questions in the opposite direction for other items or at least show non-agreement with positively for-mulated statements. Having a look at the individual mak-ing use of qualitative interviews reveals insight into two logical justifications of a primarily rather confusing situa-tion.
Respondent 1: The first interviewee was a 26 years old female student who was living together with her boyfriend, working from time to time, being motivated in her studies and happy with her hometown in comparison with situa-tions in other countries, participating in tennis, water ski and ice hockey clubs, being financially supported by her mother, and so on. All those comments are in accordance with the most positive overall life ratings. However, the main reason why she endorsed that she “cannot sleep be-cause of having troubles” seemed to be just an imminent final exam of her studies in law. She mentioned that she ac-tually spent a lot of time at home studying and this caused mood swings. Further reasons mentioned during the inter-view that might have yielded her to mark the “sleepless”-statement might be the conflict potential with her mother as she is living together with her and her boyfriend in the same house. But during the interview she mentioned that she thinks that this is nothing special and did not put too much weight on it.
In this case, the coincidence of two seemingly contradic-tory properties – positive self-rating vs. sleeplessness due to troubles – are plausibly explained by disentangling short-term (exam) and long-short-term aspects. This underlines the importance of considering time and whether the current situation is temporary or enduring (or also possibly tem-porary). Personality psychology knows the distinction be-tween states and traits very well and provided methodolog-ical instruments such as latent state-trait theory (cf.Steyer, Schmitt, & Eid,1999). Applied to subjective well-being,Eid
(2008) discriminates between habitual mood, momentary effect and situation specific aspects, additionally applying item response theory or latent class analysis, resp.
Respondent 2: The second interviewee was a 79 years old woman. She suffered from a lot of physical and psy-chological burdens. Her husband died early and she had to take medication; she found another partner whom she supported for a year, and he died as well. From that mo-ment on, she always needed medication. She suffers from diabetes and bronchial asthma, had a breast operation and a bladder surgery and has to carry diapers as she suffers from bowel and bladder incontinence, has blood pressure problems, her daughter-in-law lost her child, her great-grandchild was hit by a car, her sister died two years ago and she is financially under pressure. But her kids take care of her, help her out financially and gave her e.g. a TV or cloths as presents which she could not afford by herself. They gave her strength in the past and in the present and she constantly repeated how happy she is with her kids and their development as well as with their achievements. Her grandchild had his 30th birthday and got married in the year of the interview. She was very proud and happy to be able to experience all that. She repeated that she was al-ways happy with her kids, does not want to miss the time at home when the kids were small and remembers an ex-tremely nice time with her husband. While being asked for the meaning of her life she solely and repeatedly mentions her children. She likes to solve crossword puzzles, listens to music, frequently goes for a walk with a friend and her cousin, manages to save money to go on holiday once a year for a week and goes for a coffee once a week on Friday with lots of other friends.
Overall, both of them show rather similar quantitative questionnaire results, whereby their reasoning due to their story of life is completely different. First of all, both in-terviewees were at a completely different stage of their life. The student struggled, if at all, with negative thoughts while looking into the future. The elderly lady already re-viewed life with a lot of strokes of fate in mind. Secondly, the student identifies a lot of options for the future that keep her motivated, whereby the elderly lady primarily al-ready remembers wonderful times with her husband and her kids. Thirdly, the student is kept grounded by their boyfriend and family, the elderly lady primarily by her kids and friends. Fourth, reasons for being sleepless are rather temporary for the student but long-termed for the lady. So they are expected to change for the former but not for the latter. Fifth, these reasons are purely psychological for the student but balanced for the elderly lady if not an overhang
Table 4. Satisfaction and happiness ratings respondent 1 respondent 2 questionnaire satisfaction 10 9 happiness 10 9 socio-demographic questionnaire satisfaction 1 2 happiness 1 2
external raters I, II, III I: 9 II:4, III:3
to physical burdens might be interpreted. All in all, both of them have their own way of coping with their negative thoughts and cannot be compared in any way just making use of a list of rating statements. Reasons are too diverging to lump them all together and will not be or at least too hardly be capable of capturing the whole bunch of topics human beings are confronted with over a lifespan.
Discussion
“Psychology is strange.” This is Valsiner’s (2015, p. 7) opening statement, referring to the discrepancy between the subject of this science and its dominant research style where human individuals seem to disappear behind num-bers and tables. But in this sense not only psychology is “strange”, and similarly the science of subjective well-being, but official statistics as well, in particular social statistics. It shall describe how lives are (cf. OECD,2011, “How’s life?”), but actually people are not given too much of a chance to tell about their lives. The inclusion of sub-jective indicators into the reporting systems is a first giant step to give citizens a voice and to let them judge for them-selves – but they have to compress the variety of life ex-periences into one or a few numerical values. On the one hand we open our measurement tools for the individual ex-perience of life, on the other we close them immediately by the assessment formats, as if we were interested, but not that interested. The authors believe that their results show in a manifold way what gets lost if we design data collec-tions as it is currently done: major parts of the phenomenon itself, but even the understanding of the responses, and maybe worst, the capability to perceive interpretation bi-ases of the results. The results demonstrate quite clearly that (presumed) untroubled self-ratings do not necessarily mean untroubled experience.
Certainly, this is not a matter of disinterest of statisticians but a consequence of the many restrictions on large scale public surveys, due to respondent burden, costs, duration of the assessment, political acceptance, and so on. Probably the most crucial issue within official statistics is objectivity: if one leaves the framework of closed-response scales, eval-uation of the data might not only be expensive, but also de-pendent on the evaluators’ personal opinion, whereas the aim and the self-understanding of official statistics are to report objectively, beyond any ideological lens.
So what benefit lies in pointing out the potential of quali-tative measures, and in demonstrating how much gets lost,
if we might have to restrict ourselves to the usual invento-ries, anyhow? Apart from the necessity at least to know more about methodological flaws, even if nothing could be changed, there are some consequences or recommenda-tions which do not appear to be too unrealistic. As the first one, qualitative studies – at least by academics – could lay the ground for more refined quantitative assessment tools, with more detailed questions or items which are specific for certain subpopulations, and then specific patterns could be identified rather than evaluating lives at a unidimensional level. As in our example, the contemporary stress of a stu-dent could better be discriminated from the burden of an elderly person mitigated by a supportive family. This would also be helpful for designing political measures, since the better the patterns of burdens are known, the more effi-ciently policy or society will be able to react. Superficial, overly aggregated data will hardly provide the basis for con-structive interventions.
Second, qualitative studies could help to keep the list of indicators up to date; new problems will arise, and cur-rently there is no explicit structure which would allow for a systematic screening of emerging societal problems. Simi-larly, regional qualitative studies could identify locally rele-vant parameters which could then be added to the standard core items of a survey.
But apart from just being a basis for constructing add-on closed-response items, qualitative screening efforts could also deliver stand-alone information, in particular if con-ducted regularly (but probably with only moderate period-icity). Although the sample sizes would be small and there-fore not guarantee representativeness, person-centered in-formation has the power to uncover a wide range of oppor-tunities or obstacles salient in a region. Even with sample sizes of only about 100 (which is financially not too restric-tive even on a quite local level) it is likely that concerns of not too small minorities will raise awareness. In-depth sin-gle case studies will also tell about other people, whereby the degree of generalizability may be discussed on a case-per-case basis. Respondent 2 in this article may serve as an example how the effects of “hard” circumstances such as health and financial problems are mitigated by “weaker” factors such as the quality of social contacts, again demon-strating the importance of knowing about the full pattern of different influential factors. Sometimes also the existence of phenomena may be illustrative or operative, even if re-stricted to single cases, such as narratives about bureau-cratic obstacles or specific discrimination experiences (both examples taken from the MODUL study).
Summing up, qualitative views in individual fate have large potential to look behind the indicator figures, by themselves or – even better – by combining them with large-scale but pattern-oriented quantitative studies within a mixed-methods approach. In particular considering the many burdens which are not brought to light out of the sub-jective global self-evaluations, they may help prevent what would be a crucial failure in social reporting: that the prob-lems of certain persons get hidden in aggregate numbers, and therefore ignored.
Acknowledgements
This research was supported by the Anniversary fund of the Austrian National Bank (Project no.: 14399; Project ti-tle: Living Conditions, Quality of Life, and Subjective Well-Being in Regions: A Methodological Study with Explorative Interviewing and Quantitative Measurement).
References
Alkire, S., & Foster, J. (2011). Counting and multidimensional poverty measurement. Journal of Public Economics, 95(7), 476–487.
Baumann, E. (2015). Die Konzeptbildung von Glück und
Zufrieden-heit und die Auswirkungen auf die Messung des Subjektiven Wohlbefindens.[The concepts of happiness and satisfaction and the consequences for the measurement of subjective well-being]. (Unpublished master thesis)
Bergman, L. R., & Wångby, M. (2014). The person-oriented ap-proach: A short theoretical and practical guide. Estonian
Journal of Education, 2(1), 29–49.
Costanza, R., Fisher, B., Ali, S., Beer, C., Bond, L., Boumans, R., & Snapp, R. (2007). Quality of life: An approach integrat-ing opportunities, human needs, and subjective well-beintegrat-ing.
Ecological economics, 61(2), 267–276.
Eid, M. (2008). Measuring the immeasurable: Psychometric mod-eling of subjective well-being data. In M. Eid & R. J. Larsen (Eds.), The science of subjective well-being: Critical
perspec-tives(pp. 17–43). New York: Guilford Press.
EUROSTAT. (2015). Quality of life in Europe – facts and views
– overall life satisfaction. (Retrieved from http:// ec.europa.eu/eurostat/statistics-explained/ index.php/Quality_of_life_in_Europe_-_facts _and_views_-_overall_life_satisfaction) Funke, S., Mair, P., von Eye, A., & Harloff, J. (2013). cfa:
Anal-ysis of configuration frequencies (version 0.9-3)[software].
(Available fromhttps://cran.r-project.org/web/ packages/cfa/index.html)
Haybron, D. M. (2008). Philosophy and the science of subjective well-being. In M. Eid & R. J. Larsen (Eds.), The science of
subjective well-being: Critical perspectives(pp. 17–43). New York: Guilford Press.
Heine, J.-H., Alexandrowicz, R. W., & Stemmler, M. (2015).
confreq: Configural frequencies analysis using log-linear modeling (version 1.3-1) [software]. (Available from
https://cran.r-project.org/web/packages/ confreq/index.html)
Kahneman, D., Krueger, A. B., Schkade, D. A., Schwarz, N., & Stone, A. A. (2005). A survey method for characterizing
daily life experience: The day reconstruction method.
Sci-ence, 306(5702), 1776–1780.
Mayring, P. (2007). Qualitative Inhaltsanalyse. Grundlagen und
Techniken (9th ed.). Weinheim: Deutscher Studien Ver-lag. ([Qualitative Content Analysis. Fundamentals and techniques.])
OECD. (2011). How’s life?: Measuring well-being. OECD Publish-ing.
Ponocny, I., Weismayer, C., Dressler, S., & Stross, B. (2015).
The MODUL study of living conditions (Tech. Rep.). Vi-enna, Austria: MODUL University Vienna. (Retrieved from https://www.modul.ac.at/uploads/files/ user_upload/Technical_Report_-_The_MODUL _study_of_living_conditions.pdf)
Ponocny, I., Weismayer, C., Dressler, S., & Stross, B. (2016). Are most people happy? exploring the meaning of subjective well-being ratings. Journal of Happiness Studies. (in press) R Core Team. (2015). R: A language and environment for
sta-tistical computing[Computer software manual]. Retrieved fromhttp://www.R-project.org/
Schwarz, N., & Strack, F. (1999). Reports of subjective well-being: Judgmental processes and their methodological im-plications. In D. Kahneman, E. Diener, & N. Schwarz (Eds.),
Well-being: Foundations of hedonic psychology. New York: Russell Sage Foundation.
Steyer, R., Schmitt, M., & Eid, M. (1999). Latent state–trait the-ory and research in personality and individual differences.
European Journal of Personality, 13(5), 389–408.
Stiglitz, J. E., Sen, A., & Fitoussi, J. P. (2010). Report by the
com-mission on the measurement of economic performance and social progress(Tech. Rep.). Paris: Commission on the Mea-surement of Economic Performance and Social Progress. United Nations Development Programme. (2015).
(Re-trieved from: http://hdr.undp.org/en/content/ human-development-index-hdi, Nov. 11th 2015) Valsiner, J. (2015). From person-oriented to person-centered
psy-chology: Abstracting structures of relationships. Journal for
Person-Oriented Research, 1(1–2), 7–14.
von Eye, A., Spiel, C., & Wood, P. K. (1996). Configural frequency analysis in applied psychological research. Applied
Psychol-ogy: An International Review, 45(4), 301–352.
Zapf, W. (1984). Individuelle Wohlfahrt: Lebensbedingungen und Wahrgenommene Lebensqualität. In W. Glatzer & W. Zapf (Eds.), Lebensqualität in der bundesrepublik (pp. 13–26). Frankfurt a. M. – New York: Campus. ([Individual welfare: living conditions and perceived quality-of-life.])