CHARACTERIZATION OF INTERACTION
BETWEEN HUMIC ACIDS AND
BUCKMINSTERFULLERENE USING
FLUORESCENCE SPECTROSCOPY
Linda Ansone
Maris Klavins
Department of Environmental Science,
University of Latvia, Latvia
ABSTRACT
The interaction between buckminsterfullerene C60 and humic acids (HA) of different origins
was compared using fluorescence spectroscopy as a function of pH, humic acid concentration, ionic strength. Binding constants between fullerene and humic acids were calculated. . It can be suggested that the complexation was driven by hydrophobic interactions depending on the properties of the interacting compounds. Hydrophobic interaction model as indicated by linear Stern-Volmer plots and high Kd values is characterizing the interaction between
buckminsterfullerene C60 and humic acids The results of this study support the development
of an understanding of the fate of nanomaterials in the environment as well as the development of analytical methods for nanomaterials in waters and wastewater treatment approaches.
KEYWORDS
Humic acid, Fluorescence spectroscopy, Fullerene C60, Binding
1 INTRODUCTION
The growth of nanotechnology applications requires environmental impact assessment of elaborated nanomaterials to reduce environmental risks in case of their releases and possible pollution. Buckminsterfullerene C60 is an example of carbon containing nanomaterials with
diversity of potential applications [1, 2], but also possible environmental and health effects [3, 4]. Poor solubility of C60 in natural waters is a major factor controlling environmental
transport and biological interactions. However in several studies toxic impacts on living organisms has been found related to necrotic and apoptic cellular damage, impacts on fish embryos [5], but also other types of the toxic action might be identified [6]. The first phase of the action on living organisms in the aquatic environment could be the action of nanoparticles, carbon nanomaterials and also C60 with natural organic matter – humic
substances [7, 8].
Humic substances in surface waters have a key role in terrestrial and aquatic biogeochemistry [9]. Humic substances (HS) are the most widely found naturally occurring organic substances [10]. Humic substances are a general category of naturally occurring, biogenic, heterogeneous organic substances that can generally be characterized as being yellow to black in color, of
high molecular weight and refractory. Humic substances can be divided in three fractions: a) humin is the fraction of humic substances that is not soluble in water at any pH; b) humic acid (HA) is the fraction of humic substances that is not soluble in water under acidic conditions (below pH 2), but becomes soluble at greater pH; c) fulvic acid is the fraction of humic substances that is soluble under all pH conditions [10]. Humic substances influence mineral weathering, nutrient cycling, aggregation and photochemical reactions in waters and they are a substrate for bacterial growth in hydroecosystems, control light absorption [11- 14].
The interaction of humic substances with xenobiotics may modify the uptake and toxicity of these compounds, and affect the fate of pollutants in the environment [15,16].
It is found that aquatic humic substances (HA) can solubilise fullerene C60 and their apparent
water solubility in presence of HAs can be ~ 500 times higher than in pure water. A significant stage in the solubilisation process plays the adsorption of C60 on humic substances
and this process might influence the behaviour of nanoparticles in the environment [17]. To study interaction between humic substances and buckminsterfullerenes high performance liquid chromatography on a humic acid stationary phase has been suggested [18], but also dynamic light scattering has been used [19]. However, as a tool to study complex formations with humic substances, a fluorescence spectroscopic method (fluorescence quenching due to complex formation) has found widespread application [16, 20]. This method has an advantage in that it is a simple, quick and reliable method avoiding the complicated separation of the complex from individual substances [21]. The aim of the present study is to analyse the complex formation between humic substances and fullerene C60, the impact of environmental
factors and properties of humic substances.
2 MATERIALS AND METHODS
Analytical quality reagents were used without further purification. All chemicals used in this study were of analytical quality. For the preparation of solutions, high purity water Millipore Elix 3 (Millipore Co.) 10 – 15 MΩ/cm was used throughout. The fullerene was purchased from TCI Europe nv Belgium. Humic acids from Gagu bog (Latvia) peat were extracted and purified using procedures recommended by the International Humic Substances Society (IHSS) [22]. Humic acids from waters of the River Daugava (Latvia) were obtained as suggested by Thurman and Malcolm [23]. Reference Humic acids were purchased from Sigma-Aldrich Co (Aldrich HA) and the International Humic Substances Society (Leonardite HA). The properties of the studied humic substances are reported in Table 1.
Solution of Aldrich HA was prepared by dissolving necessary amount of HA in water, however Leonardite, Gagu and Daugava HA were dissolved in 0.1 M NaOH and then diluted to the necessary concentration. Aliquots of the stock solutions of HS and fullerene were mixed 1:1. Final concentration of HA was 5 mg/L, but final concentrations of fullerene were 5, 4, 3, 2, 1, 0.5 and 0.1 mg/L. The solution of HS and fullerene was poured into a quartz cell. The fluorescence spectra were obtained on a spectrofluorometer Perkin Elmer LS55 at room temperature (25˚C). The fluorescence emission spectra results were recorded at a speed of 500 nm/min, at a excitation 350 nm, 8 nm (Ex) and 8nm (Em) slit widths.
Table 1 Composition and characteristics of the humic acids used in this study Aldrich
HA Leonardite HA Daugava HA Gagu HA Elemental analysis, % C H N O 60.70 3.70 1.50 34.10 63.81 3.70 1.23 31.27 51.42 4.48 0.97 40.21 54.32 5.03 2.36 36.78 Functional analysis COOH, mEq/g Total acidity, mEq/g
2.15 3.32 3.16 5.77 4.34 5.39 4.15 5.63 O/C 0.65 0.37 0.59 0.51 H/C 1.13 0.69 1.04 1.10 E4/E6 4.51 3.65 8.97 5.84
Fullerene solutions were made as previously described [24] in dimethyl sulfoxide because of its poor solubility in water. Stock solution concentration of fullerene was 10 mg/L.
Influence of pH on interactions of HA-fullerene. Aldrich HA was dissolved in water, and Leonardite HA was dissolved in 0.1 N NaOH(final concentration of HA was 5 mg/L) and mixed with the stock solution of fullerene to reach a final concentration of fullerene (5 mg/L). pH values were adjusted to fixed values from pH 3.09 to pH 8.98 with 0.1 N HCl and 0.1 N NaOH. Conditions for fluorescence analyses were as previously mentioned.
Influence of ionic strength on interactions of HA–fullerene. Binding sites of HS were investigated using a solution of HA, fullerene and NaNO3 so that the concentrations of NaNO3
were 1 mol/L, 0.75 mol/L, 0.5 mol/L, 0.25 mol/L, 0.1 mol/L and 0.05 mol/L, while the final concentrations of HA was 5 mg/L and the fullerene was also 5 mg/L. Solutions were well mixed and fluorescence emission spectra were then recorded.
3 RESULTS AND DISCUSSION
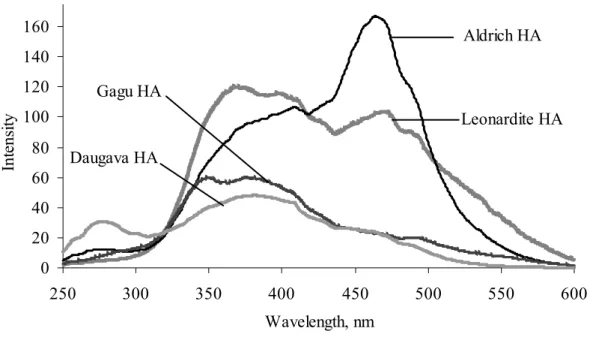
The synchronous-scan fluorescence excitation emission spectra (SSFS) of humic substances are shown in Figure 1 and they differ significantly depending on the origin of the humic acids: spectra of highly humified HAs (IHSS reference humic acids: Leonardite HA, the industrially produced Aldrich HA, peat HA and aquatic HA) were characterized by two major fluorescence peaks. Aquatic humic acid isolated from water of the River Daugava was characterized by one peak (~ 375 nm), but peat humic acid (isolated from Gagu sphagnum bog peat) was characterized by two peaks (~ 345 and 375 nm). Synchronous scan spectra of humic substances isolated from highly humified organic material (leonardite, coal) had an intensive fluorescence peak ~ 475 nm that was determined by the presence of conjugated
unsaturated bond systems bearing carbonyl and carboxyl groups (substituting aromatic core structures), but its intensity differed with respect to aromaticity of the humic acid selected [25]. 0 20 40 60 80 100 120 140 160 250 300 350 400 450 500 550 600 Wavelength, nm In te ns ity . Aldrich HA Leonardite HA Gagu HA Daugava HA
Figure 1. Fluorescence synchronous spectra of humic acids used in the study (γHA = 25
mg/L, pH 7). 0 100 200 300 400 500 600 700 800 370 420 470 520 570 Wavelength, nm In te ns ity . Daugava HA Leonardite HA Aldrich HA Gagu HA
Figure 2. Fluorescence emission spectra of humic acids used in the study (γHA = 5 mg/L,
0 50 100 150 200 250 380 430 480 530 580 Wavelength, nm In te ns ity .
Figure 3. Fluorescence emission spectra of fullerene (γC60 = 5 mg/L, excitation 350 nm). Fluorescence emission spectra of studied humic acids are shown in Figure 2. However in comparison to SSFS emission spectra does not show great differences - their main differences are intensity and wavelengths where is located fluorescence maxima of each humic substance. This may be attributed to the different modifications of the fluorophoric structures in humic molecules.
Fluorescence emission spectra of fullerene C60 (see Figure 3) is similar to that of humic
substances, but comparatively intensity of fullerene emission spectra is lower and also fluorescence maxima peaks were slightly shifted towards the shorter wavelengths.
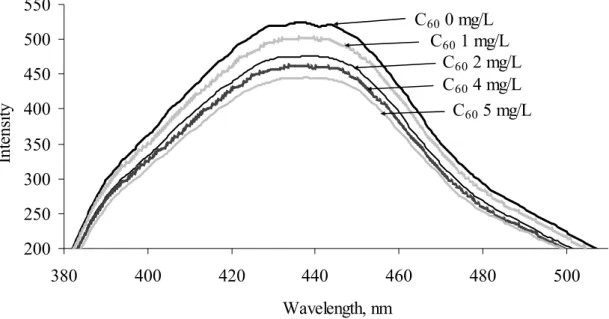
The fluorescence emission spectra of the studied humic acid in the presence and absence of fullerene demonstrated quenching of the fluorescence peak ~ 440 nm, associated with the presence of aromatic structures in humic molecules (see Figure 4). Thus, the fluorescence quenching methodology in our study differs from the approach used to study binding between humic substances and polyaromatic hydrocarbons [15]. As far as this case is concerned, the fluorophore structures in the humic molecules were quenched and the fullerene was the quencher. In this respect the interaction between humic acids is similar to that with metal ions [26] and Carbamazepine [20] and such an approach supports the interaction analysis between humic substances and a large number of substances of interest. The fluorescence intensities of peaks at ~ 440 nm exhibited a successive decrease as the concentrations of the fullerene increased (see Figure 4).
200 250 300 350 400 450 500 550 380 400 420 440 460 480 500 Wavelength, nm In te ns ity . C60 0 mg/L C60 5 mg/L C60 4 mg/L C60 2 mg/L C60 1 mg/L
Figure 4. Fluorescence emission spectra of Gagu HA in the absence and presence of fullerene (γHA = 5 mg/L).
The intensity of the fluorescence quenching is supposed to be proportional to the concentration of the formed humic substance – substance of interest complex according to the Stern-Volmer equation [27]. The fluorescence of the humic acids quenching mechanism by fullerene is considered in the 1:1 interaction model.
The binding constants are obtained by steady-state fluorescence quenching measurements and are given as a slope in the Stern-Volmer plot. The interaction between humic substances and fullerene (C60) can be described as follows:
C60 + HA ↔ C60-HA (1)
With the corresponding binding constant Kb:
] ][ [ ] [ 60 60 HA C HA C Kb = − (2)
The total concentration of the humic acid HAt can be expressed as a sum of free HAf and
bound to humics HAb:
HAt = HAf + HAb (3)
By substituting Eq (2) into Eq (3) we obtain:
] [ 1 K C60 HA HA b f t = + (5)
As far as fluorescence intensity ratio of the initial substance and fluorescence in the presence of quencher, I0/I is proportional to HAt/HAf then Eq (5) can be modified to:
] [ 1 I I 60 0 K C b + = (6)
However, for practical application the equilibrium concentration of fullerene [C60] can be
replaced by the total concentration CC60 as the concentrations of the C60 bound to humic
substances under the experimental concentrations were much lower than the concentrations of the humic substances:
60 0 1 I I C bC K + = (7)
And thus the binding constant can be calculated:
60 0 1 I I C b C K − = (8)
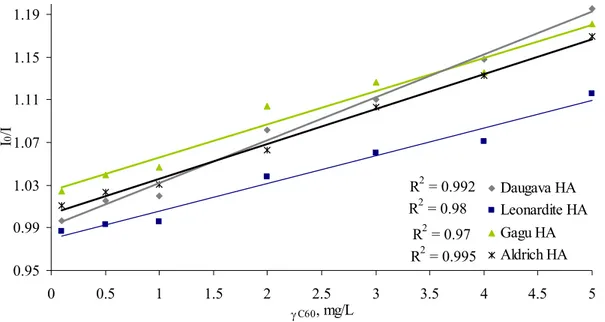
The character of the relationships from modified Stern-Volmer plots (see Figure 5) offer strong support for the 1:1 complex (r2 > 0.97).
Quenching may occur by a wide range of mechanisms as either static or dynamic quenching. Dynamic quenching is a process where the fluorophore and the quencher come into contact during the lifetime of excited state and involves energy transfer, while static quenching is a process where non-fluorescent complex of the ground state fluorophore are formed. For monodisperse systems fluorescence quenching data have a linear dependence when presented as a Stern-Volmer plot. By plotting I0/I against concentration of quencher and deviations from
linearity carry information on the nature of the quenching process and fluorophore – quencher interaction [28]. If the linear Stern-Volmer plot is indicative of a single class of fluorophores with equal accessibility to the quencher, then a combination of dynamic and static quenching typically produces nonlinear Stern-Volmer plots [29]. Therefore it is very important reason to explore the linearity of Stern-Volmer plots; it is an excellent tool to understand organic matter interactions with fullerene nanoparticles. Fluorescence quenching of humic acid by fullerene was described by linear Stern-Volmer plots (see Figure 5), therefore it is possible that there is only one quenching process, on a base of HA-fullerene interaction. This quenching most likely involves one - static or dynamic quenching mechanism. In comparison to interaction of other nanoparticles (for example iron nanoparticles) and humic substances, Stern – Volmer plots is non-linear – indicating more than one quenching process [28], but interaction between humic substances – pyrene and its derivatives shows linear Stern-Volmer plots [16] as well as interaction between phenanthrene and humic substances, which also suggest that either static and dynamic fluorescence quenching mechanism dominate [30]. However interaction
between fullerene (C60) and cryptophanes A and E shows linear Stern-Volmer plots and
similar to our study fluorescence of the studied substance is quenched by fullerene. It is suggested that fullerene may interact with natural organic matter due hydrophobic interaction model [31, 32]. R2 = 0.97 R2 = 0.992 R2 = 0.995 R2 = 0.98 0.95 0.99 1.03 1.07 1.11 1.15 1.19 0 0.5 1 1.5 2 2.5 3 3.5 4 4.5 5 γC60, mg/L I 0 /I Daugava HA Leonardite HA Gagu HA Aldrich HA
Figure 5. Stern-Volmer plots: the ratio of I0/I of HA–C60 as a function of γC60 (γHA = 5
mg/L.
The calculated log Kb, values for different humic acids and fullerene are shown in Figure 6.
2.0 2.5 3.0 3.5 4.0 4.5
Daugava HA Leonardite HA Gagu HA Aldrich HA
log
K
Figure 6. Stern-Volmer binding constants (Kb, L/mol) between the studied humic
Log K ranged from 4.11 to 5.25 L/mol for the studied humic substances and fullerene. The observed log Kb values for the interaction between fullerene and studied humic acids was
similar with the value found in a previous study (log Kb = 3.85 – 4.82 L/mol) using soil humic
acid and polycyclic aromatic compounds [15] and also interaction between fullerene and cryptophanes shows log K values from 4.93 to 5.93 L/mol [31]. Strong binding was found in the case of the interaction between Gagu HA and fullerene. The lower logK value was for the interaction between fullerene (γC60 = 4 mg/L) and Leonardite HA (γHA = 5 mg/L) log Kb =
4.11.
To understand the likely fate and behavior of nanoparticles in environment it is important to understand their interaction with natural environment components under a variety of physicochemical conditions, for example pH, a type and concentration of natural organic macromolecules. It is suggested that the aggregate size increases with increasing humic acid concentration and pH. It could have one or more reasons, for example increased particle aggregation, increased humic acid adsorption, because of the increase of surface coating thickness, changing humic acid conformation, additional formation of nanoparticle layers on the existing particles by further hydrolysis with the increase in pH [8]. It also could be related to pH based chemical changes, leading to electronic changes in humic acid molecules, full deprotonation of carboxylic and other functional groups leading to charge repulsion and change in the conformation of the humic acid as pH increases [28]. The pH will affect dissociation of functional groups and develop differences in amount of negative charge on the humic substances. At lower pH values there is less dissociation, at neutral pH humic substances reduce electrostatic forces by aligning hydrophobic structures together in a core and aligning charged functional groups in the molecule towards solvating water molecules. On higher pH, there will be more dissociation but it will be energetically more favourable for the hydrophobic groups to align on a surface [33].
R2 = 0.96 R2 = 0.77 1.15 1.25 1.35 1.45 1.55 1.65 1.75 1.85 3 4 5 6 7 8 9 pH I0 /I Leonardite Aldrich
Figure 7. Influence of pH on fluorescence quenching of humic acids by fullerene (γHA = 5 mg/L, γC60 = 5 mg/L).
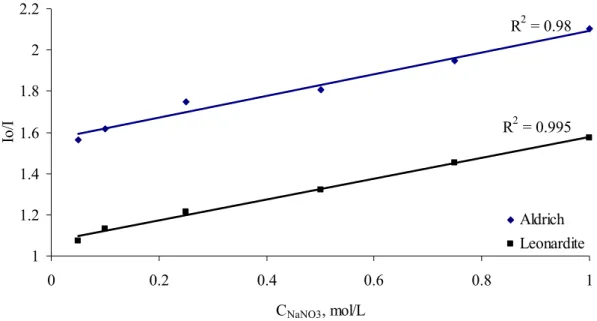
R2 = 0.98 R2 = 0.995 1 1.2 1.4 1.6 1.8 2 2.2 0 0.2 0.4 0.6 0.8 1 CNaNO3, mol/L Io /I Aldrich Leonardite
Figure 8. Influence of ionic strength on fluorescence quenching by fullerene. γHA =
5 mg/L, γC60 = 5 mg/L.
Obviously fluorescence quenching at a constant nanoparticle and constant humic acid concentration is highly pH dependent (see Figure 7). It could be suggested that humic-C60
interaction is influenced by the conformation changes of humic substances.
Figure 8 shows that with increasing ionic strength the fluorescence intensity of HA – C60
complex significantly decreased. As mentioned earlier pH affects particle size and also ionic strength can alter size of particles and thus the stability of the formed complexes as it is found on example of humic – polyaromatics interaction [33]. This may indicate the preferential binding of highly hydrophobic fullerene (C60) to more hydrophobic structures, with
consecutive changes in the conformation of humic macromolecules.
4 CONCLUSIONS
C60 buckminsterfullerene causes quenching of the fluorescence signal of humic substances
and the intensity of the quenching is proportional to C60 concentration. Thus the ratio I0/I can
be used to estimate the complex forming process as known in metal-humic interaction studies. We have determined the binding constants between fullerene and studied humic acids, using fluorescence quenching technique. Obtained values are similar to that determined in other studies between humic substances and polycyclic aromatic hydrocarbons. Our findings suggest that a hydrophobic interaction plays a dominant role in the complex formation between humic acids and fullerene C60.
The importance of the hydrophobic attraction between humic acids and fullerene C60 was also
confirmed by a salt effect and pH dependence of the fluorescence quenching effect. The hydrophobic interaction between fullerene C60 and HA was weakened at low pH, resulting in
a decrease in the binding constants. The results of this study support the development of an understanding of the fate of nanomaterials in the environment as well as the development of analytical methods for nanomaterials in waters and wastewater treatment approaches.
REFERENCES
[1] Bogdanov A.A., Deininger D. and Dyuzhev G.A., 2000. Development prospects of the commercial production of fullerenes. Techn. Physics 45, 521-527.
[2] Masciangioli T. and Zhang W.X., 2003. Environmental technologies at the nanoscale. Environ. Sci. Technol. 37, 102A-108A.
[3] Klaine S.J., Alvarez P.J.J., Batley G.E., Fernandes T.F., Handy R.D., Lyon D.Y., Mahendra S., McLaughlin M.J. and Lead J.R., 2008. Nanomaterials in the environment: bahaviour, fate, bioavailability and effects. Environ. Toxicol. Chem. 27 (9), 1825-1851.
[4] Velzeboer I., Hendriks A.J., Ragas A.M.J. and Meent D., 2008. Aquatic ecotoxicity tests of some nanomaterials. Environ. Toxicol. Chem. 27 (9), 1942-1947.
[5] Usenko C.Y., Harper S.L. and Tanguay R.L., 2007. In vivo evaluation of carbon fullerene toxicity using embryonic zebrafish. Carbon 45, 1891-1898.
[6] Oberdorster G., Oberdorster E. and Oberdorster J., 2005. Nanotoxicology: an emerging discipline evolving from studies of ultrafine particles. Environ. Health Perspectives 113 (7), 823-839.
[7] Illes E. and Tombacz E., 2006. The effect of humic acid adsorption on pH-dependent surface charging and aggregation of magnetite nanoparticles. J.Colloid Interface Sci. 295, 115-123.
[8] Baalousha M., Manciulea A., Comberland S., Kendall K. and Lead J.R., 2008. Aggregation and surface properties of iron oxide nanoparticles: influence of pH and natural organic matter. Environ. Toxicol. Chem. 27 (9), 1875-1882.
[9] Neff J.C. and Asner G.P., 2001. Dissolved organic carbon in terrestrial ecosystems: synthesis and a model. Ecosystems 4 (1), 29-48.
[10] Stevenson F.J., 1994. Humus chemistry: Genesis, composition, reactions. 2nd ed. N.Y.:
Wiley, 496 pp.
[11] Depetris P.J. and Kempe S., 1993. Carbon dynamics and sources in the Parana River. Limnology and Oceanography 38 (2), 382–395.
[12] Pettine M., Patrolecco L., Camusso M. and Crescenzio S., 1998. Transport of carbon and nitrogen to the Northern Adriatic Sea by the Po River. Estuarine, Coastal and Shelf Science 46, 127–142.
[13] Wasterhoff P. and Anning D., 2000. Concentrations and characteristics of organic carbon in surface water in Arizona: influence of urbanization. Journal of Hydrology 236, 202-222. [14] Evans C.D., Monteith D.T. and Cooper D.M., 2005. Long-term increases in surface water dissolved organic carbon: observations, possible causes and environmental impacts. Environmental Pollution 137, 55–71.
[15] Karthikeyan K.G. and Chorover J., 2002. Humic acid complexation of basic and neutral polycyclic aromatic compounds. Chemosphere 48, 955-964.
[16] Nakashima K., Maki M., Ishikawa T., Yoshikawa T., Gong Y.-K. and Miyajima T., 2007. Fluorescence studies on binding of pyrene and its derivatives to humic acid. Spectrochim. Acta, Pt A 67, 930-935.
[17] Terashima M. and Nagao S., 2007. Solubilization of [60] fullerene in water by aquatic humic substances. Chem. Lett. 36 (2), 302-303.
[18] Casadei N., Thomassin M., Guillaume Y.C. and Andre C., 2007. A humic acid stationary phase for high performance liquid chromatography separation of buckminsterfullerenes: theoretical and practical aspects. Anal. Chim. Acta. 588, 268-273.
[19] Chen K.L. and Elimelech M., 2007. Influence of humic acid on the aggregation kinetics of fullerene (C60) nanoparticles in monovalent and divalent electrolyte solutions. J. Colloid
Interface Sci. 309, 126-134.
[20] Bai Y., Wu F., Liu C., Guo C., Fu P., Li W. and Xing B., 2008. Interaction between carbamazepine and humic substances: a fluorescence spectroscopy study. Environ. Toxicol. Chem. 27 (1), 95-102.
[21] Peuravuori J., 2001. Partition coefficients of pyrene to lake aquatic humic matter determined by fluorescence quenching and solubility enhancement. Anal. Chim. Acta 429 (1), 65-73.
[22] Tan, K.H., 2005. Soil Sampling, Preparation, and Analysis - Second Ed., N.Y.: Taylor & Francis, 326 pp.
[23] Thurman E.M. and Malcolm R.L., 1981. Preparative isolation of aquatic humic substances. Environ. Sci. Technol. 15, 463-466.
[24] Chen Z., Westerhoff P. and Herckes P., 2008. Quantification of C60 fullerene
concentrations in water. Environ. Toxicol. Chem. 27 (9), 1852-1859.
[25] Peuravuori J., Koivikko R. and Pihlaja K., 2002. Characterization, differentiation and classification of aquatic humic matter separated with different sorbents: synchronous scanning fluorescence spectroscopy. Water Research 36, 4552-4562.
[26] Alberts J.J. and Takacs M., 2004. Total luminescence spectra of IHSS standard and reference fulvic acids, humic acids and natural organic matter: comparison of aquatic and terrestrial source terms. Org. Geochem. 35, 243 – 256.
[27] Gauthier T.D., Shane E.C., Guerlayn W.F., Seilz W.R. andGrant C.L., 1986. Fluorescence quenching method for determining equilibrium constants for polycyclic aromatic hydrocarbons binding to dissolved humic materials. Environ. Sci. Technol. 20, 1162-1166.
[28] Manciulea A., Baker A. and Lead J.R., 2009. A fluorescence quenching study of the interaction of Suwannee river fulvic acid with iron oxide nanoparticles. Chemosphere 76, 1023-1027.
[29] Gadad P., Lei H. and Nanny M.A., 2007. Characterization of noncovalent interactions between 6-propionyl-dimethylaminonapthalene (PRODAN) and dissolved fulvic and humic acids. Water. Res. 41, 4488-4496.
[30] Lee C.L., Kuo L.J., Wang H.L. and Hsieh P.C., 2003. Effects of ionic strength on the binding of phenanthrene and pyrene to humic substances: three stage variation model. Water Research 37, 4250 - 4258.
[31] Zhang C., Shen W., Fan R., Zhang G., Shangguan L., Chao J., Shuang S., Dong C. and Choi M.M.F., 2009. Study of the contact charge transfer behavior between cryptophanes (A and E) and fullerene by absorption, fluorescence and 1H NMR spectroscopy. Anal. Chim.
Acta 650, 118-123.
[32] Isaacson C. W., Kleber M. and Field J.A., 2009. Quantitative Analysis of Fullerene Nanomaterials in Environmental Systems: A Critical Review. Environ. Sci. Technol. 43 (17), 6463–6474.
[33] Wilson M.A., Tran N.H., Milev A.S., Kannangara G.S.K., Volk H. and Lu M.G.C., 2008. Nanomaterials in soils. Geoderma 146, 291 – 302.