Acknowledgements
This Master’s Thesis was conducted during the fall 2012 as the final part after four and a half years of studies at the program Master of Science in Mechanical Engineering at Lund University, Faculty of Engineering in Lund, Sweden.
The case company, Faiveley Transport Rail Technologies India Ltd (FTRTIL) awareness of the poor productivity made them realize the need to initiate a project in order to get a full analyse of their internal production system for brakes assembly. The thesis report is the results of the project work carried out at the company in Hosur, India during a period of 20 weeks (corresponding to 30 credits). It has truly been a big challenge but undoubtedly given the author important experience that will be useful for a future career. During the thesis work the author has been in contact with a lot of people within the organization, that one or another way have contributed to the thesis with their experience, knowledge, information and valuable inputs. Without these people would not the work proceed in the same extent.
First of all the author wants to thank Dinesh Kumar, PED supervisor at FTRTIL for his support, advices, time and effort to make this project successful. Secondly, C. Rajasekaran and R. Saravanan, production engineers that have contributed with the data collection and translations during interviews. A special thank should be directed to Bertil I Nilsson Faculty of Engineering, Lund University for his continuous support and guidance throughout the thesis. Finally the author wants to thank all the involved operators for always being willing to collaborate and SRK Patra, human resources manager who gave the author the opportunity and invitation to Faiveley in India.
Lund, February, 2013
III
Abstract
Title: Defining Improvement Areas & Reducing the Waste - With Lean
production philosophy & tools
Author: Frédéric Åslund
Supervisors: Dinesh Kumar, Sr Manager PED Faiveley Transport Rail Technologies
India Ltd
Bertil I Nilsson Adjunct Assistant Professor, Department of Industrial Management and Logistics, Lund University
Background: FTRTIL is rapidly expanding on the Indian market after initiatives by the
Indian government to increase the number of rolling trains. FTRTIL is today experiencing a greater demand for their products. Meanwhile are they also planning to expand their product range with new introductions. After trying to respond to the prevailing market demand for the E70 brake panel without any success made FTRTIL realize that there are some serious efficiency problems within their production system
Research questions:
• Where are the bottlenecks and largest gaps between the current situation and a future state where improvements can be implemented to meet the customer demand?
• How can these bottlenecks/gaps be eliminated or reduced? • How should improvements proposals be implemented?
Deliverables: The project contains a full view and analyses of the current state map
followed by a future state map with recommendations on improvement areas. Proposals were implemented during the project’s work which has formed a new work pattern at FTRTIL.
Methodology: The thesis was conducted as an explanatory case study with qualitative
data gathered through observations, interviews and archival data. The need of a holistic approach made Lean production theories appropriate to use as a frame of reference. The theory was both selected during the literature review as well as it evolved during the empirical study. FTRTL’s “current state” were visualized and described out of a value stream map (VSM). The VSM later worked as a foundation when analysing FTRTIL’s production system against the frame of reference in order to identify the improvement areas. Proposals on how the wastes could be eliminated / reduced were then developed into practical solutions. The last part of the thesis was then conducted as an action
IV
research where the author participated in the implementation process together with the employees.
Delimitations: The Master’s Thesis is limited to the door-to-door processes, mainly
focused on the value stream between the warehouse and the shipping. The analyses are primarily focused on the processes involving material handling & supply, assembling and testing.
Conclusions: The largest gap according to a Lean flow, when comparing the current
state with a possible future state were identified to be the batch assembly policies together with the material supply. The key focus has thereby been to move from batch production to single piece flow together with an efficient material supply. FTRTIL can today benefit from an increased productivity by 50%. With the remaining changes and further studies it is not impossible for FTRTIL to improve the productivity even more and reach the objective of 20 panels a month and be able to fully satisfy the market demand. With these large steps in increased productivity there is no doubt about the effectiveness in practising Lean. Lean production can really make a difference and take companies to new heights.
Keywords: Lean, Material handling, Value Stream Mapping, gap, waste reduction,
material supply, visualization, flexibility, quick changeover, assembly line, kitting, Kanban and work organization
V
Table of content
1 Introduction ... 1
1.1 General situation, Recognised gaps & Problems ... 1
1.2 Project background ... 1
1.3 The case company ... 2
1.3.1 Faiveley Transport S.A. ... 2
1.3.2 Faiveley Transport Rail Technologies India Ltd ... 2
1.4 Problem description ... 3
1.5 Delimitations of the problem ... 3
1.6 Purpose & Objective ... 4
1.7 Project deliverables... 4
1.8 Target audience... 4
2
Methodology ... 5
2.1 Overview of the work process ... 5
2.2 Scientific strategy ... 6
2.3 Research method ... 6
2.4 Data collection ... 7
2.4.1 Methods ... 7
2.5 Qualitative and quantitative data ... 9
2.5.1 Quantitative ... 10 2.5.2 Qualitative ... 10 2.5.3 Chosen approach ... 10 2.6 information sources ... 10 2.6.1 Triangulation ... 11 2.6.4 Validity ... 11 2.6.3 Reliability ... 11
3
Frame of reference ... 12
3.1 Lean production ... 123.1.1The three M: Muda, Muri & Mura ... 13
3.1.2 The seven wastes ... 13
3.1.3 Kaizen & Kaikaku ... 14
3.1.4 Genchi Genbustsu ... 15
3.1.5 Just in time ... 15
3.1.6 One Piece Flow ... 15
3.1.7 Takt time ... 16
3.1.8 Pull & Push ... 16
VI
3.1.10 5S ... 17
3.1.11 Visual control ... 18
3.1.12 Pacemaker ... 18
3.1.13 Lean layout, Work stations & Cells ... 19
3.1.14 Material handling ... 19
3.1.15 Kanban ... 21
3.1.16 5 Why ... 22
3.2 Value Stream Mapping ... 22
3.3 The Deming cycle ... 23
3.4 Work organization ... 23
4
Current state ... 26
4.1 Value Stream Mapping ... 26
4.2 Customer order to manufacturing ... 26
4.3 Plant overview ... 26
4.4 Assembly System... 27
4.4.1 Pre-assembly & Work stations ... 27
4.4.2 Assembly line ... 28
4.4.3 Inspection ... 29
4.5 Warehousing ... 29
4.5.1 Part classification ... 30
4.6 Material handling & Supply ... 31
4.6.1 Pre-assembly & Work stations ... 31
4.6.2 Assembly line ... 31
4.7 Order dispatch ... 32
4.8 Takt & Line balance ... 33
4.9 Visual control... 33
4.10 Work organization ... 34
5
Current State Analysis... 37
5.1 Value Stream Mapping ... 37
5.2 Assembly system & Material supply ... 37
5.2.1 Assembly line ... 37
5.2.2 Pre-assembly & Work stations ... 39
5.3 Takt & Line balance ... 41
5.4 Warehousing ... 43
5.5 Order dispatch ... 43
5.6 Visual control... 44
5.7 Work organization ... 44
VII
6
Proposals & Future state ... 48
6.1 Value Stream Mapping ... 48
6.2 Assembly system & Material supply ... 48
6.2.1 Assembly line ... 48
6.2.2 Pre- assembly & Work stations ... 51
6.2.3 Further requirements to achieve One Piece Flow ... 53
6.3 Takt & Line balance ... 53
6.4 Warehousing ... 55
6.5 Visual control... 56
6.6 Putting it all together ... 57
7
Implementations & Results ... 58
7.1 Preparing for the Change ... 58
7.2 The implementations ... 58
7.2.1 Material racks on wheels ... 59
7.2.2 2 Bin supermarket & Service trolleys ... 59
7.2.3 5S ... 60 7.2.4 SMED ... 61 7.2.5 Visual control ... 61 7.3 Implementation status ... 61 7.4 Results ... 63
8
Conclusions ... 65
9 Reflections ... 68
9.1 Further studies ... 689.2 Credibility of the thesis ... 69
9.3 Author’s reflections about the project ... 69
10 References ... 70
Written sources ... 70
VIII
Appendix 1: History ...I
Appendix 2: Faiveley Transport products ... II
Appendix 3: VSM current state FTRTIL ... V
Appendix 4: E70 assembly times, work station divided ... VI
Appendix 5: VSM future state FTRTIL ... IX
Appendix 6: C-class items to be stored in the supermarket ... X
Appendix 7: E70 assembly line improvement plan ... XIII
Appendix 8: Survey about implementations at FTRTIL ... XV
1
1 Introduction
The opening chapter begins with a brief presentation of the background of the thesis. It then continues with an introduction to the company, both the group as a whole and Faiveley Transport Rail Technologies India Ltd (FTRTIL). This follows with a presentation of the problem description with a clarification of the purpose and objective. Finally, are the project’s deliverables, delimitations and target audience set.
1.1 General situation, Recognised gaps & Problems
The markets in emerging countries have a tendency to grow very fast and in some cases suddenly explode. These markets have today became the source of most new customers and thus led to companies being able to earn major revenues from these markets. A problem is that the capacity and capabilities is not always developed and invested in, as in the same speed the market requires, leading to an overall poor productivity.
Some companies operating at these markets are today facing their biggest challenge as deliverability. If managing this problem by delivering a product that the customer wants, in time and in the right quantity, there is a good opportunity for the company to grow. Meanwhile the tougher competition have made companies realize the need to utilize their facilities better in order to avoid waste of different types and thus improve productivity. One way, used by many companies around the world, is Lean, introduced 1989 through the paper “The Machine That Changed the World”. The simplest definition of Lean is “to do more with less” which further can be translated to do good things with less resources such as material, energy, pollutions to achieve the ultimate sustainability. The principles working with in a Lean organization can be catheterized into four sections: philosophy, process, people and partners and problem solving. Japanese auto firms have today shown that working according to Lean can give competitive advantages which cannot be ignored.
1.2 Project background
Nobody could have missed the fact that India, today, is one of the fastest growing economies in the world1. The demand for Indian products and services are now higher than ever. The higher demand also sets greater requirements on the Indian infrastructure which today is under a high pressure, both from freight and public transports. Shipping in India can basically be done in four different ways; by flight, trucks, vessels or trains. The last one mentioned is of course the most economical and environmental for national long distance transports.
The profitable organization IR is owned by the government. It is the largest rail network in Asia and the world's second largest under one management2. IR runs today six manufacturing units around India. Each of these plants has in one way or another close cooperation with Faiveley Transport which supplies to most of the plants with various types of train parts.
Initiatives by the government to increase the number of rolling trains, passenger and freight will result in a higher output in IR’s manufacturing units which in turns leads to a higher demand on products from FTRTIL. For example Chittaranjan Locomotives works (CLW) owned by IR is today phasing
1
http://www.bloomberg.com/news/2010-08-16/india-to-top-china-as-fastest-growing-economy-by-2015-morgan-stanley-says.html
2
2
out its conventional locos to the three phase High Horse Power locos which uses a brake system called E70 from FTRTIL. Further investment is also planned by IR the upcoming five years who is going to invest in opening five new factories for manufacturing of wheels, diesel locomotives, electric locomotives, coaches at Rae Bareilly & Palghat and EMU/DMU coaches at Kancharapara3. FTRTIL has to be able to respond to the existing demand but also to the future upcoming situation in order to maintain its leading position and not lose market share to competitive rivals such as Knorr-Bemse and Wabtec who is also operating on the Indian market.
1.3 The case company
1.3.1 Faiveley Transport S.A.Faiveley Transport, founded in Saint-Ouen France by Louis Faiveley in 1919 is a supplier of equipment and services exclusively to the railway industry throughout the world. The company has a global presence with 50 sites in 25 countries and a total work force of over 5 400 employees. It is listed on the Paris stock exchange and has a market value of around 700 million euros4 with revenue of 914 million euros the business year 2010-20115. The group offers the widest range of products and services on the market and supplies in all the different segments such as light rail vehicle, tramways, metros, regional trains, high-speed trains, freight and locomotive. Supplying in all the segments guarantees stability to the group6. Faiveley Transport’s clients include among others Bombardier, Alstom, Siemens and Ansaldo Construcciones y Auxiliar de Ferrocarriles (CAF).
The core of the company’s strategy is reliability and availability7. Quality, innovation, integration are the three values that support the daily work. It has together formed the organization and led to their strongest competitive advantage that today is the modularity of the products and their presence on all the continents8.
Faiveley Transport first gained its reputation as the inventor of the pantograph in 1919. Since then, the product range has expanded along the way mainly by acquisitions of other suppliers and competitors on the market. The most important ones was the acquisition of the German company Hagenuk in 1995 which made Faiveley Transport become the world leader in HVAC systems (Heat ventilation & Air conditioning) and the acquisitions of the Swedish company SAB WABCO in 2004 (specialist in brake and coupler system) which doubled the size of the group and firmly established its international stature and significance in the market (see Appendix 1). Today is the company a market leader in a numerous of segments and has a huge product portfolio that contains products in the fields of air conditioning, passenger access systems, platform doors and gates, braking systems, couplers, power collectors, passenger information and services (see Appendix 2 ).
1.3.2 Faiveley Transport Rail Technologies India Ltd
Faiveley Transport Rail Technologies India Limited (FTRTIL) has been in the Faiveley group since the acquisition of SAB WABCO in 2004. The group has today two sites strategically placed in India, one in the north, Baddi that supplies to nearby areas and one in the south. The one in the south is situated in Hosur, 40 km from the 3rd biggest city in India called Bangalore. There are 410 employees
3 Internal documents 4
http://in.reuters.com/article/2012/01/04/faiveley-idINDEE8030DW20120104
5 http://www.faiveleytransport.com/ ACTIVITY REPORT 2010-2011 6 Internal documents
7 http://www.faiveleytransport.com/ ACTIVITY REPORT 2010-2011 8
3
in Hosur and their main focus are manufacturing and assembling of two categories of products, HVAC and brake systems. FTRTIL supplies mainly to the Indian market and acquires most of its orders from IR’s (Indian Railways) subsidiaries.
There are, today, plans for new product introductions in the field of HVAC systems, pantographs, doors, automatic and semi permanent couplers9. This due to the growing metro sector in India with projects planned for Bangalore, Mumbai, Hyderabad, Cochin, and Delhi Airport Express. Discussions are also held in India “on a number of mega-projects on diesel and electrical locomotives and regional trains for quite significant quantities”10 says the CEO Thierry Barel. This should boost up the order volumes from particularly the manufacturing unit in Hosur and provide continued growth prospects for the company in the years to come11.
1.4 Problem description
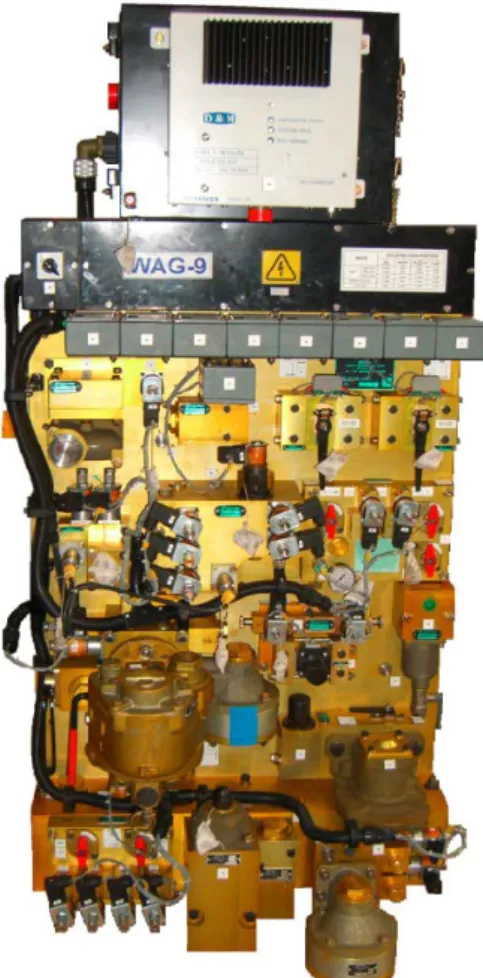
FTRTIL is today struggling to keep up with the customer demand of the E70 brake panel. An output of barely 10 E70 brake panels monthly has made FTRTIL realize that there are some serious efficiency problems within their production system thatneed to be improved. FTRTIL has to make changes to be able to respond to the actual demand of 20 E70 brake panels per month that is prevailing in the market today. Meanwhile it is also important that they can be flexible for varying order quantities as well as an increased demand in the future.
Faiveley’s products are characterized by complex assemblies and large bills of material12 (BOM). The E70 brake panel is no exception with its 1477 different part numbers to be assembled. The lead time for the panel is long and requires a lot of labour intensive work. The work mainly involves pre-, sub-assembling and testing. The unnecessary long lead time is mainly due to the bad flow of material through the work shop, material shortages and the unbalanced work at the assembly line. It makes it hard to link the processes of material and information together in a smooth way without any interruptions. Instead they are manufacturing to a batch policy with a lot of work in progress (WIP) being pushed back and forth between the work stations at the shop floor.
1.5 Delimitations of the problem
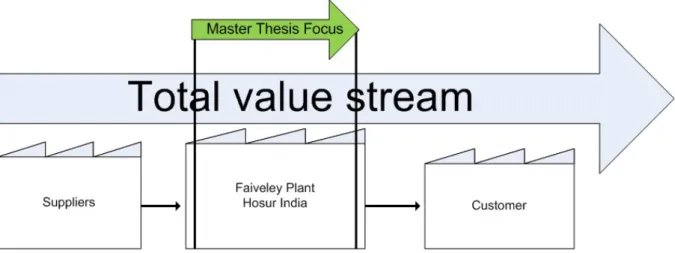
The Master’s Thesis is based on grounded theories, published knowledge and experience. It is limited to the door-to-door processes, mainly focused on the value stream between the warehouse and the shipping. The focus will mostly be on the processes involving material handling, assembling and testing.Problems outside this area will not undergo any deeper analysis, but merely be noted.
9 Internal documents 10 http://in.reuters.com/article/2012/01/04/faiveley-idINDEE8030DW20120104 11 Internal documents 12 http://www.edstechnologies.com/assets/pdf/Customer%20Speak/FaiveleyTransport_VAR.pdf
4
Figure 2 Master’s Thesis focus
1.6 Purpose & Objective
The purpose of the Master’s Thesis is to clarify the current flow with value stream mapping (VSM), analyse the current state so proposals can be developed for a future state with an objective of achieving a takt of 20 panels a month without increased waste and with same resources. During the research the author also has the intention to contribute to the science and theories of Academia by illustrate good manufacturing practice (GMP) or even best practice.
In order to achieve the objective, the thesis should primarily answer the following questions: • Where are the bottlenecks?
• Where are the largest gaps between the current and future state in the production where improvements can be done so that FTRTIL can meet the customer demand?
• How can these gaps be eliminated or reduced? • How should these improvements be implemented?
1.7 Project deliverables
The deliverables of the project will be presented in a detailed report following the structure of a scientific research methodology. It should provide deliverables in the form of a view and analyses of the current state map followed by a future state map with recommendations on improvement areas, both short- and long term together with an implementation plan. Some of the proposals will be implemented during the time of the project and thereby also evaluated and revised. A copy of the finished report will then be handed over and orally presented both at the company and the Department of Industrial Management & Logistics at Faculty of Engineering, Lund University.
1.8 Target audience
The target group for this master thesis is the operations management at FTRTIL, primarily those who´s working with production, logistics, process optimization as well as students in engineering school, secondly the operators at the shop floor that can gain greater insight and understanding of Lean and engineering work.
It can also be seen as a best practice within the organization in order to easily achieve business excellence.
5
2 Methodology
This chapter begins with describing the design of the work process and how the Master’s Thesis was performed. It then continues with the research methodology followed by the methods used for conducting the research.
2.1 Overview of the work process
The main difficulties in case studies are the handling with the interrelatedness of the various elements in the research work.13 The procedure of solving a problem usually involves following steps; defining the problem, observe it closely and gather data, use appropriate theories to arrive at a hypothesis of what might be causing the problem, on these make appropriate changes and finally study the results and standardize the new condition.14 The author considers these as elementary steps in any kind of problem solving. In order to make the work process for this thesis even more complete, it was expanded. A few activities were added in between together with the most used improvement cycle, PDCA (Plan-Do-Check-Act). It formed the research process model which describes the method’s relation to quality assurance of the results in the various phases of the project (see figure 3).
In figure 3, the work process of how the Master´s Thesis was planned and executed during the 20 weeks of work. It all started with a dialogue between the student and FTRTIL that in an early stage had a clear objective with the thesis and what kind of competence and theoretical knowledge they required for the project. The problem description was somehow unclear upon arrival at the company so to be able to choose the right approach and appropriate methods for implementing the project, time was spent on the shop floor observing processes and flows, continuously using the method “5 why”. It was necessary to get a deeper insight to be able to formulate and describe the problem. At the same
13 Dubois & Gadde, 2002 14
Drew, McCallum, Roggenhofer, 2004
6
time was a literature review conducted (see section 2.4.1) which included Lean production theories. In the beginning of the project (plan part in the PDCA cycle) a period of time was engage only for collecting empirics using the data collection methods described later in this chapter. It was during the “plan” part a substantial part of the empirics were collected. After the author gone through it additional data were collected continuously through the project but less intensive. The reason for the continuously ongoing cycle of collecting empirics could be that some details were missing when for example writing the current state chapter, the work led to new insights that required further information for example during the analysis but also the fact that the author sometimes had to verify data (Triangulation, see section 2.6.1) to ensure the quality of the thesis results.
During the writing of the current state chapter, the author tried to be objective and not take any position and instead be as neutral and descriptive as possible of the situation that prevailed then. The current state was then analysed in order to develop the future state. Unlike the current state chapter author took position, and described in detail the problems according to the frame of reference. Based on these problems, the author developed practical proposals to reduce or eliminate the waste. Some of these proposals were later implemented. At the end of the project, the author states his conclusion of the thesis work.
2.2 Scientific strategy
Depending on the purpose of the research, four types of different strategies can be applied.15
• Exploratory- finding out what is happening, seeking new insights and generating ideas and hypotheses for new research.
• Descriptive –presents a complete description of a situation or a phenomenon within its context.
• Explanatory- seeking an explanation of a situation or a problem, mostly but not necessary in the form of a casual relationship.
• Improving- trying to improve a certain aspect of the studied phenomenon.
The project used an explanatory strategy in the beginning while the current state and analysis were conducted. Further in the project when the implementations took place an improvement approach was applied.
2.3 Research method
Due to the complexity of the project and the fact that the project was executed in real world settings at a company with a high degree of realism16 the author chose to conduct the research as a single case study with well-formulated theory. An in-depth case study is the best way of understand the interaction between the studied phenomenon and its context.17 However, one should be aware of case studies sometimes are criticized for its disadvantage of being unable to generalize from18 due to its situation specific form and the fact that researcher been sloppy allowing equivocal evidence on biased views to influence the direction of the findings and conclusions.19
When spending significant amounts of time in a case organization means that the researcher will acquire knowledge and become more aware about the practical world.20 It can enable the author to
15 Runeson & Höst, 2008 16
Ibid.
17 Dubois & Gadde, 2002 18 Runeson & Höst, 2008 19 Dubois & Gadde, 2002 20
7
develop good manufacturing practise or even best practise if all the time considering the logical coherence as a foundation for the analytical generalization21.
In order to achieve the purpose of the thesis an action research had to be conducted further in the project. In contradistinction to a case study which is purely observational is an action research used to influence and change some aspect.22 It allows involvements of the researcher who combines
participative action and critical reflections.23 The action research was closely linked to the
implementation process where the author participated in the change and implemented some of the proposals generated from the analysis.
2.4 Data collection
2.4.1 MethodsA key component to a rigorous case study is the ability to use multiple data collection methods.24 Using multiple sources will also allow the investigator to address a broader range of historical, attitudinal and behavioural issus25 and could thereby improve the reliability. Since the case not are built on statistical inference and instead rely on analytical inference, puts very high demands particularly on the”sampling” procedure.26 Depending on how the data is gathered and which method to use, the data collection techniques can be divided into three levels:27
• First degree is when the researcher is in direct contact with the subjects and collect data in real time. This is for example used in interviews or observations. An advantage with the method is that the researcher can control what data to collect, how to collect it and in what form it is collected.28
• Second degree is when the researcher directly collects raw data without interacting with the subjects during the data collection.29 It has the same advantages as in the first degree. Second degree of data could for example be; interviews or when a video been recorded and after hand observed.
• Third degree is when independent analysis is done on already available or compiled data that were used for another purpose than the research. Third degree data can for example be data from organizational databases. This method will not offer the same control and quality as the other two methods.30
The methods for gathering data in the thesis are described below with a short description of its characteristics and how they were used.
21 Dubois & Gadde, 2002 22
Runeson & Höst, 2008
23 ArlbjØrn, Halldórsson, Jahre & Spens, 2008 24 Ibid.
25 Dubois & Gadde, 2002 26 Ibid. 27 Runeson & Höst, 2008 28 Ibid. 29 Ibid. 30 Ibid.
8
Interviews are often used in case studies and have a significant role.31 It is a highly efficient way to gather rich, empirical data.32 During an interview the researcher asks a series of questions according to the studied subject. Interviews can be performed in three different ways which will be described below where each of them fulfilled their function in this thesis.
• Fully structured interview is when all the questions are prepared in advance and asked in the same order as in the plan.33
• Semi-structured interview is when the questions are planned in advance but no care is taken to the order it is asked. This will add some flexibility to the interview since it will allow for improvisation and exploration of the studied object.34
• Unstructured interview is when the interview questions are formulated as general concerns and interests from the researcher.35
Most of the interviews carried out during the thesis were with managers within production, operators, purchasers and materials handling personnel.
Observations are conducted in order to investigate how a certain task is executed. Observations are particularly useful where there is a deviation between an “official” view of matters and the “real” case.36 Observations are of first- or second degree type of data and can principally be done in two different ways. The researcher can either participate and be seen as a team member or act as an observing participant.
During the research, observations were the key to perform the thesis since it provided a deeper understanding of FTRTIL’s operational system. During the VSM current state the author spent a lot of time at the shop floor observing material flow and how different work tasks were executed and thereby worked as an observing participant. While the author, later in the project during the implementation acted as a participant team member. Also using observations during meetings were necessary to understand the planning process as well as the organizational aspects of FTRTIL. These observations generated new questions which later on were asked during interviews.
Archival data is a third degree type of data. It refers to for example; meeting minutes, documents from various development phases or projects, organizational charts, financial and previous collected measurements in an organization.37
Archival data from the company´s ERP-system (Enterprise Resource Planning) were used during the thesis when information about parts, assembly- instructions and times were needed. If there was any kind of doubt or lack of information regarding the data, the author decided to improve the quality by the use of observations and interviews with responsible persons.
In addition to these traditional forms of data collection the author also used field notes whenever needed to not forget about thoughts and ideas occurring during the days of work.
31 Runeson & Höst, 2008 32 EISENHARDT, GRAEBNER, 2007 33 Runeson & Höst, 2008 34 Ibid. 35 Ibid. 36 Ibid. 37 Ibid.
9 Literature review
A literature review is when the researcher is trying to detect as much relevant literature as possible by identifying, evaluating and interpreting available research, relevant to a particular question, topic area or phenomenon of interest. It can be undertaken to examine to which extent empirical evidence supports theoretical hypotheses.38 Most researchers often start the research with a literature review of some sort.39 The author of this thesis did dough take it one step further. In order to be prepared before entering the industrial environment the author started with a pre-study involving different books and articles in the field of production development that the author together with the tutor had decided in the early stage. The author had an open minded view during the pre-study so a wide range of theories could be explored. It wasn’t until the research questions were raised, the problem description defined and formulated, the author were able to conduct the literature review. The purpose was to find appropriate theories that could match the empirical world.
After initially spent time at the shop floor, the author realized the need of a holistic approach. The project’s delimitations were set rather wide to avoid the risk of sub-optimizing processes. The need of theories and methods that could bring the deep rooted problems to surface by analyzing the impacts from material/information flow and their interaction between the processes in the system were needed in order to go further with the project. The fact that the poor production performance mainly was related to the value stream and not to for example; variability, maintenance, quality issues or equipment performance made Lean production theories most appropriate to use during the thesis work. Lean takes a holistic approach to the design of the whole operating system and addresses the underlying root causes to the problems and not just the symptoms and can close the gap between actual performance and the requirements of customers and stakeholders.40
Put simply, Lean is an integrated set of principles, practices, tools and techniques.41 It was natural for the author initially to start with the basic Lean concepts that the author knew would be necessary to conduct the thesis and write the frame of reference. In order to move forward and develop a deeper understanding of FTRTIL value stream and current situation were value stream mapping the best tool to use since it provides information about the material and information flow. The Lean principles, tools and techniques came to evolve during the empirical observations and were thereby added to the frame of reference. The parallel development of the theoretical framework is something Dubois & Gadde stress since categorization without such a theoretical platform necessarily adds less to our understanding. It should also be mentioned that the theory used in this thesis is only a fraction of what Lean really means.
2.5 Qualitative and quantitative data
The data collected in an empirical study can either be quantitative or qualitative. The first step when conducting a study is to start to review appropriate literature in order to develop a conceptual framework. The researcher can during that time enter the field to conduct interviews but for the purpose of developing measures or clarifying variables rather than generating conceptual framework. The next step is to build a formal theory, founded in previous research. The theory should be universal in the sense that it is applicable to several phenomena and capable of generating predictive statements if tested in real world settings.42
38 Kitchenham, 2007 39
Ibid.
40 Drew, McCallum, Roggenhofer, 2004 41 Ibid.
42
10 2.5.1 Quantitative
Before the researcher begins with the data collection proposed answers to the research question should be answered in forms of hypotheses arising from the theory. The data can then be collected through carefully constructed measurement instruments by field surveys or experiments.43 The collected data involves number and classes and are analysed using descriptive statistics, correlation analysis, development of predictive models and hypothesis testing.44The analysing process is critical and if the researcher not fully understand or know how to interpret the data are the results useless.45
The purpose of a quantitative study is to give the researcher a deeper understanding and explanation of the phenomenon so that more questions can be generated for further research. There are some drawbacks with the quantitative methods that the researcher should be aware of, the information usually can be clouded due to the complexity of methods, large sample sizes needed and the difficulty in understanding and interpret the results from complex quantitative studies.46
2.5.2 Qualitative
Qualitative data is the most frequent used in case studies.47 With a qualitative approach the first step will be the data collection in order to get at first-hand knowledge of the subject. It is conducted by the researcher who is making several field visits to observe the phenomenon in its natural settings. The observations will frame an understanding of the phenomenon in its context which the researcher later on will be able to describe. The descriptions are generated by using qualitative techniques such as asking open-ended questions, interviews, observations, documents, audiovisual materials, pictures and diagrams.48 It is then analysed using categorization and sorting by keeping a clear chain of evidence so that the reader easily can fallow the derivation of results and conclusions from the collected data.49Compared to quantitative research a qualitative approach will increases the possibilities for a broad and rich description but is sensitive for the ideas and meanings of the individuals.50
2.5.3 Chosen approach
The author used qualitative data through the thesis since it maximizes the realism (internal validity) rather than the control and generalizability (external validity) that quantitative data does.51 A qualitative approach also provides the researcher with a deeper understanding of new or complex phenomena52 since it gives a richer and deeper description of the studied object53.
2.6 information sources
The source of information in this thesis is built on several sources of information. To be able to build up strong arguments same conclusions have been drawn from several of sources. This limits the effect of one interpretation of one single data source.54
43 Kotzab, Seuring, Müller & Reiner, 2005 44 Runeson & Höst, 2008
45 Näslund, 2002 46
Ibid.
47 Runeson & Höst, 2008
48 Kotzab, Seuring, Müller & Reiner, 2005 49 Runeson & Höst, 2008
50
Näslund, 2002
51 Kotzab, Seuring, Müller & Reiner, 2005 52 Ibid.
53 Runeson & Höst, 2008 54
11 2.6.1 Triangulation
Triangulation means that the object is studied from different angles to get a broader view. Triangulation is especially important when using qualitative data to increase the precision of the empirical research. Triangulation can be applied in four different ways:55
• Data (source) triangulation- using more than one data source or collecting the same data at different occasions.
• Observer triangulation- using more than one observer in the study.
• Methodological triangulation- combining different types of data collection methods. e.g qualitative and quantitative methods.
• Theory triangulation- using alternative theories or viewpoints.
The fact that the thesis was conducted by a single researcher made it a bit complicated to apply observer triangulation. The author did though a few times at special occasions take help from a production engineer to participate in interviews as an observer, mainly for the reason to avoid misunderstandings due to the spoken language but also to cross check that both the researcher and production engineer understood it in the same way and came to the same conclusions. Data triangulation was used when for example data were collected from different shifts as well as different days while observing processes. In that way the author could make sure that the operators’ performed work not just was a coincidences for a particular day and instead a deep rooted work pattern.
2.6.4 Validity
“The validity of a study denotes the trustworthiness of the results, to what extent the results are true and not biased by the researchers’ subjective point of view.”56
When conducting a research, it is important to ensure the quality of the results. This is done by concerning the validity as well as the reliability which is discussed in 2.6.3. Validity can be divided into three different types; internal, external and construct validity.57 The author of the thesis has throughout all the phases considered and used the aspects of external and constructs validity. External validity is concerned to what extent the case study can be generalized and relevant for other cases with similar characteristics.58 The construct validity ensures that the measures being used correspond to the research concepts. It has been ensured through triangulation of multiple data sources such as observations, interviews, documents, books and websites, keeping a clear chain of evidence and feeding back the analysis results.59
2.6.3 Reliability
Reliability is the ability to repeatedly produce similar results for similar situations.60 The data and analysis should not be dependent on the specific researcher and hypothetically should the same research conducted by another researcher give the same results.61 The reliability in this thesis were ensured by using structured protocols during longer interviews and even sometimes audio recorded it to minimize researcher bias. A common “drop box” was also used to collect and analyse data which production engineers and involved persons had access to review.
55
Runeson & Höst, 2008
56 Ibid.
57
Kotzab, Seuring, Müller & Reiner, 2005
58 Runeson & Höst, 2008
59
Kotzab, Seuring, Müller & Reiner, 2005
60 Ibid. 61
12
3 Frame of reference
This chapter is a brief summary of Lean theories, models and tools which worked as a theoretical platform when conducting the thesis.
3.1 Lean production
In recent decades almost every industry in the world has started practicing Lean production which was invented by the car manufacturer Toyota.62 Many of its practitioners tend to “fail” or experience limited results. The reason is that, they are focusing too much on the “tools”63and belief that optimization of individual components leads to optimization of the whole64. This is probably the biggest obstacle for companies on their way to become Lean65. Lean should rather be seen as a whole system that permeates all the functions in the entire organization.66
The simplest definition of Lean is “to do more with less” which further can be translated to do good things with less resources such as material, energy, pollutions to achieve the ultimate sustainability.67 Taiichi Ohno expressed this as:
"All we are doing is looking at the time line, from the moment the customer gives us an order to the point when we collect the cash. And we are reducing that time line by removing the non-value-added wastes."68
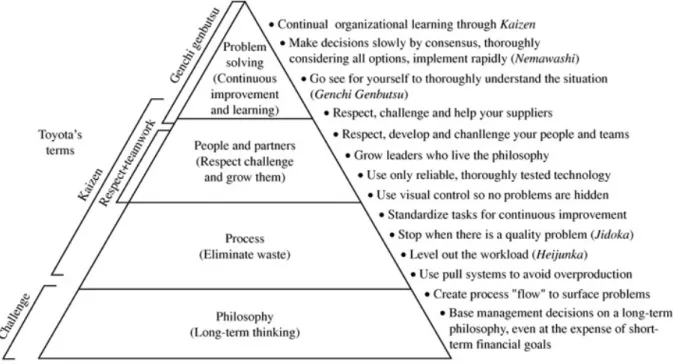
The Toyota Way can be divided into 14 principles which is the foundation for the technique and tools that Toyota Production system (TPS) involves for the general management.69 The principles can be catheterized into four sections: philosophy, process, people and partners and problem solving, the so called 4P model (see figure below).
62 Liker, 2009 63 Ibid.
64 Bicheno, Holweg, Anhede & Hillberg, 2011 65
Ibid.
66 Liker, 2009
67 Bicheno, Holweg, Anhede & Hillberg, 2011 68 Liker, 2009
69
13
Figure 4 The 4P model (Liker, 2009)
3.1.1The three M: Muda, Muri & Mura
In Lean the objective is to optimise cost, quality and delivery. In order to meet the objective are three key sources of loss eliminated; waste, variability and inflexibility, further described below.70
Muda - is the Japanese word for waste. Toyota defines waste as everything that doesn’t add any value to the customer.71
Muri - is waste caused by overloading equipment or humans which causes production stops and defect products.72
Mura - is irregularity, for example caused by varying production volumes.73
The three losses are closely linked to the three objectives. For example; eliminating waste helps to reduce cost, eliminating variability improves quality and eliminating inflexibilities optimises
delivery.74 This is however a simplification and the reality are more complex. For example Mura and Muri lead to Muda.75
3.1.2 The seven wastes
Waste is these elements of production that doesn’t add any real value to the product or service.76 The waste can usually be attributed to the eight wastes. These are:
70 Drew, McCallum, Roggenhofer, 2004 71 Liker, 2009
72
Ibid.
73 Ibid.
74 Drew, McCallum, Roggenhofer, 2004 75 Bicheno, Holweg, Anhede & Hillberg, 2011 76
14 1. Overproduction
Overproduction is when more items then the customer actually requesting are manufactured, too early or for safety stock. Overproduction prevents a smooth flow which results in unreasonable long lead time, a lot of work in progress and unnecessary storage.77
2. Waiting
Waiting is directly linked to flow.78 It occurs for example when an operator monitors an automated process or is waiting for tools or material.79
3. Unnecessary transports
Unnecessary transports or movements occur when material and WIP are moved, in, out or between the value added processes.80 This waste is closely linked to the factory layout and how the material handling is managed.81
4. Unnecessary movements
Unnecessary movements are caused when an operator needs to stretch, bend, look, or move to be able to reach the required components.82 This waste is mainly due to the layout and design of the work station.83
5. Over processing or incorrect processes
When using unnecessary processes steps without adding value for the customer. It may be due to the wrong techniques or poor tools.84
6. Excess inventory
Excessive WIP, raw materials or finished gods will increase the lead time, hide problems and increase the need of floor space.85
7. Defects
Production of defective products that either needs to be reworked or ends up scrapped.86 8. Untapped creativity among employees
The loose of ideas, experience, creativity and competence that the employees may carry. In the simplest of terms, Lean is the elimination of waste87and whenever waste is found in an operation, it is a sign that unnecessary cost is being incurred.88
3.1.3 Kaizen & Kaikaku
Kaizen is the Japanese word for continuous improvements. It is both a philosophy as well as a set of tools. Kaizen philosophy involves engaging all the personnel in continuous improvements, in small steps, at all levels and forever since no process can ever be considered perfect.89 It is managed by
77
Bicheno, Holweg, Anhede & Hillberg, 2011
78 Ibid. 79 Liker, 2009 80 Ibid. 81
Bicheno, Holweg, Anhede & Hillberg, 2011
82 Liker, 2009
83 Bicheno, Holweg, Anhede & Hillberg, 2011 84 Ibid.
85
Ibid.
86 Liker, 2009
87 Alukal & Manos, 2006
88 Drew, McCallum, Roggenhofer, 2004 89
15
dividing employees into small groups that effectively work with solving problems, document and improve processes, collect and analyse data and to exercise self-control.90 Kaikaku (also referred to Kaizen Blitz) on the other hand share most of the Kaizen philosophy but with the difference that the improvements are larger but less frequent.91 The step change improvements are usually based on changes in the value stream which was discovered during the value stream mapping activity.
Workshop
A Kaizen event is when a handful people from various functions meet for a short intense period of usually one week.92 It will fill the empty space between local improvement initiative and bigger initiative such as an improved value stream. The group will utilize their creativity, experience, skills, knowledge and innovation for focusing on a single narrow task, probably found during the value stream mapping.93 The aim is to create ideas for improvements and implement the best ideas.94
3.1.4 Genchi Genbustsu
Genchi Genbustsu philosophy is a well used method among the managers at Toyota. It simply means to go to the place where the actual process is and from there watch it and collects useful information.95 Solving problems should always start at the source to the problem and not from conference room to be able to get a deeper understanding and to show engagement to the worker at the shop floor.
3.1.5 Just in time
Just in time (JIT) is a set of tools, principle and techniques which enable companies to manufacture high quality products efficiently with shortest possible lead time. The aim is to satisfy the customer by delivering the right product at the right time and in the right quantity.96 It is managed by eliminate wastes, variability and congestions in the flow usually by removing safety stock and reducing inventory levels. This is a win- win strategy, either nothing happens, which means that the system can be run narrower or problems will be visualized and brought (up) to the surface.97
3.1.6 One Piece Flow
One piece flow, also referred to continuous flow is when one piece at the time is produced.98 In order to achieve continuous flow the processes are physically arranged in the same sequence required to be able to produce the customer order in shortest possible time.99 By letting each item flow immediately from one process step to next without any stagnation in between eliminates most of the seven wastes.100
90 Liker, 2009
91 Bicheno, Holweg, Anhede & Hillberg, 2011 92
Drew, McCallum, Roggenhofer, 2004
93 Bicheno, Holweg, Anhede & Hillberg, 2011 94 Alukal, George., Manos, Anthony., 2006 95 Bicheno, Holweg, Anhede & Hillberg, 2011 96
Liker, 2009
97 Bicheno, Holweg, Anhede & Hillberg, 2011 98 Rother, Mike., Shook, John., 2003
99 Liker, 2009 100
16
Figure 5 Continuous flow (Rother & Shook, 2003) 3.1.7 Takt time
Takt time is the basic concept behind regularity and synchronization in a production system, from raw material to end customer.101 Takt time is used to set the production speed and warn workers if they work too fast or too slow.102 With a synchronized work, queues will not be formed in between the processes and thus also reduces the lead time.103 Takt time is calculated by dividing the available working time (for a certain period) with the average customer demand under the same period.
𝑇𝑎𝑘𝑡 𝑡𝑖𝑚𝑒 =𝑇𝑜𝑡𝑎𝑙 𝑎𝑣𝑎𝑖𝑙𝑎𝑏𝑙𝑒 𝑝𝑟𝑜𝑑𝑢𝑐𝑡𝑖𝑜𝑛 𝑡𝑖𝑚𝑒𝑇ℎ𝑒 𝑎𝑣𝑒𝑟𝑎𝑔𝑒 𝑑𝑒𝑚𝑎𝑛𝑑 (Equation 1)
3.1.8 Pull & Push
Pull is when production is based on consumption from the previous process. It is the customer‘s demand that sets the pace of production by pulling underlying process to initiate manufacturing. In this way, production will match the customer demand and overproduction avoided. This in turn translates to less WIP translates to smoother production flow translates to shorter lead time translates to greater response to changes in customer demand which in total will lead to reduced costs.104 The opposite to pull is push, characterized by processes producing regardless of the customer demand. It is typical for batch production where production is based on schedules or forecasts that guess what the next process will need. It is impossible to create a smooth flow when each process has its own schedule and are operated as “isolated islands”. The processes will then produce parts after their own discretion instead of the value stream. This implies also that parts at a later stage have to be pushed into storage.105 3.1.9 SMED
SMED stands for Single Minute Exchange of Die and is the method used to reduce changeover times. The changeover time is the time it takes between the last manufactured part in the first series till the first approved part in the second series.106
101 Bicheno, Holweg, Anhede & Hillberg, 2011 102
Liker, 2009
103 Bicheno, Holweg, Anhede & Hillberg, 2011 104 Ibid.
105 Rother, Mike., Shook, John., 2003 106
17
The changeover time can be divided into IED (Inside Exchange of Die) and OED (Outside Exchange of Die). IED are things that have to be executed while the machine is stopped and OED are operations that can be done while the machine is running. The setup time can be drastically reduced by identifying and classify internal and external setup time and then convert IED to OED. The method involves a work in eight steps:107
1. Separate IED and OED 2. Convert IED to OED
3. Standards must be functional 4. Functional fasteners
5. Pre-adjusted fixtures 6. Parallel operations 7. Eliminate adjustments 8. Mechanize
In order to better analyse these steps, it has today become increasingly common to videotape the changeover.108 The long term objective with SMED is always zero setup. The changeovers should be instantaneous and never interfere with any continuous flows.109
3.1.10 5S
5S is one of the most popular Lean tool. It is easy to practice and has a positive influence on quality and productivity.110 It first gained its reputation when Americans visited Japanese factories during the 1970-1980. Their first reaction when entering the factories was that the factories were so clean that you could eat directly from the floor.111 The five S are;
1. Sort (Seiri) - It starts with first deciding the sorting criterions. Out of that the work continues with tagging all essential tools and items at the workplace. The remaining things at the work place can then be removed.112
2. Simplify (Seiton) - Means that everything should have its own place where it always can be found. It can for example be achieved by implementing shaded tool panels and dedicate the most frequent used tools the best place and by marking locations for material.
3. Shine (Seiso)- Clean, both fiscally and visually. The clearing serves as a check that the previous organizational steps really work but also to find new deviations and their causes. 4. Standardize (Seiketsu)- Create rules and standards to maintain the three first steps. The
standard is the today best way but workers should always strive to improve the standard. 5. Sustain (Shitsuke)- The management regularly monitor the results in order to maintain the
discipline and showing their interest among the workers.
107 Södahl, Lars O.,1984 108
Ljungberg, 2000
109 Alukal, George., Manos, Anthony., 2006 110 Bicheno, Holweg, Anhede & Hillberg, 2011 111 Liker, 2009
112
18
The 5S’s is a methodical and efficient way to create and maintain the order in the workplace113 and creates together a process for continues improvements.
3.1.11 Visual control
Visual systems may be applied in a variety of ways and methods depending on the type of information to make visual. It is an important concept that is directly linked to the two pillars of just-in-time and automation with a human touch.114 Common for all types of visual control is that it is used to prevent problems to remain hidden.115 Kanban, Andon and 5S are all examples of methods that promote visual control. In a Kanban system a wrong number of inventory levels will fairly quickly be detected if it does not match the Kanban while the Andon board is a signal system that informs everyone that a problem has arisen during the process of work. Working with 5S will result in good order at the workplace since places where tools, products and components should be placed and stored are clearly marked. Deviations in inventory control, WIP, progress status and transport operations will then easily be visible.116
Another type of visual tool is the communication board. The communication board is a great tool to drive and support improvements. It is common for operators and group leaders once a day meet at the board to communicate, reflect and solve problems. The board is also used to visualize various types of charts that for example it can show, project objectives, metrics associated with the flow and lead time, the results for the area of causes and remedies, daily outcomes ie. what the plan was and what the actual outcome was.117
Andon
To make abnormalities, problems and failures at the shop floor more visible a highly placed Andon board be of a great help. The highly placed board makes it easy for everyone at the shop floor spot it and follow the production status by the color of the lights on the board. In this way operators and line managers can immediately be alert to problems instead of finding problems through statistical analysis. There are four types of Andon: “paging Andon” that light up when parts are needed or missing, “emergency Andon” that inform supervisors of abnormalities, “operation Andon” that indicate the operation status of the equipment and “progress Andon” that confirm the progress of operations.118
3.1.12 Pacemaker
The pacemaker is the point from which the entire value stream in a factory is controlled. The pacemaker is the heart and the material handler stands for the circulation. Having a pacemaker reduces the fluctuations and creates synchronization. The pacemaker point is not necessary a bottleneck but usually is. The production downstream the pacemaker should be of continuous flow while upstream processes are operated by pull.119
113 Ljungberg, 2000 114 Lu, David., 1985 115 Liker, 2009 116 Lu, David., 1985
117 Bicheno, Holweg, Anhede & Hillberg, 2011 118 Hirano, Hiroyuki., 1990
119
19 3.1.13 Lean layout, Work stations & Cells
In Lean it is essential to create production cells to facilitate one piece flow. It can be done by grouping people, machines or workstations in the sequence for the process of production.120
When a cell is formed, it should be made as compact and transparent as possible. This is done by placing the machines and work stations close to each other so that the start and end station comes close together. In this way it is easier to redeploy operations and avoiding unnecessary movements from the operators. Places where material can accumulate should be avoided as they will prevent operators from moving freely. The tools required to perform the task should be located close to the workstation and oriented in the same direction as in which they are used. The tools in question should also be custom-made for the task to avoid time consuming changes and adjustments.
Research from Chalmers of e.g. Medbo and Wänström has shown that there are major advantages in designing the workstations as the Toyota's way of thinking. They summarized a list with the following principles:121
• The focus should be the value-added work that operators perform. • Packaging adapted to the component.
• Use smaller and more slender containers with deeper material facades. • Flexible and removable material racks.
• Create pull system for refilling. • Fewer inner packaging.
• No pallets and pallet collars • Tilted chutes
Following these principles has shown good potential in reducing the walking distance, direct labour, required material space and line length.122
3.1.14 Material handling
An important part of Lean is to use an accurate and efficient material handling system. Traditional methods that make use of powered conveyor belts are not preferred since it locks in waste of motion and complicates communication. It is today, still common that material is moved by forklifts between the storage and the workstations. This is however sometimes inevitable but will encourages material movements in large batches with pallets that requires more space by the line side. Forklifts are also an expensive investment that will affect the layout as well as jeopardize the safety in the factory.
A better way of managing the material handling is to use trains that are towing trolleys with material.
The train will travel along a regular route (also called milk routes) at certain times and stop in bus stops at regular intervals. The trains can either deliver material in kits or in small containers that can be moved by the operators themselves.123
The best way is to use hand-trolleys, if they are ergonomic correctly designed. They should then be
moved by the material handling personnel and not by the cell operator. It will allow maximum
120 Liker, 2009
121 Bicheno, Holweg, Anhede & Hillberg, 2011 122 Ibid.
123
20
flexibility at a minimum cost without any risk of breakdown. Hand-trolleys also encourage flows in small batches.124
Kitting125
Lean theories often pin points the importance of maximizing the value adding work. In order to achieve efficient assembly operations in a manual assembly system should the value added work of the operators be maximized. The time operators and assembler spend fetching parts often constitutes of a significant proportion of the non value added time. This time can be reduced with a right kitting strategy.
Kitting is a material handling method for delivery of material to the assembly station or line. A kit is a specific pre-sorted collection of components and/or subassemblies that together contains parts and material for one assembly object. A kit is usually presented in some form of carrier, such as a box or on a trolley with for example dedicated locations for the parts. At the assembly station/line can the kit either be presented in a stationary position or travel along with the assembly object.
Kitting can also be combined with other strategies such as continuous supply. This means that some parts are supplied by kitting and others by continuous supply. A reason of combining kitting with other strategies is the space savings that kitting often results in and in the same time not having to spend more time than necessary repacking parts in kits. However, mixing two strategies should be done carefully to not lose or reduce the advantages that kitting offers.
There are several of aspects to consider when kitting material to an assembly line. In order to achieve high efficiency the following aspects should be optimized: presentation of the parts, distance to reach the part, type of unit loads used for presenting the parts, height and orientation of the unit loads and how the parts are grouped.
The advantages that can be achieved with a well thought kitting system are many compared to a conventional assembly system. Kitting parts will save space , improve assembly quality, shorter learning times, a more holistic understanding of the assembly work, less time spent by the assembler fetching parts, shorter distance to reach parts and reduces the length of the assembly line/station. The drawbacks are that everything has to be prepared in advance which may require additional space and handling.
Supermarkets
A supermarket works as some kind of buffer/safety stock in between spots in the production where it for the moment is impossible to have a continuous flow and batching is necessary.
“In fact, a buffer storage in the correct place can enable an improved flow across the whole enterprise”126
Producing to a supermarket is especially useful where there are processes with too long lead time or for flow that cannot be connected to processes with continues flow. When using a supermarket, it is common that the upstream flow operates in a batch mode while downstream flow is operated as a pull system.
124 Bicheno, Holweg, Anhede & Hillberg, 2011 125 Hanson & Medbo, 2010
126
21 3.1.15 Kanban
Kanban is one of many tools to establish and maintain Just-In-Time production in a pull a system.127 The classic signal system (kanban) grew out of a statistical inventory management method known as the reordering point method128 for effectively reduce muda, mura and avoid muri.129 A kanban can for example be a card, empty bin, trolley or a box which will work as a signal to refill or replenish a specified number of parts or components. Thus will securing the flow.130 The main functions with the kanban systems are to provide pickup and work order information, eliminate overproduction waste and work as a tool for visual control. Unlike conventional materials requirement planning system with push policy will the information in a kanban system be related to the actual goods.131
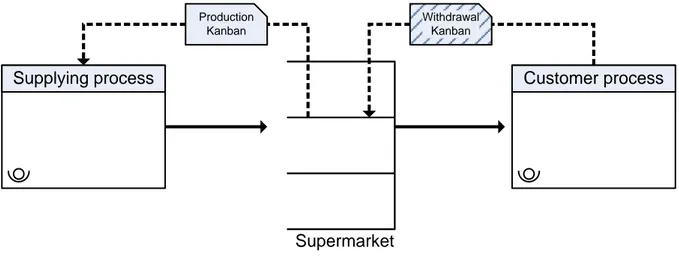
There are many types of kanban. Single kanban is the most common type and is suitable for most manufacturing environments with repetitive manufacturing and smooth demand. The principle of single kanban is that a card is operating between two workstations. There may of course be several cards in the loop depending on how many items controlled by kanban but the principle will still be the same.132 Below is an illustration of how a Kanban system can operate.
Supplying process Customer process
Production Kanban
Withdrawal Kanban
Supermarket
Figure 6 Kanban pull from supermarket
The customer process takes one part from the supermarket (withdrawal kanban) which trigger the movement of parts (black arrow). The production Kanban triggers the production of parts in the right quantity which will be supplied to the supermarket.
Calculating Kanban quantities
The reorder point system is an order system for repetitive manufacturing according to pull principles. When the inventory reaches a given level (reorder point) will a signal (kanban) be triggered for restocking a certain quantity.
The order point is given by the following formula:
127 Hirano, 1990 128
Ibid.
129 Bicheno, Holweg, Anhede & Hillberg, 2011 130 Liker, 2009
131 Hirano, 1990 132
22
𝑂𝑟𝑑𝑒𝑟 𝑝𝑜𝑖𝑛𝑡 (𝑂𝑃) = 𝐸𝑥𝑝𝑒𝑐𝑡𝑒𝑑 𝑑𝑎𝑖𝑙𝑦 𝑐𝑜𝑛𝑠𝑢𝑚𝑝𝑡𝑖𝑜𝑛 (𝑃) ∗ 𝐿𝑒𝑎𝑑 𝑡𝑖𝑚𝑒 (𝐿𝑇) + 𝑆𝑎𝑓𝑒𝑡𝑦 𝑠𝑡𝑜𝑐𝑘 (𝑆𝑆)
(Equation 2: Order point)
P = Expected daily consumption which is dependent on the manufacturing strategy. Applying hijunka, is the daily consumption expected to be pretty smooth.
LT = Lead time is the time from ordering the part from the customer until it is processed. SS = Safety stock is used for backing up problems in the production
The Kanban quantitiy or the maximum stock Smax can then be calculated with the following formula: 𝑀𝑎𝑥𝑖𝑚𝑢𝑚 𝑠𝑡𝑜𝑐𝑘 (𝑆𝑀𝑎𝑥) = 𝑂𝑟𝑑𝑒𝑟 𝑞𝑢𝑎𝑛𝑡𝑖𝑡𝑦 (𝑄) + 𝑆𝑎𝑓𝑒𝑡𝑦 𝑠𝑡𝑜𝑐𝑘 (𝑆𝑆) (Equation 3: Kanban
quantity)
Order quantity = Q is the quantity of which the parts is ordered or manufactured in. With the constraint that no more than one order per detail at a time will inevitably to the condition that the order quantity may not be less than the ordering point (Q >= OP).
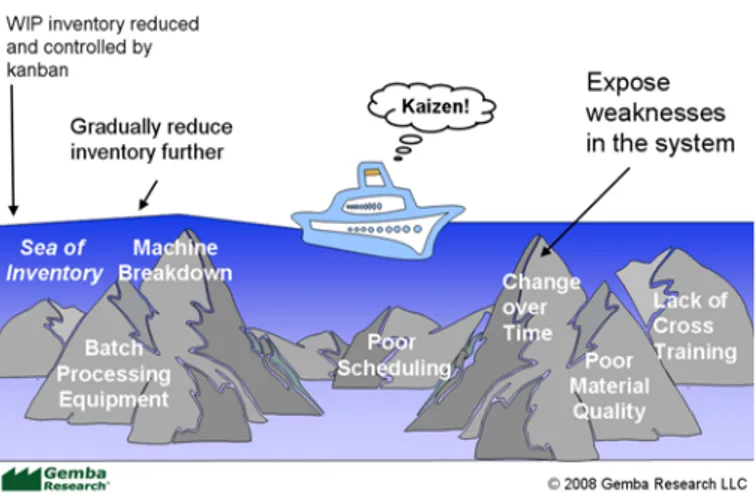
The challenge is not to implement a kanban system, but to develop a learning organization that will find ways to reduce the number of kanbans and thereby eventually eliminate the buffer stock and create continuous flow. This can be illustrated by the famous analogy about the water and the rocks (see figure 7). The rocks represent all sorts of problems while the water is the inventory level. By continuously reducing the inventory levels will problems become visible and brought to surface.
3.1.16 5 Why
In Lean it is fundamental to seek the root causes of the problem instead of solving the problem superficially.133 Taiichi Ohno emphasized that real problem solving requires identifying the root cause rather than the source, the root cause lies hidden beyond the source.134 The simple but incredibly effective method 5 why is a question-asking technique which ensure to find the root cause to the problem. Asking “why” a several times will thereby lead you to the underlying causes of the problem.135
3.2 Value Stream Mapping
“Many sources of waste that occur in traditional production line operations due to the focus on large batch production can be identified and eliminated through value chain analysis”136
133
Bicheno, Holweg, Anhede & Hillberg, 2011
134 Liker, 2009
135 Bicheno, Holweg, Anhede & Hillberg, 2011
136
Bowen & Youngdahl, William, 1996
Figure 7 Water and rocks analogy. (source: Gemba Research LLC, 2008)