SKI Report 00:26
Operator Performance in
Non-Destructive Testing:
A Study of Operator Performance
in a Performance Test
ISSN 1104-1374 ISRN SKI-R--00/26--SEJohan Enkvist
Anne Edland
Ola Svenson
May 2000
SKI Report 00:26
This report concerns a study which has been conducted for the Swedish Nuclear Power Inspectorate (SKI). The conclusions and viewpoints presented in the report are those of the authors and do not necessarily coincide with those of the SKI.
SKI Project Number 98127
Operator Performance in
Non-Destructive Testing:
A Study of Operator Performance
in a Performance Test
Johan Enkvist
1Anne Edland
1,2Ola Svenson
1 1Dept. of Psychology
Stockholm University
SE-106 91 Stockholm
Sweden
2
Swedish Nuclear Power Inspectorate (SKI)
SE-106 58 Stockholm
Sweden
Summary
In the process industries there is a need of inspecting the integrity of critical components without disrupting the process. Such in-service inspections are typically performed with non-destructive testing (NDT). In NDT the task of the operator is to (based on diagnostic information) decide if the component can remain in service or not. The present study looks at the performance in NDT. The aim is to improve performance, in the long run, by exploring the operators’ decision strategies and other underlying factors and to this way find out what makes some operators more successful than others. Sixteen operators performed manual ultrasonic inspections of four test pieces with the aim to detect (implanted) cracks. In addition to these performance demonstration tests (PDT), the operators performed independent ability tests and filled out questionnaires. The results show that operators who trust their gut feeling more than the procedure (when the two come to different results) and that at the same time have a positive attitude towards the procedure have a higher PDT performance. These results indicate the need for operators to be motivated and confident when performing NDT. It was also found that the operators who performed better rated more decision criteria higher in the detection phase than the operators who performed worse. For characterizing it was the other way around. Also, the operators who performed better used more time, both detecting and characterizing, than the operators who performed worse.
Sammanfattning
[Summary in Swedish]
Inom processindustrin finns det ett behov av att kontrollera integriteten hos kritiska komponenter utan att störa processen. Sådana kontroller utförs med hjälp av oförstörande provning (OFP). I arbetet med OFP skall provaren med hjälp av diagnostisk information fatta ett beslut huruvida en komponent måste åtgärdas eller ej. Föreliggande studie undersökte provarnas prestation. Syftet med studien var att på sikt förbättra prestationen genom att undersöka provarnas beslutstrategier och andra bakomliggande faktorer för att på så sätt se vad som skiljer en provare som lyckas bra från en som lyckas sämre. Det övergripande syftet med projektet i vilket studien ingår är att förbättra kvalificering och provningskvalitet. I studien utförde sexton provare manuell ultraljudsprovning av fyra provstycken i syfte att hitta (inlagda) sprickor. Utöver dessa prestationstest (PDT) utförde provarna oberoende anlagstest och svarade på frågeformulär. Resultaten visade att provare som litar mer på sin egen känsla än på proceduren (när de två kommer till olika resultat) och som samtidigt har en positiv inställning till proceduren lyckades bättre på PDT. Dessa resultat visar på behovet av att provarna är motiverade och litar på sin förmåga när de utför provning. Vidare fann man att provarna som lyckades bäst gav fler beslutskriterier högre vikt vid detektion än de som lyckades sämre. För karaktärisering rådde omvända förhållanden. Dessutom använde de provare som lyckades bättre mer tid, både till detektering och karaktärisering.
INTRODUCTION
In the process industries interruptions of the process are very costly. Therefore, vital components are typically tested for quality to assure continued performance of the equipment, and thereby an uninterrupted process. Also, inspections can be required to meet security and/or demands from regulators. By utilizing non-destructive testing (NDT), the equipment can be tested while still in service. (In nuclear power plants, however, testing is done during outages when the reactors are shut down.) To ensure a successful inspection, each part of the NDT system must be reliable (i.e., equipment, procedure & personnel). In studies of NDT reliability the results often show great variance in operator performance (e.g., Murgatroyd, 1994 (see Enkvist, Edland, & Svenson, 1999, for a richer description)). Most research in this field concern equipment aspects. The aim of the research has been to increase the capability of the system by fine-tuning the technology. However, no chain is stronger than its weakest link. Although human factors may be hard to control, increased automation paradoxically makes the human role even more important for the automation to work optimally all the time.
With more complex tasks, the human has to invest more effort into managing them. Environmental and work situation factors become more important, and have a larger effect on performance, when a task is more complex. Manual ultrasonic testing (UT) is a very complex task, where the operators rely on their sensory, perceptual, cognitive, and motor skills. This means that the quality of performance depends on the individual operator. Harris (1992) stresses that the less done to prevent human error to occur, the more errors are likely to occur.
The importance of human factors for the reliability of inspection is not questioned, however, no clear connections between single individual factors (e.g., experience or noise and heat) and inspection performance have been established. For example, when examining a study on the inspection of fatigue cracking in aircraft parts, Spencer and Schurman (1986) found that ”The variation across technicians [operators] is about as large as it could be”. Also, Kettunen & Norros (1996) conclude: ”...no single human or organizational factor is responsible for the NDT performance fluctuations obtained in various reliability studies...”
Although many different approaches have been used in order to explain the variation in operator performance not many facts have been established. Hoogstraate (1998) claims that the relative attention and resources spent has not been in proportion to the relative importance equipment, organization, and operators respectively, have on the quality of inspection process as indicated by field experiences and round robin tests. This suggests a need for human factor studies and a potential for them improving the overall reliability of NDT.
Since much of the performance variation seems to emanate from man, reducing mans impact might be an attractive alternative. However, performance varies even if the inspection is mechanized. According to Skånberg (1991) this is probably due to the fact that different operators use different criteria for assessments and decisions. Much of the problem lies in the assessment of the indications, not in their detection (even though it is important to find them first). In a study for the FAA, Spencer & Schurman (1986) found that the decision criteria or cues actually used for assessments under the inspection were more influenced by the training and experience of the operator than by the procedure used at the time. (No single individual factor was found that could explain the varying performance of NDT operators.) Also, Skånberg (1994) claims that the physical and
mental environment and how the operator interprets them to a high degree influence the ability of the operator. Therefore, one way to improve performance is to better utilize the diagnostic abilities of the operators by making changes guided by findings in human factors studies. ”...the reliability of an inspection process hinges on the performance and judgement of the operator carrying out that inspection.” (Dickens & Bray, 1994)
Studying transcripts of think-aloud protocols, Harris & McCloskey (1992) found cognitive processes important for the success of ultrasonic inspections. Four cognitive elements were found to be associated with successful inspections. Firstly, development of explicit hypotheses as an integral part of the inspection process. Secondly, avoidance of reaching a conclusion too early in the inspection process. Thirdly, application of knowledge during the inspection by using it in the form of if - then logic. Finally, avoidance of the arbitrary elimination of information during the process of reaching an inspection conclusion
In a subsequent study, Harris (1992) utilized the findings of the above study. Operators with a decision-aid (based on the above elements) had 25% better performance than the non-aided operators did. The big difference in performance and the small experimental difference between the two groups of operators point to the importance of following a procedure. The findings in the Harris & McCloskey study suggest that the development of explicit hypotheses is an integral part of high quality performance inspections. This is probably because it helps the operator to structure the inspection and to avoid premature closure. (That is, reaching a conclusion too early in the inspection process, before all information has been obtained and considered.) Bray and McBride (1992) mean that the training of operators should be specific and task oriented, so that the operators gain concrete experience. In addition, the above findings suggest a need for more abstract training as well. For example, training in developing explicit hypotheses.
In a literature review, Enkvist, Edland and Svenson (1999) concluded that no single factor has been found that explains the variation of inspection performance. Also, results have varied even when the inspection is mechanized, which implies that the problem lies in the assessment of indications, and not in their detection. It was further concluded that more attention should be invested in proper feedback to the operators.
It may be assumed that, for easy-to-assess (non-ambiguous) indications, the assessments become fairly objective. That is, most operators would come to the same conclusion. However, when indications are hard to assess (ambiguous), there is more room for the operators’ assessments and decisions to be affected by individual factors. Examples of such individual factors can be prior experiences of similar situations. That is, in some situations, when an operator is convinced of a crack being present despite (ambiguous) evidence to the contrary, the operator may violate the qualified procedure in order to show what he/she knows to be true. It also stands to reason (and it is more likely to occur) that an operator who expects an object to be flawless is less observant to indications of their presence (c.f., Harris & McCloskey’s findings above).
Most studies in this field have concerned operators and their shortcomings. However, Karimi (1988) stresses the role of motivational and contextual factors. He means that the skill needed to perform an inspection can be acquired trough training. However, the motivation and the context must be good in order for the skill to be properly displayed (e.g., Murgatroyd, 1994). The authors of the present paper also acknowledge the importance of having a systems approach to the problem of performance variation in NDT. It is entirely possible that it is lack of a systems approach that leads to difficulties in pinpointing any single explanation of the varying performance. In a system there are more than just signal – response relationships
between important factors. There are also synergetic effects and other unforeseen events that make it difficult to make adequate plans for how to deal with anticipated events. Also, the system can cope with some inadequacies in a short-term perspective, but when they remain the system might become overloaded.
Three issues were in focus in the present study of operators performing ultrasonic testing on test pieces with implanted flaws. Firstly, the importance of following a procedure. Secondly, the role of experience. Finally, the role that could be played by personnel selection tests. First, if all operators follow the same procedure the reliability of inspections is higher. The importance of following a well-planned procedure have been shown (e.g., by Harris, 1992). By analyzing how information-cues are used, and later relating information use to inspection performance, an improved knowledge of what makes a good assessment can be reached. Second, experience is often recognized as an important ingredient in expert decision making. How the experienced operator differs from the novice is still not clear. Finally, some operators might just be better and more able to perform well than others. By hiring the personnel most qualified for performing inspections, the quality of the inspections could be improved. The Dynamic Inspection Aptitude Test (DIAT) is one example of tests developed to assist in the selection of personnel (Harris & Spanner, 1998). The DIAT is a specific test that is designed to test a person’s potential of becoming a good (manual UT) operator. The PISC III study (Murgatroyd, 1994) emphasizes the importance of a continuous development of psychological test techniques in order to improve operator selection and performance. It is important to study what implications different instruments for selection of personnel can have for the long-term quality of inspection.
The main purpose of the present study is to study what should be considered in order to improve and homogenize operator performance. It is hypothesized that operators with a high spatial ability (as measured by AROS, see below) will have a better inspection performance than operators with a low spatial ability. Also, operators that perform well in DIAT will be more likely to perform well in the performance demonstration test as well. It is further hypothesized that, operators who to a higher degree rely on the procedure will make less false calls and misses. Finally, operators that are less experienced will assess different aspects of UT as being equally important to a higher degree than more experienced operators who will differentiate importance more.
Method
The main emphasis of the present study is on factors influencing the quality of manual ultrasonic inspection of welds in austenitic materials (and not on other types of NDT). This focus is necessary in order to get some grip of the “big picture”. Later studies can shed light on other areas such as eddy current and mechanized testing.
Participants
In this study, sixteen operators participated, all men. They differed in years of NDT experience, from three to 30 (mean 17 years); they also differed in age, from 23 to 52 (mean 39 years). The operators were all certified for manual ultrasonic testing (Nordtest, level 2 and 3). Fourteen of the operators were qualified for detecting and
characterizing (see below, under performance demonstration test). The last two operators mainly perform mechanized testing but were considered highly competent also in manual UT by their employer.
Personnel
Two persons were required to run the present study. One person administered the tests and collected the data. The other person administered the test pieces and provided technical support concerning NDT to the operators.
The task
The participants (here after referred to as the operators) in this study were to perform detection and characterization on four test pieces with manufactured flaws i.e., first the operators scan the material in order to detect indications of flaws that they subsequently characterize as cracks or geometries (see below). They were told to work as they would have, had they been working in a nuclear power plant. The operators were further instructed to work according to the procedure (UT-01) and to report all indications above the reporting level (both geometries and cracks). (The UT01 procedure is a procedure for austenitic material with stress corrosion cracking developed for the Swedish nuclear industry.) The operators were also instructed to note times for starting and stopping detection and characterization (for later comparisons).
The operators were instructed to leave the test piece after having completed the detection phase. When starting the characterizing phase, the operators first removed the excess weld (symbolized by a tape) over the area of interest. As when in nuclear power plants the operators were required to wear coveralls (jump suites), hard-hat, and (surgical) gloves. The operators were instructed not to consume alcohol the days immediately before and during the study.
Material used in the study
Ability tests
The operators in this study performed two ability tests at the very beginning of the study. One (AROS) was a paper and pencil test. The other (DIAT) was computer administered.
AROS
AROS is a test of spatial ability; it is designed to predict, among other things, the ability to perform technical-mechanical work. The task is to compare two geometries (”pieces of cardboard”) presented on paper, and to match digits on sides of the two-dimensionally drawn one with letters on the three-two-dimensionally drawn one. AROS was supplied by Psykologförlaget AB (Swedish supplier of psychological tests for professionals). The test was performed according to provided guidelines.
DIAT
The DIAT (Dynamic Inspection Aptitude Test) is developed by EPRI and Anacapa Sciences, as a tool for early screening of personnel (Harris & Spanner, 1998). The test is developed for the screening of personnel applying to be manual ultrasonic operators. DIAT is designed to measure a dynamic combination of spatial ability, short-term memory and hand – eye co-ordination, among other things. In the present study, however, it was administered to operators already active in manual UT. Thus, the tested group is not the one intended for the DIAT. The DIAT was installed and administered according to provided guidelines.
Questionnaires
The operators completed two questionnaires, one at the beginning of the study and the other at the end of the study. The first questionnaire considered the operators’ experiences of manual UT in general. Examples of topics in the first questionnaire were, UT-experience, the environment at different nuclear power plants, thoughts on the procedure, and information used in assessing the signals. The second questionnaire considered the present study and the experiences the operators made as well as the information they used to make their assessments. The signal characteristics used in the questionnaires were taken from Harris & McCloskey (1990). At the end of their participation each operator was interviewed. A summary of those interviews is presented in Appendix 1.
NDT equipment
The NDT equipment used in this study (instrument, transducers etc.) was the equipment that the operators ordinarily use in their profession. The equipment had to meet the requirements according to the procedure (UT-01).
Performance demonstration test
In order to perform NDT in a nuclear power plant (in Sweden) the operators have to have passed a qualification test. The qualification test is a test wherein the operators demonstrate their performance in NDT. In the qualification test the operators inspect a certain number of test pieces with manufactured flaws. The operators’ assessments of the test pieces are compared with the “fingerprints” of the test pieces. Only operators who meet the demands on “detection”, “characterization”, (through wall sizing,) and “false calls” pass the qualification test.
Test pieces
The four test pieces (manufactured by Sonaspection UK) used in this study, consisted of a (7 mm thick 168 diameter) pipe connected by a weld to a (11 mm thick 168 diameter) bent pipe. The bent pipe was bevelled down to 7 mm on the inside closest to the weld. The areas to be inspected (the HAZ) was on both sides of the weld, the material was austenitic stainless steel. The test pieces used for the performance demonstration test (PDT) in the present study were chosen on the basis of the
performance results generated under qualification tests. The four test pieces were assessed to yield some variation but still with all operators being able to complete the inspections in the time allowed, without feeling too much time pressure.
All the operators inspected all four test pieces; the order in which the operators inspected the test pieces was balanced. The operators were given five hours to inspect two test pieces on both days. The inspection of the first piece had to be completed, before the second could be started on.
Procedure (of the present study)
Four weeks before the study started a short description of the study was sent to the operators that were to attend the study. The operators were informed of what was expected of them, and the general planning of the study. The operators were not informed that they would all test the same four test pieces. Upon arrival at the test site the first day the operators were given an oral presentation of the study, they were also given the opportunity to ask questions regarding the study.
All inspections where performed in the same environment, with the test pieces mounted on two identical test-rigs. The test-rigs are mock-ups of a system, wherein test pieces can be mounted in different positions so as to induce different stances for the operators to work in. In the present study, two positions were used, knee-height (0.4m above ground) and chest-height (1.5m above ground). Each operator examined two test pieces at each of the heights, one height one day and the other height the other day, balanced order. The two test-rigs were placed next to each other, one test-rig was placed in a small room, and had slightly poorer lighting (no daylight). The other rig was placed in a larger room with better lighting and daylight. Half of the operators inspected the first two test pieces in the poorly lit room, and the last two test pieces outside the ”room”. For the other half of the operators order was reversed.
The operators had the opportunity to help themselves to refreshments (coffee, mineral water, soft drinks, and cookies) during the study. It was also possible to step outside for a nip of fresh air, or a smoke.
Day 1
After a short oral presentation the operators where administered a test of spatial ability (AROS). Before the test actually started the operators practised on an example, and they had the opportunity to ask questions about the test. The time to complete the test was 20 minutes. After the spatial test, the operators were introduced to the next test, the DIAT. First, the operators received an oral/whiteboard explanation in Swedish. Second, at the beginning of DIAT, the operators read instructions in English on the screen and a “hands on” training in the task. The time to complete DIAT was 36 minutes. After both AROS and DIAT were completed there was a break for lunch. After lunch a questionnaire was filled in, after that the operators started the inspection. The operators were given five hours to complete the inspection of the two test pieces to be tested the first day.
Day 2
The second day started with inspection of the last two test pieces. Again the operators were given five hours to complete the inspection of the two test pieces. After
lunch-break and when all four test pieces where inspected and reported the operators completed the second questionnaire. Finally each operator was interviewed concerning possible difficulties with manual ÚT (see Appendix 1)..
RESULTS
The results will be presented in the following. Firstly, the results of the tests used in the study are presented. Secondly, the participants are divided (post-hoc) into two groups according to their performance, and comparisons between the two groups are made.
The participants (operators) in the present study inspected four test pieces, performed two ability tests and completed two questionnaires. The youngest operator was 23 and the oldest 52 years old, mean age 37. Their experience varied from 3 to 30 years of experience. Other findings are presented below.
Performance demonstration test
Detection
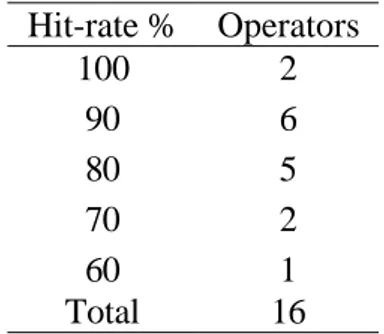
In the four test-pieces inspected by the operators there were ten cracks. Only two of the sixteen operators, found all cracks (100%), six operators found nine cracks, another five found eight cracks, two operators found seven cracks and one operator found only six cracks (table 1).
Table 1.Distributions of operators over hit-rates in PDT.
Hit-rate % Operators 100 2 90 6 80 5 70 2 60 1 Total 16
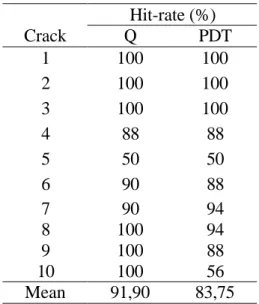
As can be seen in table 1 the lion part of the operators had an 80 or 90% hit-rate, and a few operators performed higher or lower. In order to be able to assess the above performance a comparison is needed. A comparison can be made with the performance derived from the accumulated qualification tests made on the same material. The performance results generated per crack under the qualification test as well as the results of the PDT are given in Table 2.
As can be seen in table 2 there is a variation in the hit-rates of the cracks for both conditions. There are more cracks with lower hit-rates for the PDT. But, as can be seen in table 2 the operators performed almost as well as when under the qualification test. Only two cracks differed substantially. The PDT hit-rate for all 16 operators was 83.75% (134 hits of 160 possible), from the hit-rates generated under qualification tests we would expect a 91.9% hit-rate (147 hits of 160 possible). That is, the operators did
not perform significantly worse in the PDT than could be expected from the hit-rates on the same test-pieces generated under the qualification tests.
Table 2.Hit-rates for each crack (1-10) generated under qualification test (Q) and performance demonstration test (PDT) respectively.
Hit-rate (%) Crack Q PDT 1 100 100 2 100 100 3 100 100 4 88 88 5 50 50 6 90 88 7 90 94 8 100 94 9 100 88 10 100 56 Mean 91,90 83,75 Length assessments
When an indication is detected the operators also assess the length of the indication. Figure 1 shows the variances in assessments for different crack lengths.
Figure 1. Differences between reported and true length of cracks plotted as a function of true length. The particular crack indicated * was a “lack of fusion” that should be characterized as a crack according to the procedure.
As can be seen in figure 1 there is a variance between true length and assessed length. Short cracks (<30mm) were overestimated, long cracks (>40mm) were Assessed length 20 30 40 50 60 50 40 30 20 60 Qualification
True crack length PDT +/- 1 sd *
underestimated. (The one crack that did not fit to this model was in fact a lack-of-fusion that should be characterized as a crack according to procedure. The endpoints of a lack-of-fusion flaw are very easy to determine, thus, easier to assess their length.)
Ability tests
The two ability tests AROS and DIAT did not work well as predictors of the PDT. The correlation between AROS and the PDT was low (rxy= 0.19), and so was the
correlation between DIAT and the PDT (rxy= 0.01). The correlation between AROS and
DIAT was significant (rxy= .46 p< .05). In order to check the predictability of the AROS
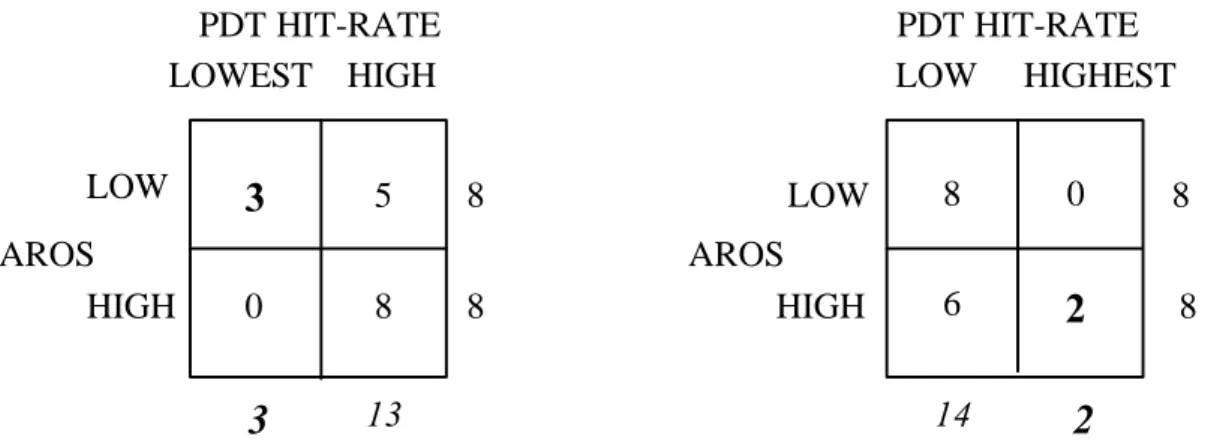
and due to the small sample, the sample was split into two equally large groups (see figure 2).
Figure 2. The AROS sample divided into two halves presented together with the lowest three (left) and the highest two PDT hit-rates (right).
The three poorest performing operators were among the 50% poorest at AROS. The two best performing operators were also among the best 50% AROS performers. Using this 50-50 criterion on AROS gives a 62,5% chance of correctly predicting which half an operator would perform in the PDT.
The traditional way to evaluate a test result is to look at the score, and traditionally one correctly solved item receives one point. Another way to evaluate a test is to reward those who do not produce incorrect answers. Looking at AROS this way (i.e., the amount of correct answers of the answers given) it correlates better with the PDT (rxy=
0.36) however, still not significantly. For DIAT there is no change in correlation when evaluating the scores this way.
A regression analysis showed that “confidence in self or the written procedure” and “positive attitude towards the use of the procedure” explain 55% of the variation in the performance demonstration test (F= 6.708 p< .012). [PDT=45.579 +self-trust X .268 +affirmation X 1.047]. The correlation between the predicted performance and the actual performance in the PDT was significant (rxy= .60 p< .01).
Post hoc division into two groups
In order to examine the data collected further, the operators in the present study were divided into two groups according to how well they performed in the performance demonstration test. Half of the operators found 80% or less of the cracks, and the other half of the operators found 90% of the cracks or more (see table 2 above). Looking at
3
5 0 8 8 0 62
LOWEST3
13 8 142
8 8 8 HIGHHIGH LOW HIGHEST
PDT HIT-RATE HIGH LOW LOW PDT HIT-RATE AROS AROS
hit-rate one can split the operators into two groups. By comparing the results of the lower performing group and the higher performing group a clearer picture of relationships can be found.
Age, school, and experience
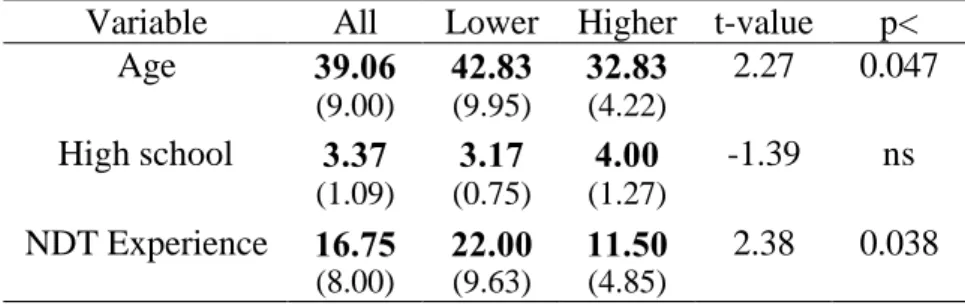
As mentioned above there was a variation in both age and experience between the operators. In table 3 are presented means for age, schooling and experience, for all operators and the two groups respectively.
Table 3.Means (in bold) and standard deviations (in parentheses) for age, education and NDT experience for all operators, and the lower and the higher performing groups respectively. Also, t-values and degrees of significance (p) are given.
Variable All Lower Higher t-value p< Age 39.06 42.83 32.83 2.27 0.047 (9.00) (9.95) (4.22) High school 3.37 3.17 4.00 -1.39 ns (1.09) (0.75) (1.27) NDT Experience 16.75 22.00 11.50 2.38 0.038 (8.00) (9.63) (4.85)
As can be seen in table 3, the lower performing group was significantly older, and had significantly more experience than the higher performing group. However, the correlations between hit-rate and age and experience respectively were low and negative (hit-rate and age: rxy = -.295; hit-rate and experience: rxy = -.226). That is, no clear-cut
connection between the result on performance demonstration test and experience or age respectively could be found.
AROS & DIAT
The mean score on AROS for all operators was 30.4 (of 60). The operators in the lower performing group had a mean of 27.5; the higher performing group had a mean of 33.3. That is, the lower performing group had slightly lower results on the AROS test. For the DIAT the mean score for the 14 operators who performed the test was 20.9 (of 36). The mean for the lower performing group was 20.5, and the higher performing group had a mean of 21.1. That is, almost no difference between the two groups. However, as mentioned above there was no significant relation between PDT performance and AROS or DIAT respectively.
Performance demonstration test
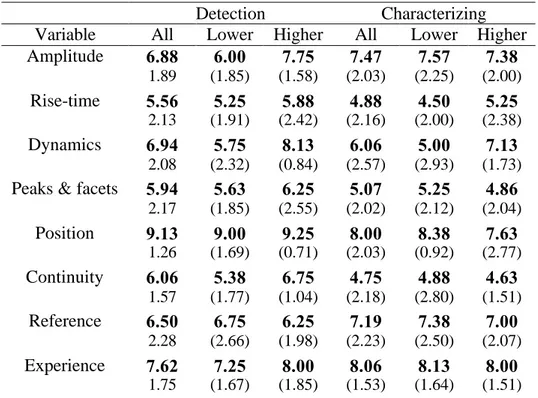
The operators assessed how important certain signal characteristics were for the discrimination of indications from further investigation (detecting) and for the description of indications to be reported (characterizing). In table 4 are presented means and standard deviations on these signal characteristics for all operators and the lower and higher performing groups respectively.
Table 4.Means (in bold) and standard deviations (in parentheses) for ratings of signal characteristics respective importance of whether or not do discard an indication (detection) and for describing an indication as a flaw or geometry (characterizing), from low to high (1-10). Presented for all operators, the lower and the higher performing groups respectively.
Detection Characterizing Variable All Lower Higher All Lower Higher Amplitude 6.88 6.00 7.75 7.47 7.57 7.38 1.89 (1.85) (1.58) (2.03) (2.25) (2.00) Rise-time 5.56 5.25 5.88 4.88 4.50 5.25 2.13 (1.91) (2.42) (2.16) (2.00) (2.38) Dynamics 6.94 5.75 8.13 6.06 5.00 7.13 2.08 (2.32) (0.84) (2.57) (2.93) (1.73) Peaks & facets 5.94 5.63 6.25 5.07 5.25 4.86
2.17 (1.85) (2.55) (2.02) (2.12) (2.04) Position 9.13 9.00 9.25 8.00 8.38 7.63 1.26 (1.69) (0.71) (2.03) (0.92) (2.77) Continuity 6.06 5.38 6.75 4.75 4.88 4.63 1.57 (1.77) (1.04) (2.18) (2.80) (1.51) Reference 6.50 6.75 6.25 7.19 7.38 7.00 2.28 (2.66) (1.98) (2.23) (2.50) (2.07) Experience 7.62 7.25 8.00 8.06 8.13 8.00 1.75 (1.67) (1.85) (1.53) (1.64) (1.51)
As can be seen in table 4 the operators in the lower performing group reports the amplitude, dynamics and continuity of the signal as comparatively less important for detection than the operators in the higher performing group do. The lower performing group rated dynamics significantly less important than the higher performing group (t= -2.73 p< .05). Also, the lower performing group put relatively less importance on experience than the higher performing group did. For characterizing, the continuity of the signal again was assessed less important for the lower performing group. The position of the indication had more importance for the lower performing group than for the higher performing group.
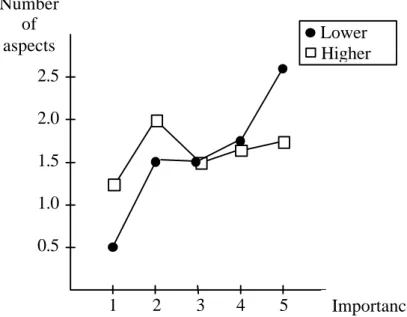
There can be different approaches to solving the same problem with the same clues. A tentative description of the strategies used by the two groups is presented in figure 3a (detecting) and figure 3b (characterizing). The operators assessed each of the eight signal characteristics from 1 to 10 (c.f., table 4), by plotting the assessments a tentative description of the operators’ strategy is made. The strategies where then superimposed to get group strategies. No operator used more than five levels of assessments, therefore, the characteristic given most importance was re-rated to 5 and the one given least importance re-rated 1 in the below figures.
As can be seen in figure 3a the operators in the two post hoc groups display different strategies towards the detection. The operators in the lower performing group had an uneven scatter of numbers of aspects of different importance with a few characteristics being most important and more characteristics being almost as important. The operators in the higher performing group took more aspects of higher importance and fewer aspects of lesser importance into account when detecting. For characterizing
the strategies were less diverse, both groups had a negatively skewed trend, with the lower performing group more so.
Figure 3a. Average numbers of signal characteristics in classes of importance, from 1 (least important) to 5 (most important) used in detecting by the lower performing group (dots) and the higher performing group (squares).
Figure 3b. Average numbers of signal characteristics in classes of importance, from 1 (least important) to 5 (most important) used in characterizing by the lower performing group (dots) and the higher performing group (squares).
1 2 3 4 5 0.5 1.0 1.5 2.0 2.5 Number of aspects Importance Lower Higher 1 2 3 4 5 0.5 1.0 1.5 2.0 2.5 Number of aspects Importance Lower Higher
Time spent
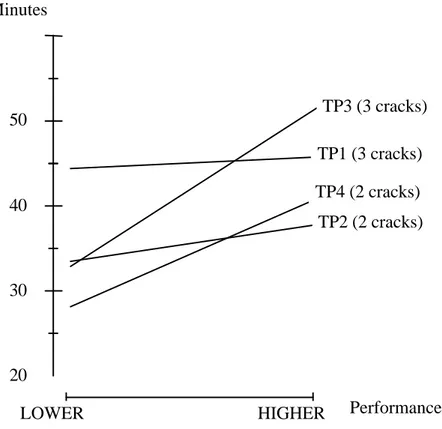
The time for each operator to complete detection and characterization were measured for each test-piece respectively. The differences in time used for detection between the two groups for the four test-pieces respectively are presented in figure 4a. The differences in time used for characterizing between the two groups for the four test-pieces respectively are presented in figure 4b.
Figure 4a. Time used for detection by the lower and higher performing groups for each of four test pieces (TP1-4) respectively.
The operators in the lower performing group spent (21%) less time detecting than the higher performing group did. For one test-piece (TP 3) the difference was as big as 20 minutes (t=-2.22 p< .05). The performance on this particular test-piece was almost equal for the two groups (92% hit-rate for the lower and 96% for the higher performing group). After correcting for the misses the difference between the two groups is slightly larger (22 minutes).
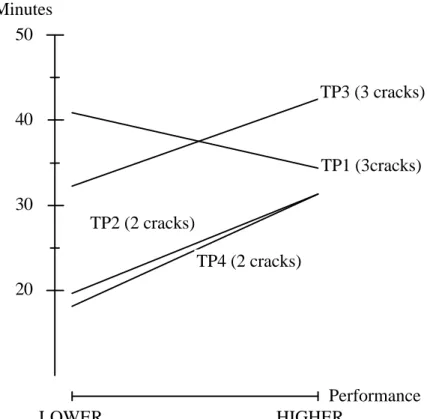
The operators in the lower performing group spent less time detecting than the higher performing group did (t= -2.22 p< .05). The operators in the lower performing group also spent less time characterizing the indications found than the higher performing group did (t= -2.41 p< .05). However, this difference almost entirely depends on the higher performing group having found more indications to characterize, thus spending more time checking the detection and characterizing the indications.
Performance 30 40 50 TP4 (2 cracks) TP2 (2 cracks) TP1 (3 cracks) TP3 (3 cracks) LOWER HIGHER Minutes 20
Figure 4b. Time used for characterization by the lower and higher performing groups for each of four test pieces (TP1-4) respectively.
Risks
The operators were also asked to assess the risks of making certain errors. Table 5 presents the assessments of these risks for manual UT in general and for the PDT.
Table 5. Assessments risks of making error, testing in general, as assessed by operators
In general PDT
Error All Lower Higher All Lower Higher Mixed A/B side 5.00 4.88 5.13 3.19 3.75 2.63
(2.25) (2.59) (2.03) (2.23) (2.49) (1.92) Other fault 3.88 3.75 4.00 3.75 3.88 3.63
(1.31) (1.04) (1.60) (1.65) (1.73) (1.69) X-way error 5.19 4.88 5.50 3.56 4.38 2.75
(2.29) (2.45) (2.20) (2.06) (2.50) (1.17)
As can be seen in table 5, the group of operators who performed better assessed the risks of making specific errors (i.e., switching A and B side, and measuring the X-distance “counter clockwise”) as much lower during the PDT. The lower performing group reported only slightly decreased risks of making the specific errors. For both groups the “other” category was almost unchanged (i.e., only a slight decrease in risk).
In conclusion, the personnel selection tests used in the present study did not predict PDT performance for the 16 operators whom participated. Motivation and attitude seem important predictors of performance. Dividing the operators (post hoc) into two groups
50 40 30 20 LOWER HIGHER TP4 (2 cracks) TP3 (3 cracks) TP2 (2 cracks) TP1 (3cracks) Minutes Performance
according to their PDT performance revealed some differences between lower and high performers. The most striking difference is the use of decision strategies for the detection and characterizing of indications. The difference in time spent inspecting for the two groups suggested the higher performing group as being more thorough.
Concluding remarks
In the present study it was hypothesized that experience and ability (as measured by the tests AROS and DIAT) would be related to inspection performance. However, no strong relationships were found, which in part would depend on the small number of operators and their prior experience with NDT work.
When making inferences from experiments and generalizing to real life, it is important to be aware of possible differences between the two settings. Among other things, the motivation of the individuals participating can differ between the real life and laboratory settings. In the present study operator performance in the PDT was almost as successful as for the qualification tests (see table 2). This can be interpreted as the operators taking the PDT (almost) as seriously as the qualification test. It can be argued that the operators try their very best when qualifying since passing the qualification test is important for them to keep their jobs. When performing inspections in other situations the level of operator performance is mostly unknown. We do not know how well the operators perform in nuclear power plants (NPP); we know that misses and false calls are made but only when they are discovered later through subsequent failures or inspections. When working in a NPP there are factors present that are not present when the operators are tested for qualification, and factors that might make the task more difficult in a plant (e.g., organizational and human factors). Thus it might be assumed that the performance in a NPP is poorer than in a qualification test.
In the present study there was only a small correlation between the results of the spatial ability test (AROS) and the performance demonstration test (rxy = 0.19 ns). The
correlation between the DIAT and the performance demonstration test was negligible (rxy = 0.01 ns.). DIAT was developed to assist in the early screening of non-experienced
operators. In the present study, however, DIAT was used on already skilled operators with a varying degree of experience in manual UT as mentioned earlier. There was a positive correlation between AROS and DIAT (rxy = 0.46 p<0.5). Since DIAT is a
dynamic test measuring, among other things, spatial ability, the above correlation would be expected.
Since ability and experience were poorly correlated with performance, a regression analysis was performed to see what could explain the variance in inspection performance in the present study. It was found that 55% of the variation in performance was explained by “confidence in self or the written procedure” and “positive attitude towards the use of the procedure” (UT01). This would be in line with Karimi’s (1988) findings and the findings in the PISC III study (Murgatroyd, 1994), stressing the role of motivational and contextual factors. Karimi means that the skill needed to perform an inspection can be acquired trough training; however, the motivation and the context must be adequate in order for the skill to be properly displayed. This is also in line with the findings of Berglund & Lindberg (1990) who after a principal component analysis found that successful operators find their job engaging. It should be noted that the strengths of the different causal directions in these relationships are not clear.
The strategy employed for solving a task can affect the outcome. In the present study the operators solved two tasks (detection and characterization) on four test pieces. The least well performing group indicated a few signal characteristics as most important for detection of a crack (see table 4 and figures 4a and 4b). The best performing group indicated a greater number of signal characteristics as most important for detection than the lower performing group. Using few aspects can be an efficient strategy for dealing with a complex decision but does not seem to be so here.
For characterizing a crack the strategies were reversed; the best performing group used a simpler strategy than the lower performing operators did. In contrast to detection, characterization is a more complex task. Still, the best performing group employed a simpler strategy using fewer cues. For the test pieces where the two groups had the same hit-rate (i.e., TP1 and TP3), the operators in the higher performing group used more time for characterizing than the lower performing operators did. This is an interesting finding.
Ability tests could be used to save money by aiding in the selection of the persons best suited for NDT work. But, as the present study shows, such tests may be hard to find. Conscientiousness is an important trait for operators, in addition to ability, skill, knowledge and experience that are usually tested. As mentioned above, a regression analysis showed “confidence in self or the written procedure” and “positive attitude towards the use of the procedure” that were positively correlated to PDT performance. The striking result of the use of different strategies for the two phases is interesting. It seems that it is most important to be thorough in the first phase (detection of a crack). Whilst the complex task of characterizing of a crack seems to benefit from the use of simpler strategies.
Based on the findings in the present study it is suggested that further studies be made on decision strategies used and their influence on inspection performance. It is also important to study the effect of organizational and human factors that might affect inspection performance. In particular time pressure is of interest due its presence during tests in nuclear power plants and the effect of time pressure on human performance.
ACKNOWLEDGEMENTS
This study was funded by grants from the Swedish Nuclear Power Inspectorate (SKI) to Anne Edland through Stockholm University. Many thanks to Arne Eriksson, Hans Lundberg, Lars Skånberg, Tommy Zetterwall, and of course to all the participants in the study.
List of definitions
AROS -A pen-and-paper test of spatial ability
DIAT -Dynamic Inspection Aptitudes Test, tests the potential of manual UT candidates EPRI -Electric Power Research Institute
HAZ -Heat Affected Zone, the zone that is heated during welding NDT -Non-destructive Testing
PDT -Performance Demonstration Test UT -Ultrasonic Testing
References
Berglund, U. & Lindberg, S. (1990). Human Reliability of Non Destructive Testing. Unpublished preliminary SKI-report.
Dickens, J.R. & Bray, D. (1994). Human Performance Considerations in Nondestructive Testing. Materials Evaluation. Vol. 51, No. 9 1033-1041.
Enkvist, J., Edland, A., & Svenson, O. (1999). Human Factors Aspects of
Non-Destructive Testing in the Nuclear Power Context: A Review of Research in the Field. SKI-Report 99:8
Harris, D.H., (1992). Effect of Decision Making on Ultrasonic Examination
Performance. Electric Power Research Institute: Palo Alto, California. EPRI Report
TR-100412
Harris, D.H & McCloskey, B.P. (1990). Cognitive correlates of ultrasonic inspection
performance. EPRI Report NP-6675.
Harris, D. & Spanner, J. Jr. (1998). Dynamic Inspection Aptitude Test (DIAT) User’s
Guide. EPRI TR-106304
Karimi, S.S. (1988). Human Factors Affecting the Performance of Inspection Personnel
in Nuclear Power Plants. Electric Power Research Institute: Palo Alto, California.
EPRI Report NP-6000
Kettunen, J. & Norros, L. (1996). Human and organizational factors influencing the
reliability of non-destructive testing. An international literary survey.
STUK-YTO-TR 103
Murgatroyd, R.A. (1992). Assuring Human Reliability for Effective Inspection. In W.E. Gardner (Ed.) Improving the Effectiveness and Reliability of Non-Destructive
Testing. Northern Research Laboratories United Kingdom Atomic Energy
Authority Warrington, UK
Murgatroyd, R.A. (1994). Human Reliability in Inspection, Final Report on Action 7 in
the PISC Programme, PISC III Report 31. Nuclear Energy Agency.
Skånberg, L. (1994). Kvalificering av OFP-system. SKI Rapport 94:25 [In Swedish] Spencer, F. & Schurman, D. (1986). Reliability assessment at airplane inspection
facilities, Vol III: results of an eddy current inspection reliability. Report No. DOT/FAA/CT-92/12, III
APPENDIX
Below are presented the questions asked by the interviewer (bold) and a summary of the operators’ answers to the questions. (Both questions and answers are translated from Swedish to English).
How would you describe a skilled operator?
A skilled operator is an experienced operator who plans his work well and who works thoroughly and systematically. Most operators also mentioned being able to keep ones concentration and to cope with radiation.
How do you think one can increase ones skill in manual UT?
Most operators held training and education as necessary for development. Some operators emphasized actual experience throughout the year (not only just before outages) as important. Other operators emphazied meeting new problems, making mistakes and learning from them. Many operators meant that operators meeting and sharing problems and solutions could improve skill. There was also put forward a wish to receive feedback on their work in the field.
Which indications are most difficult?
Signals from close to the weld-root were held as the most difficult signals. The operators meant that it can be very difficult to assess exactly were the centre of the weld is, this means you have to be very thorough with the measurements.
Which factors make UT “unreliable”, that is, varying results despite identical training, equipment and procedure?
The most frequent factors were “poor calibration” and “poor contact” (between transducer and material). The working environment and the human factor were also mentioned, as was the difficulty to locate the centre of the weld.
Do you experience different levels of confidence in your reporting?
Ten of the 16 operators reported to experience different levels of confidence (some only marginal). Three of the four operators who never experience different levels of confidence were among the operators who performed below average in the PDT.
If you knew that you were testing in a high radiation area, would the result be affected?
All operators held that test results might be affected negatively by the operator being aware of testing in a high radiation area. Three operators meant that the test result could be negatively affected and three other operators meant that the result would be negatively affected by testing in a high radiation area. Six operators meant that the effect is only marginal and four operators meant that it would only happen with other operators, not themselves.
What support is provided by the procedure (UT01)?
Most operators agreed that the procedure was a support. They saw it as a set of rules to follow and a decision aid, particularly for characterizing. The procedure relieves the operator of responsibility; the result is not a result of personal opinion.
What obstacles come with following the procedure?
The critique from the operators was coherent. They meant that the procedure is a bit too formal, they consider it rigid and the operators also feel the procedure limits the testing. However, the operators did not see the procedure as an obstacle, they feel the pro’s outweigh the con’s.