Technical Memorandum No. 4
Wyoming State Geological Survey
Thomas A. Drean, Director and State Geologist
Prepared for the Wyoming Department of Environmental Quality
Laramie, Wyoming
2013
A Guide to Geologic Carbon Sequestration: Science,
Technology, and Regulatory Framework
by
The WSGS encourages the fair use of its material. We request that credit be expressly given to the “Wyoming State Geological Survey” when citing information from this publication. Please contact the WSGS at 307- 766-2286, ext. 224, or by email at wsgs.sales@wyo.gov if you have questions about citing materials, preparing acknowledgments, or extensive use of this material. We appreciate your cooperation.
Individuals with disabilities who require an alternative form of this publication should contact the WSGS. For the TTY relay operator call 1-800-877-9975.
Funding for this project was made possible through a Federal Abandoned Mine Lands Grant (CFDA 15.252) provided by the U.S. Department of Interior, Office of Surface Mining, and administered by the Wyoming Department of Environmental Quality.
Suggested citation:
Myers, J.D., 2013, A guide to geologic carbon sequestration–Science, technology, and regulatory framework: Wyoming State Geological Survey Technical Memorandum No. 4, 197 p., at http://www.wsgs.uwyo.edu/ research/energy/co2.aspx
Cover: Western Owl Creek Mountains, Fremont County Wyoming. Photo by Robert Kirkwood.
Director and State Geologist Thomas A. Drean
Editing by:
Mary Kate McCarney
Design and layout by:
Brendon Orr
A Guide to Geologic Carbon Sequestration: Science, Technology, and
Regulatory Framework
Technical Memorandum No. 4
Prepared for the Wyoming Department of Environmental Quality
This publication is also available online at:
http://www.wsgs.uwyo.edu/research/energy/co2.aspx
Wyoming State Geological Survey
A Guide to Geologic Carbon Sequestration:
Science, Technology, and Regulatory
Framework
Technical Memorandum No. 4
June 2013James D. Myers
Department of Geology and Geophysics
University of Wyoming
Laramie, Wyoming
This report was prepared under contract for the Wyoming Department of Environmental Quality by the Wyoming State Geological Survey.
TAbLE oF CoNTENTS
Table of ConTenTs ... ii
lisT of figures ... v
lisT of Tables ... vii
ChapTer 1: inTroduCTion ... 1
ChapTer 2: Carbon CapTure and sTorage (CCs) overview ... 5
introduction ... 6
overview ... 6
Co
2Chemistry and physics ... 8
Carbon Capture ... 11
overviesw ... 11
power plan Technological varients ... 11
separation Mechanisms ... 16
efficiency penalty ... 21
Carbon Transport ... 22
pipelines ... 24
ship ... 26
Carbon storage ... 27
Mineral Carbonation ... 27
oceanic sequestration ... 33
geologic Carbon sequestration (gCs) ... 36
summary ... 43
ChapTer 3: geologiC Carbon sequesTraTion (gCs) ... 45
site Characterization ... 46
project Timeline ... 48
Co
2leakage risk ... 51
summary ... 52
ChapTer 4: u. s. environMenTal laws iMpaCTing CCs ... 55
historical Context ... 56
safe drinking water act (sdwa) ... 58
historical background ... 58
act and amdendments ... 59
Major Components and programs ... 61
relevance to gCs ... 61
Clean air act (Caa) ... 61
historical background ... 61
acts and amendments ... 62
Major objectives, Components, and programs ... 63
relevance to gCs ... 64
Clean water act (Cwa) ... 67
historical background ... 67
acts and amendments ... 67
Major objectives, Components, and programs ... 68
summary ... 69
ChapTer 5: sdwa: underground injeCTion ConTrol (uiC) prograM ... 71
overview ... 72
well Classes ... 72
Class i ... 73
Class ii ... 76
Class iii ... 76
Class iv ... 78
Class v ... 79
Class vi ... 79
primacy: federal vs. state Control ... 80
summary ... 80
ChapTer 6: an oil & gas well priMer ... 83
drilling ... 84
percussion drilling ... 85
rotary drilling ... 85
well Configurations ... 89
well Construction ... 91
Casing... 93
Cementing ... 95
Cementing problems ... 97
Testimg ... 98
well Completion ... 99
well Completion Components ... 99
bottomhole Completion ... 104
upper Completion ... 105
well Mechanical integrity (Mi) ... 107
internal Mechanical integrity ... 107
external Mechanical integrity ... 108
well abandonment ... 112
isolation ... 113
p&a operation ... 113
potential well leakage pathways ... 116
wyoming oil and gas regulations ... 116
wogCC ... 116
drilling regulations (wogCC Chapter 3) ... 116
environmental regulations (wogCC Chapter 4) ... 118
plugging and abandoning regulations (wogCC Chapter 4) ... 118
summary ... 119
ChapTer 7: Class vi wells: The Carbon sequesTraTion well Class... 121
Class vi rationale ... 122
general background ... 122
rulemaking history ... 122
Class vi guidance documents Class vi ... 125
The Class vi rule... 126
overview ... 126
permit application process and elements ... 127
project plan development ... 129
1ntroduction ... 129
area of review and Corrective action plan ... 131
Testing and Monitoring plan ... 132
injection well plugging plan ... 133
post-injection site Care (pisC) and site Closure plan ... 133
emergency and remedial response (err) ... 134
site Characterization ... 134
area of review and Corrective action ... 135
Computational Modeling ... 136
delineating the area of review (aor) ... 138
artificial penetratations and Corrective action ... 143
aor re-evaluation ... 148
Testing and Monitoring ... 149
overview ... 149
Testing and Monitoring plan ... 149
Mechanical integrity Testing ... 150
operational Testing and Monitoring ... 152
groundwater water quality and geochemical Monitoring ... 155
plume and pressure-front Tracking ... 156
reporting and recordkeeping ... 160
injection well plugging ... 161
purpose... 161
injection well plugging plan ... 161
preparation for plugging ... 162
well plugging ... 164
plugging report ... 166
post-injection site Care (pisC) and site Closure ... 167
pisC ... 167
site Closure ... 168
emergency and remedial response ... 169
other permit requirements ... 170
well Construction and mechanical integrity ... 170
operational plan ... 174
depth waiver ... 175
state primacy ... 176
summary ... 176
ChapTer 8: suMMary ... 179
referenCes ... 184
appendix a: aCronyMs ... 189
appendix b: epa TerM definiTions ... 191
LiST oF FiGuReS
1. fundamental Components of CCs
2. CCs Material and energy flows
3. Chemical structure of Co2
4. generic and Co2 phase diagrams
5. Co2 density-pressure relationships
6. Co2 density vs. depth
7. Temperature-Composition phase diagram
8. Co2 Temperature-Composition diagram
9. global Map of large stationary sources of anthropogenic Co2
10. power plant Technology Choices
11. Combustion process inputs and outputs
12. post-Combustion Capture of Co2
13. pre-Combustion Capture of Co2
14. oxyfuel Combustion process
15. Carbon separation and Capture options
16. Co2 absorbent Capture
17. Co2 adsorption Capture
18. gas absorption of Co2
19. Cryogenic Co2 Capture
20. Carbon Capture energy penalty
21. Co2 Transport overview
22. Major u.s. Co2 pipelines
23. stages in Co2 ship Transport
24. offshore Co2 sequestration
25. ex-situ Mineral Carbonation process Chain
26. global distribution of Mafic and ultramafic rocks
27. uptake of Co2 emissions by surface Carbon reservoirs
28. Co2 depth-Temperature phase diagram
29. seawater and Co2 density as a function of depth
30. proposed ocean sequestration sites
31. primary geologic Carbon sequestration reservoirs
32. oil well production Curve
33. enhanced oil recovery: Co2 flood
34. enhanced oil recovery: huff-and-puff
35. Co2 Trapping Mechanisms importance vs. Time
36. Cleat system in Coal
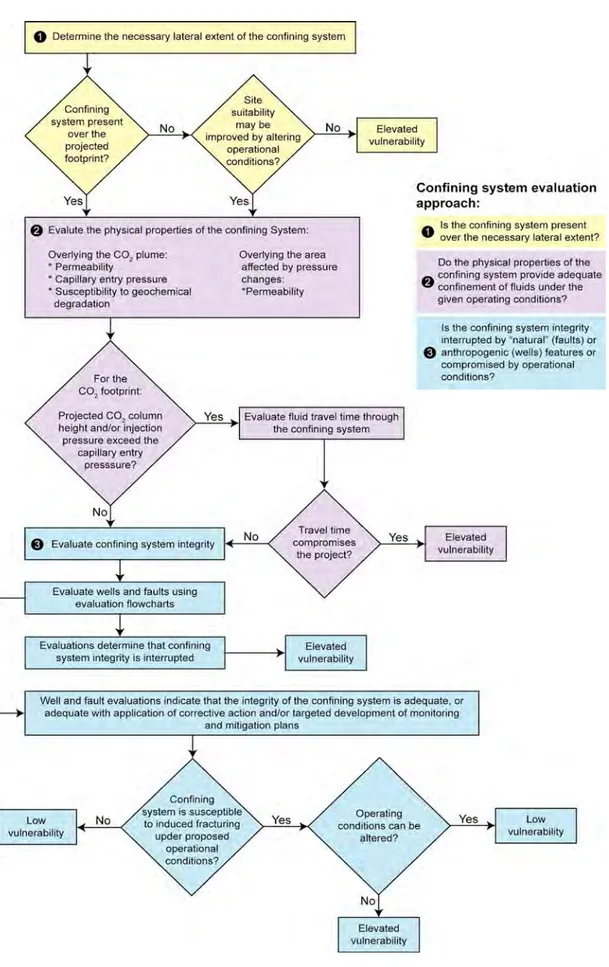
37. Components of geologic Carbon sequestration project
38. epa geologic sequestration site evaluation flowchart
39. epa flowchart for evaluating Confining Zone
40. stages in a gCs project
41. potential Co2 leakage paths
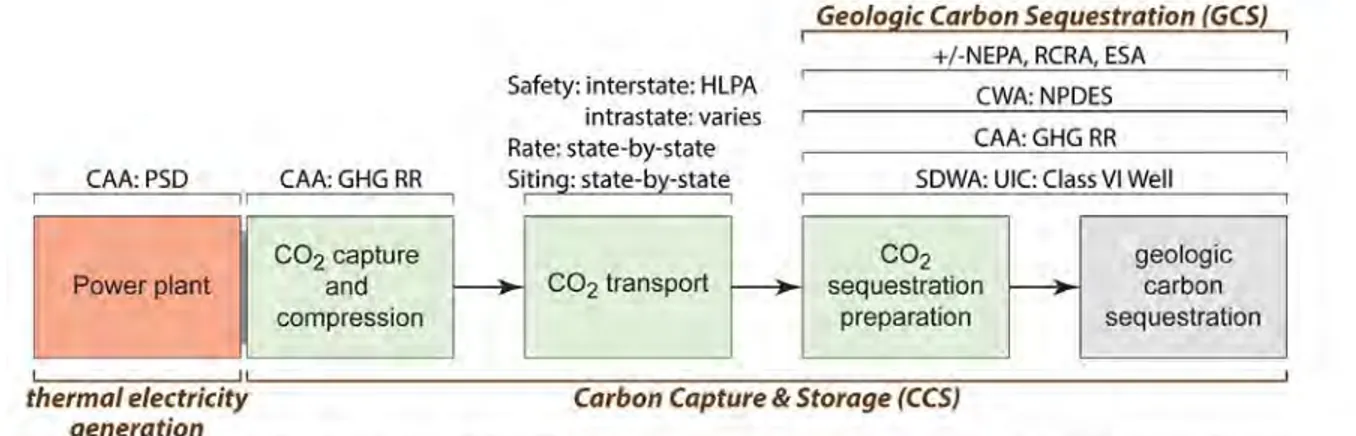
42. u.s. environmental laws and gsC stages
43. smokestack pollution prior to passage of the Clean air act
44. u.s. environmental law Timeline
45. epa regions
46. safe drinking water act Timeline
48. Clean water act Timeline
49. uiC program Timeline
50. uiC well Classes
51. in-situ uranium Mining well field
52. uiC primacy Map
53. rotary drill rigs: Major Components
54. rotary rig: drill string
55. stacked drill pipe
56. oil and gas well orientation
57. horizontal wells: radius of Curvature
58. well Casing stages
59. Casing stresses
60. well Casing design
61. setting and Cementing Casing: primary Cementing
62. potential primary Cementing problems
63. Cement bond and variable density logs
64. Coiled Tubing operations
65. packer assembly
66. packer Types
67. a beam pump
68. bottomhole Completion Types
69. bottomhole Completions: Cemented and Cased wells
70. photograph of a wellhead
71. radioactive Tracer survey
72. Temperature log
73. noise log
74. well plugging locations
75. Cement plug failure
76. wyoming’s energy basins
77. epa’s Class vi development strategy
78. Class vi rulemaking Timeline
79. aor example
80. well application workflow
81. workflow for amending project plans
82. Components of a Computational 3d geologic Model
83. Conceptual Model of a hypothetical sequestration site
84. schematic illustration of pressure front Concept
85. Calculation of Minimum formation pressure
86. Contouring of pressure front for a hypothetical sequestration site
87. Marking boundary of Co2 plume for a hypothetical sequestration site
88. delineating the aor for a hypothetical sequestration site
89. Magnetic survey of abandoned wells
90. schematic diagram illustrating usdw endangerment due to improperly plugged wells
91. decision Tree for identifying wells needing Corrective action
92. aor re-evaluation: Comparison of predicted results and Monitoring data
93. aor re-evaluation: revised aor Compared to original aor
94. Testing and Monitoring Timeline
95. injection well Mechanical integrity
97. Class vi well plugging stages
98. bridge plug
99. balance Method of plug emplacement
100. retainer Method of plug emplacement
101. Two plug Method of plug emplacement
102. aor revision
103. Class vi well schematic
104. Caliper log Tool
LiST oF TAbLES
1. Carbonate Mineral properties
2. potential sources of divalent Cations: silicate Minerals
3. api Cement Classes
4. example of area of review and Corrective action plan well Tabulation
5. Methods for Testing the Mechanical integrity of an abandoned well
6. Class vi Monitoring requirements
Chapter 1
i
n recent years, carbon capture and storage (CCs) has been advocated as a means to continue using fossil fuels until carbon-free energy systems are developed while at the same time reducing anthropogenic carbon emissions (ipCC, 2005).CCs entails capturing carbon dioxide (Co2) from
fossil fuel combustion and sequestering it from the atmosphere for thousands to hundreds of thousands of years. storage can be accomplished through mineral carbonation, ocean storage, biological storage, or geologic storage. for a variety of reasons, geologic carbon sequestration (gCs) is the technology that can be deployed in the shortest timeframe while capturing significant amounts of
Co2.
for the last several years, the united states has actively pursued geologic carbon sequestration as a means to continue using its abundant fossil fuel resources, especially coal. Toward this end, the u.s. department of energy (doe) has funded considerable research on all stages of the gCs implementation chain while the environmental protection agency (epa) has developed the environmental regulations under which large
volumes of Co2 can be captured from a stationary
point source and safely injected into the subsurface for long-term sequestration.
This publication is intended as an introduction for citizens, regulators, and policy-makers to the regulatory framework that is under development in the united states and wyoming to ensure that geologic carbon sequestration is carried out safely and in a manner that protects human health and the environment. in particular, this publication focuses on the new regulations the epa and the wyoming department of environmental quality (wdeq) have developed to oversee geologic carbon sequestration under the safe drinking water act’s underground injection Control (uiC) program. specifically, this publication concentrates on the new Class vi geologic sequestration injection well classification. The intention of this publication is to assist all stakeholders in understanding geologic carbon sequestration and the risks and benefits associated with this particular carbon emission reduction strategy.
a thorough understanding of the new
regulation requires not only knowledge of the rule itself, but an appreciation for the larger context
within which the Class vi well class was developed and will operate. Thus, this publication lays out the basics of carbon capture and storage. it looks at the unique character of geologic carbon sequestration, which will be most relevant for wyoming
stakeholders. a background summary of the safe drinking water act (sdwa) and its attendant uiC program is provided to allow the reader to place the new Class vi well in a broader context of how the sdwa legislation and its accompanying regulations protect the nation’s underground drinking water sources. Class vi well regulations center, to a large degree, on the potential for
leakage of Co2 from geologic formations. since
oil and gas wells are one of the main factors in potential leakage, a brief discussion describes how oil and gas wells are drilled, constructed, completed, and abandoned. with this background, the details of the Class vi well regulation are examined.
To effectively reduce anthropogenic Co2
emissions, CCs will have to be deployed commercially on a global scale. This deployment will be exceedingly complex, because CCs represents the merging of a number of seemingly unrelated scientific, engineering, and technical disciplines with a variety of other professions, such as legal, business, etc. even within a single profession, the ranges of expertise required to understand the details of different components of the CCs chain are varied. for instance, geologic carbon sequestration draws on the sciences of chemistry, physics, and geology among others. similarly, relevant engineering fields are as varied as gas handling, combustion technologies, and oil and gas well construction. once engineered, a CCs technology must meet regulatory guidelines; its operation must be economically viable and meet certain legal statutes, e.g., issues of pore space ownership. given this breadth of perspectives, it is not surprising that few individuals, regardless of profession, understand all the details of the entire CCs technology chain.
given the wide range of stakeholders this publication is intended for and its broad subject matter, it is unlikely that any one reader will be well versed in all topics. Thus, this report has introductory material incorporated into each content area to guide the reader through these
possibly unfamiliar subjects. for example, in
discussing the chemistry of Co2, phase diagrams
are explained, so the discussion of the phase
relations of injected Co2 and its implications
for project design, safety, and monitoring can be understood by the non-specialist. likewise, the regulatory section provides an overview of environmental laws before investigating the details of the safe drinking water act’s uiC program. equipped with this background information readers can effectively assess the various claims and counterclaims about CCs.
Chapter 2
Carbon Capture and Storage
(CCS) Overview
introduction
fossil fuels currently supply over three quarters of the world’s primary energy, energy consumption and demand are growing, and
fossil fuel combustion adds to atmospheric Co2
levels. The world community is seeking a means of using fossil fuels while limiting the emission
of anthropogenic Co2 from these essential fuels.
although no single change in our energy system
will reduce Co2 emissions to what are viewed
by many as ‘safe’ levels (pacala and socolow, 2004), carbon capture and storage (CCs) is one potential bridging technology from our current carbon-intensive energy system to a lower carbon energy system. CCs may provide a means of
reducing anthropogenic Co2 emissions while
using the world’s abundant fossil fuel resources to supply a growing global demand for energy. Carbon mitigation strategies, like CCs, also allow maintenance of a diversified energy portfolio in which fossil fuels play an important role, while allowing continued leverage of the existing energy infrastructure, a global, multi-trillion dollar investment.
The world’s reliance on fossil fuels as a primary energy source (pes) has reduced the residence time of carbon in the lithosphere. in essence, human activities have significantly altered the carbon cycle by augmenting the carbon flux between the lithosphere and atmosphere and changed the amount of carbon in both the atmosphere and upper ocean by burning large amounts of fossil fuels (orr and others, 2005). for any business-as-usual energy future, this flux will continue to grow
in size to produce even higher atmospheric Co2
concentrations. Climate models suggest high levels
of Co2 may lead to catastrophic climate change
(lenton and others, 2008).
given the world’s growing energy demand (bazilian and others, 2010) and the impact such
energy use will have on Co2 emissions, what can
global society do to reduce its carbon footprint? at least three possible responses exist: 1) ignore the problem, 2) stop using fossil fuels, or 3) reduce
future Co2 emissions. since the first option has
potentially dire consequences and the second option would end modern civilization, humanity must, over both the short- and long-terms, work to reduce carbon emissions from energy production.
what are the best approaches to reducing emissions and how are the benefits and risks of reduction equitably and justly shared among nations? one approach that has been suggested is CCs (pacala and socolow, 2004; ipCC, 2005).
overview
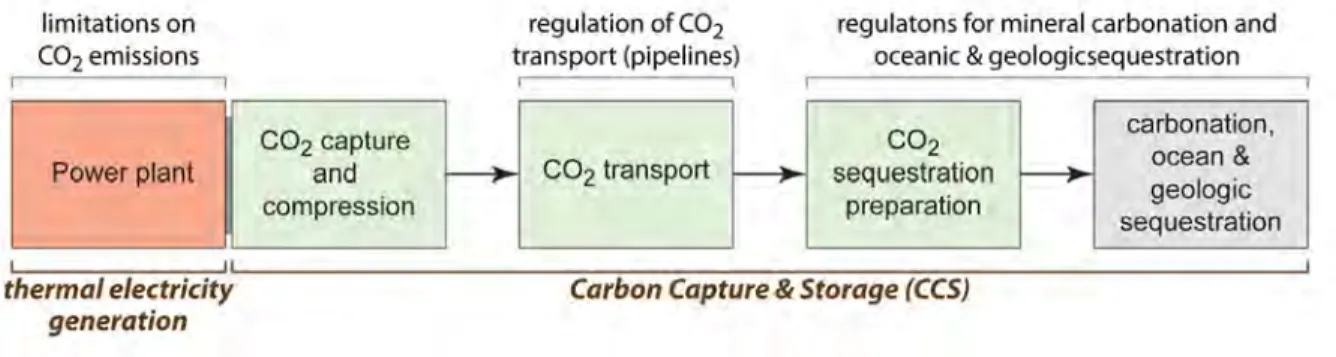
Carbon capture and storage is an industrial process that can be incorporated into new fossil fuel-fired industrial facilities or retrofit onto existing facilities with the correct combination of physical, technological, and economic conditions. CCs consists of three separate components each utilizing a different set of technologies: capture, transport, and storage (fig. 1). Capture refers to
the separation of Co2 from a source. Most current
research focuses on a gas stream produced by the combustion of fossil fuels. once captured and
compressed, supercritical Co2 is transported from
its source to a storage site. Transportation is likely to be predominantly by pipeline, although as this industry grows, transport may also occur by ship.
finally, the Co2 is stored such that it will remain
isolated from the atmosphere for thousands of years.
all technologies required for capture, transport, and storage are currently available on a commercial scale. however, they have never been combined together on the spatial, temporal, and mass-transfer scales that will be required if CCs is to contribute significantly to the reduction of
anthropogenic Co2 from fossil fuel combustion.
on this scale, there are also economic, legal, regulatory, political, and social (to name just a few) barriers that must be overcome if CCs is to be a viable carbon emissions reduction strategy (Keith and others, 2005; wilson and others, 2008; Terwel and others, 2011).
To understand the ramifications of any CCs scheme, comparing a complete CCs facility to a conventional thermal electricity generation plant is useful. such a comparison illustrates the changes in process inputs and outputs of a system (power or industrial plant) that are critical when an industrial facility is fitted with CCs capabilities. a ‘simple’ power plant has three inputs and two primary outputs (fig. 2). The inputs include the fuel necessary to power the process, an oxidant, and any other materials, such as water, chemicals,
etc., needed for the process. outputs consist of the produced product (energy or other industrial product) plus emissions to air, water, and land that may be generated by the plant. These emissions may be gas, liquid, solid, or a combination of all three depending on the facility of interest.
The carbon capture and storage technology added to a basic industrial facility is a three component industrial process that has a large
spatial footprint. at the start of this chain, Co2
from combustion is captured at an industrial facility, either through a pre- or post-combustion
process. in post-combustion capture, Co2
contributes only a small percentage of the flue stream (<15 percent), so capture is an energy
intensive process. The captured Co2 is compressed
until it reaches a supercritical state, thereby
significantly increasing its density and reducing its volume. although expensive in terms of energy, compression reduces the volume of gas requiring transport and ultimately storage. after compression, the supercritical fluid is transported to a storage site. The three potential storage methods discussed most frequently are oceanic sequestration (ohsumi, 1995; ozaki, 1997; herzog, 1998; ; ozaki and others, 2001; adams and Caldeira, 2008), geologic sequestration (benson and Cole, 2008), and mineral
carbonation, or chemically reactions that combine
Co2 gas with metals to produce carbonate minerals
(lackner and others, 1995; oelkers and others, 2008; Khoo and others, 2011; renforth and others, 2011). all three options are designed to
isolate Co from the atmosphere for thousands of
Figure 1. The three fundamental components of carbon capture and storage are Co2 capture and compression, transport, and storage. storage can be via carbonation, ocean or geologic sequestration. (Copyright j.d. Myers. used with permission.)
Figure 2. Material and energy flows for a carbon capture and storage system at a thermal power plant. (Copyright j.d. Myers. used with permission.)
years.
The capture, transportation, and storage of
Co2 make the energy system, i.e. the power plant,
much more complex because of the additional equipment and industrial processes. at the same time, the sequestration infrastructure requires additional power for operation. Thus, either the output of the plant will be lowered because of this need or the plant must be expanded to produce the same amount of deliverable product, e.g., electricity, cement, etc. in the case of plant expansion, additional energy is necessary to power
the plant. in addition, a new output (stored Co2)
is added to the system.
Co2 Chemistry and Physics
understanding the various stages of CCs requires an appreciation of the chemistry and physics
of Co2. at standard temperature and pressure
(sTp), carbon dioxide is a colorless, non-flammable gas. when present in low concentrations, it is also odorless, but as the concentration rises it develops a
sharp, acidic odor. Co2 is only moderately reactive.
Most importantly, Co2 has a density 1.5 times
that of air (1.98 kg/m3) at sTp. Carbon dioxide
comprises about 0.039 percent of the gases that make up the earth’s atmosphere. Carbon dioxide concentration, however, varies seasonally particularly in the northern hemisphere, and has been increasing
during historic times. at sTp, Co2 is dangerous
to animal life and at concentrations greater than 50,000 ppmv, or about 5 percent, and can be lethal.
Chemically, Co2 is a linear molecule with
a single carbon atom and an oxygen atom on either side (fig. 3a). because of this physical
arrangement, Co2 lacks an electrical dipole like
water. The carbon and oxygen are held together by covalent, double bonds (fig. 3b). carbon dioxide is, therefore, fully oxidized, making it non-flammable and not particularly reactive. because of
these characteristics, Co2 behaves chemically very
different from h2o, the other dominant dioxide
molecule on earth.
like all substances, Co2 behaves differently
at different temperature-pressure conditions. such behavior is summarized by phase diagrams, or plots of temperature versus pressure that show the pressure-temperature combinations at which
solid, liquid, gas, and supercritical fluid are stable (fig. 4a). although there are different ways of constructing phase diagrams, one common configuration plots pressure on the vertical axis and temperature on the horizontal. Many phase diagrams plot pressure in bars and temperature in degrees celsius. one bar is approximately equal to one atmosphere, the pressure the atmosphere exerts on a surface at sea level.
all phase diagrams define four distinct phase regions, each representing a stable phase (fig. 4a). at any temperature-pressure (T-p) combination within each field, a single phase is stable. The phase regions are separated by lines, or phase boundaries, along which two phases, such as gas + solid, co-exist in equilibrium. phase boundaries also mark the positions of reactions between the phases, i.e., melting of a solid to produce a liquid when temperature is increased or condensation of a gas to a liquid as the system is cooled. at low
temperature and pressure, Co2 gas is the stable
phase so the gaseous region exists below the solid-gas (sublimation/condensation reaction curve) and liquid-gas (evaporation/precipitation reaction curve) phase boundaries. along the solid-gas curve, solid sublimates to gas as temperature rises (gas converts directly to solid [deposition] as pressure increases). at any temperature-pressure pair along this phase boundary, both solid and gas phases coexist in equilibrium. above the solid-gas boundary and to the left of the solid-liquid curve, only solid is stable. in the upper middle part of the phase diagram between the lower liquid-gas and upper solid-liquid fields, lies the region where liquid is stable.
on phase diagrams, two points are of special interest: the triple point, where three phases (solid, liquid, and gas) coexist simultaneously and the
Figure 3. Chemical structure of Co2. (a). Co2 is a linear molecule with a central carbon atom (black) sandwiched between two oxygen atoms (red). (b) Carbon is bonded to each of its oxygen atoms by a double, covalent bond.
critical point (fig. 4a). a fourth phase region occurs to the right and above the critical point. in this T-p region, a substance acts as a supercritical fluid. a supercritical fluid has properties
intermediate between a gas and a liquid. for example, if a container is filled with a supercritical fluid, it will expand to fill the entire container (as a gas would), but its density will be closer to that of a liquid than a gas. supercritical fluids also have gas-like viscosity, liquid-like compressibility, and a liquid-like solvent behavior.
on the Co2 phase diagram, the temperature
axis varies from -140oC to +100oC, whereas
pressure ranges from 0.001 bars to 10,000 bars (fig. 4b). Carbon dioxide’s critical point occurs at
31oC and 73.9 bars (1,085 psi). at one bar, solid
Co2 sublimates to a gas at approximately -78oC.
for Co2, the triple point, or the phase assemblage
of solid, liquid, and gas, occurs at -56.5oC and 5.1
bars. The critical point, above which Co2 occurs
as a single supercritical fluid, occurs at 31oC and
73.9 bars (fig. 4b). in the subsurface, temperatures
and pressures above Co2’s critical point are found
below depths of about 800 meters. supercritical
Co2 has a density only half that of water, so it
is buoyant in a water-Co2 mixture. Thus, when
mixed with water, supercritical Co2 will rise
upward. This latter point is important because
it plays an important role in how Co2 behaves
physically during geologic carbon sequestration
(see Carbon storage section later in this chapter).
supercritical Co2 is used extensively in a variety
of industrial applications including use as solvents and cleaners. recent research has investigated
using Co2 as the working fluid for heat engines,
particularly nuclear reactors, but also enhanced geothermal energy systems.
another important property of Co2 that
must be considered for carbon capture, transport,
and storage is how the density of Co2 changes
with pressure (fig. 5). on a plot of density versus pressure, the saturation line stretches from the critical point to lower pressure and higher density
until it terminates at the triple point of Co2.
along this line, density increases from slightly
below 600 kg/m3 to just less than 1200 kg/m3.
Temperature contours on the diagram increase in temperature from left to right and display distinctly different characteristics above and below the saturation curve. in the gas field, density increases rapidly with only small changes in pressure (fig. 5). as is to be expected, the more incompressible liquid shows only small increases in density over a large pressure range. supercritical fluids have significantly lower densities than liquid, but greater than gas. These relationships will be a fundamental
role in determining how Co2 is transported and
stored (see Carbon Transport and storage sections later in this chapter).
because pressure correlates to depth, in both a
Figure 4. (a) generic phase diagram showing the important relations and features of such a diagram. (b) Co2 phase diagram showing the locations of its four important phase fields and its triple and critical points. (Copyright j.d. Myers. used with permission.)
geologic and an oceanic sequestration site, another
important physical characteristic of Co2 is how its
volume changes with depth. as depth increases, density increases and the volume occupied by the
same mass of Co2 decreases (fig. 6). This volume
reduction is important because injecting Co2
underground means the same amount of gas will
require less storage space. That is, more Co2 can be
injected into a smaller reservoir volume at greater depths. The smaller volume means that a deeper
geologic reservoir can store a greater mass of Co2
than a shallower reservoir with the same porosity (ipCC, 2005).
in oceanic and geologic sequestration,
supercritical Co2 will be injected either directly
into seawater or into pore spaces filled with formation water, which is typically a brine. The manner in which these two compositionally distinct fluids interact is important in determining physically how the system will behave over time. These relationships are best illustrated by plotting temperature (vertical axis) versus composition (horizontal axis) at some fixed pressure (fig. 7). The compositional axis plots the proportion of the two end member compositions in either mole percent or weight percent. because it is a mixture of only two end members (a binary mixture), the compositional axis shows the percentage of one end member composition as its abundance changes from 0 to 100 percent. since it is a binary mixture, the amount of the other end member varies from 100 to 0 percent in the opposite direction (fig.
7). if the two end members mix to form a single liquid, meaning they are miscible across the entire compositional range, the diagram shows a single field of one liquid or fluid phase.
if the liquids are immiscible and do not mix to form a single phase, a miscibility gap extending across the compositional range of immiscibility will appear on the diagram. outside of the gap toward either compositional extreme, a single fluid exists. inside the gap, the two separate fluids will exist, like water and oil. as temperature increases, the compositional range of the immiscibility gap decreases until eventually it closes entirely (fig. 7). again to use the water-oil analogy, heating an oil-water mixture to sufficient temperature will cause the two liquids to form a single liquid phase. armed with the basics of this type of diagram, the
interaction between water and injected Co2 can
be quantitatively investigated. Miscibility is also a function of pressure. depending on the solution, the gap will either widen or thin as pressure is increased.
at 1,500 bars, Co2 and water are immiscible,
that is they do not mix to form a single liquid but form a mixture of two different liquid phases (fig. 8a; Kaszuba and others, 2006). This behavior is the same as that of oil and water at normal temperatures and pressures. at temperatures below
275oC, a miscibility gap exists toward the water
Figure 5. density-pressure relations contoured for
temperature. (Modified from dnv, 2010) Figure 6. depth versus Co2 density plot showing the decrease
in the volume occupied as density increases with depth. The smaller volume means that a deeper geologic reservoir can store a greater mass of Co2 than a shallower reservoir with the same porosity. (Modified from ipCC, 2005)
side of the diagram. outside this gap on the high water side, a single water-rich liquid exists whereas
a high-Co2 liquid exists on the opposite side of the
gap. in the gap itself, a Co2 liquid and water will
coexist simultaneously. as temperature increases,
the gap narrows until it finally closes above 275oC
(fig. 8a). Thus at temperatures above 275oC and
1500 bars, there will be a single Co2-h2o liquid
phase.
The nature of the miscibility gap between
water and Co2 is not only a function of
temperature and pressure, but water composition as well (Kaszuba and others, 2006). in deep geologic formations, the fluid present is likely to be a brine, i.e., water with total dissolved solids (Tds) much higher than pure water. when six weight percent naCl is dissolved in the water (now a brine) phase, the miscibility gap expands outward and upward (fig. 8b).
even at temperatures of 300oC, the miscibility
gap extends from about 10 mole percent to
approximately 95 percent Co2. regardless of
temperature or salt content, two fluids will exist
simultaneously until Co2 chemically dissolves
into the dominant water-rich (brine) phase, which is a slow process on a reservoir scale.
This behavior is important because initially in oceanic and geologic sequestration, the storage reservoir will be characterized by the presence
of two different phases with different densities.
because it is lighter, Co2 will rise upward following
any path to the surface. This raises serious issues
about how effectively Co2 will be trapped
underground and for how long (see Carbon storage section later in this chapter).
Carbon Capture Overview
The first step in the CCs chain is carbon
capture. That is, the capture of Co2 from some
type of industrial source. Currently, most practical
targets for Co2 capture are the gaseous exhaust
streams produced by the combustion of fossil fuels. although such streams are produced by a variety of economic activities, e.g., transportation, industry, commerce, etc., the least challenging with respect to current capture technologies are stationary sources, such as electricity generators, iron and steel mills, cement plants, refineries, or natural gas-processing facilities. about 75 percent of the global
Co2 emissions are, in fact, from such sources.
Most of these types of large (> 0.1 million tons
Co2/yr), stationary Co2 sources around the world
are concentrated in developed nations, such as, europe, the eastern part of united states, as well as in the emerging economies of asia, i.e., China (fig. 9).
in terms of electricity generation, thermal power plants may be fired by coal, natural gas, petroleum, or biomass. given the small number of biomass-burning power plants, the limited generation of electricity by petroleum in the developed world, and the low emissions of natural gas plants, the logical choice for early capture efforts is coal-fired power plants. because of their smaller carbon footprints, industrial facilities that are smaller consumers of fossil fuels, e.g., natural gas processing facilities, ammonia plants, cement production plants, and iron and steel mills are likely to be targets of carbon capture and storage as the CCs industry evolves.
Power Plant Technological Variants
The thermal generation of electricity is a mature and robust technology that has seen only incremental improvement over nearly two centuries. These technologies uses a heat engine to liberate
Figure 7. Temperature-composition diagram showing the general relationships in a system displaying immiscibility between two compositionally different fluids/liquids at constant pressure. see text for discussion. (Copyright j.d. Myers. used with permission.)
the chemical energy of a fuel as heat. The heat is converted into kinetic energy which is, in turn, used to drive a turbine-generator unit. when designing a thermal power plant, engineers have three fundamental choices to make (fig. 10); the type of fuel the facility will burn, the oxidant that will
combust the fuel, and the technology that will harness the kinetic energy generated by the heat engine.
Combustion: decisions about fuel and oxidant determine the combustion processes occurring in the power plant and the nature of the resultant waste streams. The combustion process powering any heat
Figure 8. Temperature versus Co2 content for mixtures of water and Co2 at 1,500 bars. (a) Co2 and pure water are immiscible up to 275ºC. (b) in a brine, the miscibility gap spans a larger compositional range and extends to higher temperatures. in most cases, Co2 injection in ocean water or formation brine will produce a two fluid system which has important ramifications for storage behavior. (Modified from Kaszuba and others, 2006)
Figure 9. Map of annual Co2 emissions by country. The largest emitters are concentrated in north america, europe and asia. These countries are, therefore, the most likely candidates for early deployment of CCs.
engine has two fundamental inputs: 1) an oxidant to chemically combust the fuel, and 2) a fuel source (fig. 11). after combustion, there are two primary outputs from the plant: 1) electricity, and 2) exhaust or flue gases. The exact nature of the inputs and outputs are specific to each power plant.
nearly all existing thermal power stations (excluding nuclear) combust their primary fuel with air as the oxidant. since air contains gases other than oxygen, the exhaust gas also contains a wide range of chemical species. The most important of these include carbon monoxide,
Co2, and a variety of sulfur oxides (soxs) and
nitrogen (noxs) oxides. in addition, a range of
particulates, including metals such as mercury, are released with the gases. These gases are vented at atmospheric pressure, a point that has important ramifications for carbon capture energetics and
economics. for example, as mentioned later Co2 is
stored geologically as supercritical fluid. Thus, the
low pressure Co2 vent from a power plant must be
compressed to higher pressures, an energy intensive and therefore expensive process.
in the power plant system, Co2 can be
captured at three different points in the process of converting a fuel to electricity. Two methods alter the inputs to combustion and one modifies its outputs. Post-combustion capture reduces carbon
emissions by capturing Co2 from the exhaust
gas stream after combustion has occurred. This approach has the benefit that, if conditions are favorable, it can be retrofit onto existing power plants that still have significant operational lifetime. Pre-combustion capture involves gasifying the fuel before combustion to strip the resultant
gas stream of Co2 leaving a hydrogen stream
that when combusted, produces mostly water. This approach is most likely to be applied to new
Figure 10. flow chart illustrating main choices for the three major power plant variables, e.g., fuel, oxidant, and technology. (Modified from rao and rubin, 2002)
plants constructed under carbon emission limiting regulations. The third path to carbon capture is
oxyfuel combustion. in this approach, oxygen is
separated from air and the fuel is combusted in an oxygen-pure or oxygen-rich atmosphere. Thus, the
exhaust stream is nearly pure Co2 and cost savings
are realized in terms of stripping low concentration
Co2 from a mixed gas exhaust stream. like
post-combustion, oxyfuel combustion can be used to retrofit existing power plants.
Post-combustion capture: post-combustion carbon capture alters the nature of the exhaust gas from the combustion process (fig. 12). in this process, fuel and air (the oxidant) are combusted together to produce a flue gas with a wide range of components. for a typical coal-fired power plant,
the exhaust gas contains about 12–15 percent Co2
by volume. The flue gas is processed to remove the
Co2, which is sent to a storage site. The remaining
gases from the separation process are simply vented to the atmosphere through the exhaust stack.
The major benefit of post-combustion capture is it can be retrofit to many pulverized coal plants currently in operation today. because it materially increases a plant’s spatial footprint, only plants with sufficient space would be candidates for retrofitting. additionally, the plant must have sufficient operational lifetime left to warrant the considerable cost of the retrofitting the plant with a
Co2 capture unit. post-combustion capture works
for pulverized coal (pC) and natural gas combined
cycle (ngCC) plants, although the lower Co2
content (3–5 percent by volume) of the exhaust stream from the latter makes the process much less efficient.
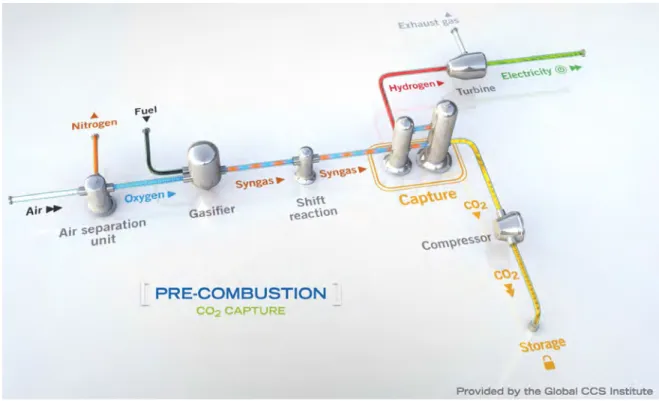
Pre-combustion capture: pre-combustion
carbon capture involves reacting a fuel with oxygen/ air and/or steam to produce a synthesis gas (syngas), which is a mixture of carbon monoxide (Co) and hydrogen (fig. 13). The Co is reacted with steam in
a catalytic converter to produce Co2 and additional
hydrogen in a gas shift reaction (eq. 1):
2 2 2
CO
+
H O
→
CO
+
H
(1)
The Co2 and hydrogen are separated into two gas
streams. The hydrogen stream goes to a combustion chamber to be burned to produce steam or to a gas combustion turbine. The hydrogen-rich syngas is combusted with an oxidant thereby producing only water and heat (eq. 2):
2 2 2
H
+
O
→
H O
+
heat
(2) in a conventional power plant, the heat is used to generate steam and drive a steam turbine to produce electricity. for the combustion turbine, the exhaust gases from the burning of hydrogen are used to drive a turbine directly. The exhaust gas stream may or may not be used to produce steam and drive a secondary steam turbine. although
Figure 11. for the purposes of understanding CCs, the combustion process in a thermal power station relies on two inputs, fuel and oxidant; and produces two outputs, exhaust gases and power.
Figure 12. in post-combustion capture, fuel and air are combusted in a furnace-boiler unit and the exhaust gas sent to a capture unit where Co2 is removed from the gas stream for storage. (source: global CCs institute, www.globalccsinstitute.com)
Figure 13. pre-combustion carbon capture. in these plants, the fuel is gasified before combustion and Co2 remove
early in the process. heat is supplied by the burning of hydrogen to produce water, not carbon to generate Co2.
the final exhaust gas has reduced Co2 levels, it can cause environmental problems without
further treatment because it contains soxs and
noxs (produced by combustion in air) as well
as other environmental pollutants, e.g., mercury.
Meanwhile, the captured Co2 stream is compressed
and sent to storage. unlike the post-combustion process, this type of capture technology cannot be retrofit on existing power stations. in addition, it is not yet commercially viable. This capture technology is likely to be deployed on a large scale only when new power stations are built specifically
to lower Co2 emissions.
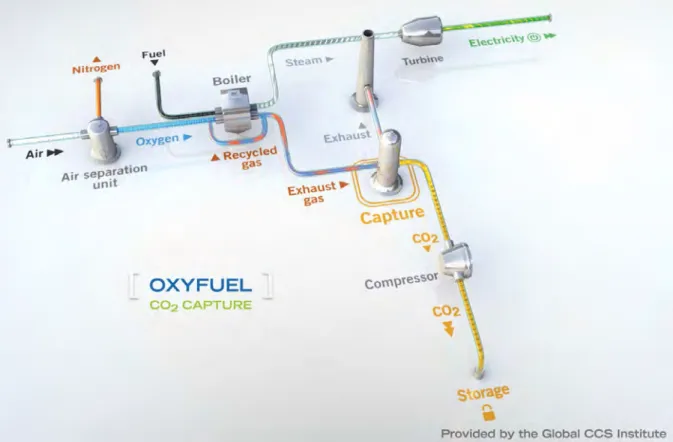
Oxyfuel combustion: oxyfuel combustion is an alternative way to change the inputs to the combustion process. This process uses cryogenic separation, i.e., liquefaction and distillation, to separate the gaseous components of air based on their different liquefaction temperatures. it removes oxygen from the other gases in air, e.g., argon and nitrogen. The pure oxygen stream (fig.
14) is combined with a fuel in a combustion
chamber. Combustion produces Co2 in gaseous
form and h2o vapor, which are easily separated by
dehydration, a physical process. because oxyfuel combustion temperatures are too high for most
of today’s metals, a portion of the Co2 stream is
cycled back into the combustion system to reduce
temperatures. The remaining Co2 is captured,
compressed, and transported to a storage site. oxyfuel combustion plants are candidates only for new power plant constructions because oxyfuel combustors cannot be retrofit onto the existing generation of thermal power plants.
Separation Mechanisms
after combustion, Co2 must be separated from
the other gases in an exhaust stream. There are five basic chemical or physical means of separating gases from each other, although only four are used for
Co2 separation (fig. 15). These are:
• absorption: incorporation of a substance
Figure 14. schematic process for oxyfuel combustion. The fuel is burned in an oxygen-rich environment producing a syngas consisting of carbon monoxide (Co) and hydrogen (h2). if the fuel is a hydrocarbon or biomass, it produces
a nearly pure stream of Co2. This process eliminates the need to separate a dilute Co2 stream from the exhaust gas.
Figure 15. The five options available for Co2 separation and capture and the various alternatives being pursued within
each category. (Modified, rao and rubin, 2002)
in one state into a different state (liquid absorbed by a solid, gas absorbed by a liquid)
• adsorption: physical adherence or bonding of ions, atoms, or molecules onto the surface of another phase
• membrane separation: separation by selective permeability through a porous material
• cryogenic distillation: compressing, cooling, and purifying the flue gas stream in a series of stages to liquefy it and separate different gases by low-temperature distillation of the resultant liquid
• microbial/algal separation: separation by biological activity of microbes or algae absorption is a bulk process where a substance in one phase is incorporated in the bulk volume of a different phase. in contrast, adsorption attaches a substance from one phase to the surface of another phase.
Absorption
absorption occurs by both physical and chemical processes (fig. 15). physical absorption involves a mass transfer across the interface between the two phases, usually a gas-liquid exchange. The rate of separation is controlled by how fast the transferred substance diffuses away from the interface into the solvent phase. Chemical absorption involves a chemical reaction between
the absorbate and the solvent. accordingly, it is also referred to as reactive absorption. because it involves a chemical reaction, the process rate is determined by the proportions of the reactants and products of the reaction (its stoichiometry), as well as reactant concentration. The removal of acid gases from an exhaust stream is an example of chemical absorption, whereas the trademark solvents selexol™ and rectisol™ employ physical absorption. Chemical or physical absorption can be either reversible or irreversible. a reversible process is one in which some environmental parameter can be altered to release the absorbed substance.
for Co2 separation, only reversible absorption
processes are practical because the solvent can be regenerated and reused in the process. irreversible
absorption processes would produce a Co2-rich
product that had to be disposed of continually and new absorbent added to the process.
Many CCs projects and natural gas processing plants use an amine-based liquid as the primary
solvent for Co2 capture by absorption (fig. 15;
rubin and others, 2007). The amine solvent most commonly used is the organic compound monoethanolamine (Mea). This solvent is non-selective meaning that it chemically absorbs all acid
gases, e.g., h2s, not just Co2. because it reacts
with so2 and no2, the presence of these gases will
significantly reduce the absorption capacity. Thus, a Mea-based capture system requires a flue gas with
typically have 700–2,500 ppm so2 depending on
the nature of their fuel, therefore a so2 scrubber
must be placed before the Co2 capture unit unless
co-sequestration of sulfur-rich Co2 is permitted.
Mea captures 75–90 percent of Co2 in the exhaust
gas and produces nearly pure (> 99 percent) Co2
stream. a large amount of heat is required to drive
off the absorbed Co2 and regenerate the solvent.
energy is also required to run pumps and fans and
after capture compress the Co2.
The trademark solvents rectisol™ and selexol™
capture Co2 physically (fig. 15). both are acid
gas, e.g., hydrogen sulfide, Co2, nitrogen oxides,
etc., solvents. selexol™ is a glycol-based solvent that separates absorbed acid gases at high pressures (20.7–138 bars). To release the gases, the pressure is lowered or the solvent interacted with steam to strip the acid gases. by adjusting the operating conditions, this type of absorption process can be used to generate different acid gas streams. as a physical absorption process, less energy is required to regenerate the solvent. because power plants exhaust their flue gas at atmospheric pressure, a selexol™-based separation unit would require pressurizing the gas stream. rectisol™ is a separation process
that absorbs acid gases at low temperature (-40oC)
and high pressure (27.6–68.9 bars). regeneration and acid gas release is accomplished by lowering the pressure of the charged solvent. although less expensive than selexol™, rectisol™ requires considerable energy to maintain the optimum low operating temperatures.
absorption is a cyclic process in which Co2
is absorbed and desorbed in different columns (fig. 16). Typically absorption is applied to a
post-combustion exhaust stream, where the Co2-bearing
flue gas is cooled and decontaminated of soot and fly ash. after cleaning, the flue gas enters the bottom of an absorber column or tower (fig. 16). The tower is filled with a packing material through which the gas
ascends. at the same time, lean or Co2-free solvent
is pumped into the top of the column. as the liquid percolates down the column through the packing, it physically contacts the up-flowing gas. during the
process, Co2 diffuses from the gas into the solvent.
at the top of the column where the flue gas has
the lowest Co2 content, the solvent is completely
recharged and can absorb Co2 effectively even at
the low concentrations of Co2 in the flue gas near
the top of the tower. Moving down the column,
the flue gas is richer in Co2 and the solvent more
charged. Thus at the base of the column, the nearly
saturated solvent is in contact with the Co2-richest
flue gas. under such conditions, the solvent still has
the thermodynamic capacity to absorb more Co2
because of the higher concentration of Co2 in the
flue gas stream. at the bottom of the tower, the charged solvent is transferred to a desorber tower/ column (fig. 16). The flue gas at the top of the absorber column, which is now mostly nitrogen and other gases, is simply exhausted to the atmosphere.
as the charged solvent falls through the
desorber tower, it is heated to more than 100oC.
heating releases Co2 from the solvent. The Co2
vapor exits the top of the tower where it is cleaned of any water it might contain. it is then compressed for transport to a storage site. The volume of solvent required is, however, very large. for a 500 Mw plant, six Ml of solvent split between the two towers is necessary (Co2-CrC, 2013).
Adsorption
adsorption, unlike absorption, is a surface process, but it too is cyclic. in this case, the gas molecules (adsorbate) are adsorbed onto the surface
of a liquid or solid (adsorbent). for Co2 capture,
the solvent is usually a solid, generally zeolite, a class of fibrous silicate minerals. The process consists of three stages: adsorption, purge, and evacuation (fig. 17). because the active material is now a solid not a liquid, the capture unit is physically very different. if there is only one adsorbent bed in the unit, the process would have to work in batch mode. when the bed reaches full charge, the flow of flue gas would cease so the adsorbent bed could be regenerated. Thus, to handle the continuous exhaust gas stream of a power plant, the exhaust gas is cycled through three adsorbent beds (fig. 17). in one bed, the flue gas continuously flows over the bed until it
can no longer capture Co2. in the unit with a fully
charge adsorbent bed, the bed is purged of parasitic
gases like nitrogen by flowing pure Co2 gas through
the unit displacing nitrogen molecules that attached to the surface. in the third, purged unit, a pump evacuates the bed by setting up a partial vacuum and
drawing the Co2 off the surface and out of the unit
(fig. 17).
chemically or physically. in the physical version, the adsorbate is held onto the surface by van der vaals and electrostatic forces. when adsorption occurs, heat is given off in an exothermic reaction. for chemical adsorption, covalent bonds form between the adsorbate and adsorbent. a variety of materials are used as adsorbents. The most common are metal organic frameworks, zeolites,
and mesoporous carbons. To release the Co2
from the surface, a change in external conditions is necessary. These can be produced by using a thermal swing (increase in temperature), vacuum swing (creation of near vacuum),
pressure swing (generally a decrease in pressure to near atmospheric), and/or an electrical swing (application of a voltage). desorption by thermal swing is slow and energy intensive because the entire adsorbent must be heated. The vacuum swing can operate at ambient temperature so it requires less energy.
Membranes
Membranes are porous media that can be
made of polymers or ceramics and separate Co2
from a gas stream in a number of different ways (fig. 15). gas separation membranes selectively
Figure 16. Carbon dioxide is stripped from the flue gas in the absorber column (left) to produce a nearly Co2-free exhaust gas. in the desorption column (right), heat is applied to the solvent forcing the Co2 out and regenerating the solvent, which is pumped back through the cycle.
pass different gases through them based primarily on the gas molecule size. Typically, the use of gas separation membranes results in smaller equipment sizes. a pressure differential across the membrane drives separation. The biggest energy demand with this technique is creating a sufficiently steep pressure gradient to achieve effective separation. in essence, the membrane is a semi-permeable barrier like a cell wall. The rate at which gas is separated is a function of molecule size, gas concentration, and pressure differential. This process has not been applied
on a large scale for Co2 separation, and the high
temperature of flue gases represents a serious
barrier to widespread deployment for Co2 capture
because of the negative impact they have on the mechanical properties of the membrane.
an alternative approach to Co2 scrubbing
is to use membrane separation in conjunction with a liquid solvent (fig. 18). in this case, the
membrane maintains a stable permanent interface
between the gas and liquid solvent and allows Co2
exchange between the two (fig. 18). The physical separation of gas and liquid flows eliminates some of the flow problems inherent in more traditional liquid absorption techniques, i.e., the problem of maximizing surface area contact between liquid solvent and flue gas. specific sized gas molecules that pass through the membrane are then captured by the absorbent. This technique is useful
when Co2 has a low partial pressure (i.e., low
concentration in the flue gas stream), which is the case for flue gas.
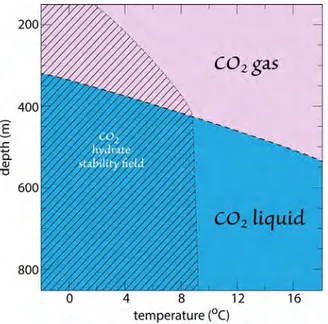
Cryogenic Separation
Cryogenic approaches to Co2 separation use
low temperatures to cool, condense, and purify
Co2 from a mixed gas stream. There are two
variations of this method (fig. 19). in the first type, the flue gas is cooled to sub-zero temperatures
Figure 17. adsorption captures Co2 on to an adsorbent’s surface. left: To handle the continuous exhaust gas stream of a power plant, the three stages of the process—adsorb, purge and evacuate—are divided between three adsorber units. as the beds charge and discharge, the exhaust gas stream is switched cyclically between them. right: a batch type of operation cycles the three stages of adsorption in a single physical unit. This type of arrangement is not optimum for carbon capture from a continuous gas source, e.g. power plant.
at which only Co2 condenses to a liquid. The remaining gases simply exit the chamber and are emitted. in the second case, the temperature and pressure are adjusted to reside in the hydrate stability field and chilled water is passed through the gas. The water freezes to form ice crystals with
trapped Co2. The hydrates are moved to a second
process unit and heated, thereby releasing the
Co2.
Efficiency Penalty
The addition of Co2 capture units to a
thermal power plant adds a large parasitic electrical demand to the plant. separation units have pumps, fans, and other equipment that require power. in addition, a large amount of energy is needed to regenerate solvents and adsorbents.
The compression of captured Co2 to supercritical
temperatures and pressures, which facilitates
transport and storage, is an additional energy sink. Thus, if these units are retrofit to an existing ‘reference’ power plant, the electricity that can be delivered to the grid is reduced significantly, i.e., the parasitic load consumes electricity that would normally be delivered to the grid (fig. 20). some estimates place this parasitic load as high as 60 to 100 percent of the reference plant’s generating capacity (ipCC, 2005). for clarity, the term ‘reference plant’ refers to the power plant design without carbon capture (CC) equipment. To deliver the same amount of grid electricity as the comparable reference plant, additional generating capacity must be added to any power plant with carbon capture technology installed (fig. 20).
This change in power plant electrical output
has an impact on how much Co2 is actually
produced, emitted, and captured (fig. 20). although a capture unit will capture a significant
portion of the produced Co2, some Co2 will
Figure 18. gas absorption uses a porous membrane to separate gas and liquid solvent. The Co2 diffuses through the
necessarily be emitted to the atmosphere because no process is 100 percent effective. The difference
between the emitted Co2 and that produced and
emitted by the reference power plant is the CO2
avoided. because it would not have been released
under a bau carbon scheme, the remainder of
the captured Co2 from the CC power plant is not
a positive contribution to overall Co2 emission
reduction. increasing the generating capacity of the reference plant to account for the parasitic load and deliver the same amount of grid electricity requires combustion of more fossil fuel. with
this additional fuel consumption, more Co2 is
produced and the capture unit must process a
larger produced Co2 stream to capture a larger
amount of Co2 (fig. 20). as with the smaller
capacity, CC-equipped plant, only a portion of this
captured stream is actually avoided Co2 relative to
the reference plant. in this instance, the amount of
Co2 avoided actually decreases as plant electrical
generating capacity is increased. The ironic consequence of installing capture units is that they will increase the combustion of fossil fuels for the same amount of electricity, thereby necessitating
ever larger Co2 transport systems and storage
capacities.
Carbon Transport
Transport links carbon capture and storage sites
(fig. 21). Currently, Co2 is transported in three
physical states, i.e., gas, liquid and solid; however, commercial scale transport involves only gaseous
and liquid Co2. Transport of Co2 at atmospheric
pressure would require very large facilities because of the large volume of gas that would have to be moved. gas volume can be reduced by compression, liquefaction, solidification, or hydration. only
Figure 19. There are two variants of cryogenic separation. (a) The gas is cooled to a temperature at which Co2, and only Co2, condenses to a liquid. (b) gas is cooled to a temperature where Co2 hydrates are formed. subsequent application of heat releases the Co2 from the solid, hydrate phase.
compression and liquefaction are used commercially. Compression is common for pipeline transport whereas liquefaction is used for ship transport of lpg (liquefied petroleum gas) and lng (liquefied natural gas). solidification of a gas for transport requires too much energy to be cost effective.
in the united states, the major pipelines
moving Co2 are concentrated in the Texas
panhandle, wyoming, Colorado, and across the u.s.-Canada border (fig. 22). nearly all of this
Co2 is transported for enhanced oil recovery
(eor) operations. because of the location of
current Co2 pipelines, their expansion will do little
to increase the nation’s ability to move massive
amounts of Co2 from stationary sources to storage
sites, i.e., from coastal regions where most Co2
is produced to the continental interior where the geologic storage sites are located. The major
obstacle to scaling up the Co2 pipeline system is
not technical, but the difficulty associated with gaining right of ways for new pipeline routes. Most of the new routes will originate in populated areas
Figure 20. operating a Co2 capture unit requires considerable amounts of energy, i.e., a parasitic load. This parasitic load reduces overall plant efficiency, thereby impacting the electricity available for export to the grid as well as the amount of Co2 produced. relative to the original reference power plant only a portion of the captured Co2 is actually avoided atmospheric emissions. The remaining portion of the captured stream is a consequence of adding the CC unit and under a bau carbon management system would not have been produced because fossil fuel consumption would have been less. abbreviations: CC – carbon capture.
(areas with large Co2 sources) on the coasts and move toward the continent’s interior where the storage sites are located.
if the carbon capture and storage industry becomes global in scale, ships will have to be added
to the Co2 transportation system. This change
would spawn a new transportation industry similar to that moving liquefied natural gas (lng) today.
Moving Co2 by ship will require construction of
loading and unloading facilities, as well as building of new ships. it is not unreasonable to expect an increase in not-in-my-backyard (niMby) opposition to the siting of such facilities, much like the current opposition to lng terminals.
Currently, commercial transport of gaseous
and liquid Co2 (albeit at small volumes) is by
truck-rail, pipeline, and ship. if 80 percent of the
Co2 from fossil-fueled electrical power plants
was captured, the resultant Co2 stream would be
about 1,800 Mt/y (newcomer and apt, 2008).
as the CCs industry grows, a new Co2 transport
infrastructure will have to be built on a massive scale, probably similar in size to that for oil and gas. Much of the experience from these industries
can be directly applied to a Co2 transport system.
it is most likely that a global scale Co2 transport
system will consist of two components: 1) pipelines for transport across and within continents, and 2)
ships for moving Co2 between continents or to
ocean disposal sites.
Pipelines
because stationary sources, like power plants,
produce Co2 continuously, pipelines are a logical
choice for moving Co2 from them to onshore
geologic sequestration sites. This mode of transport has been used successively to move natural gas,
Figure 21. Co2 transport moves captured Co2 from its source to a storage site. given the wide range of possible storage options, a fully developed Co2 transportation system is likely to consist of both onshore and offshore components. (source: global CCs institute, www.globalccsinstitute.com)