Snow Density Variability in the Rio Esera Valley, Pyrenees Mountains,
Spain
S.R. Fassnacht1
Watershed Science, Colorado State University, Fort Collins, Colorado USA 80523-1472 C.M. Heun
Natural Resources Management, Colorado State University, Fort Collins J.-I. Lopez-Moreno
Instituto Pirenaico de Ecología, CSIC, Campus de Aula Dei, P.O. Box 202 Zaragoza, 50080, Spain J.Latron
Department of Chemical and Agricultural Engineering and Agrifood Technology, University of Girona, Girona 17071, Spain
Abstract. An accurate assessment of snow depth and snow density is essential to determine that amount of water stored in the snowpack, i.e., snow water equivalent (SWE). The measurement of snow density is much more difficult and time consuming than snow depth. The variability in snow density is evaluated for a 5.4-km stretch of the Rio Esera headwaters in the Spanish Pyrenees Mountains. The traditional snow tube method is compared to the more labour-intensive but accu-rate snow pit method. The former method measures snow depth and extracts a snow core that is weighed. The latter method uses a wedge cutter to extract a 1-L snow sample to estimate density at 10-cm intervals through the snowpack. The variability in snowpack density is not systematic and can only be explained at lower elevation when the snowpack is known to be melting, as identify by an isothermal snowpack at zero degrees Celsius. This occurred during a mid-January survey. A late-April survey showed that these lower elevation sites were still more dense.
1. Introduction
Snow is an important storage of water across watersheds with headwaters located in high elevation or latitude areas. The number of meteorological stations, especially those with snow monitoring capabilities, is low and the distribution of snow in such domains can be quite variable making the estimation of storage volumes challenging. The mass of snow at a point is referred to as snow water equivalent (SWE) and is a product of the snow depth and depth-averaged density. Manually, snow depth is more easily measured than SWE or density. Traditionally measurements of snow density are gathered by determining depth and weighing an extract a snow core for SWE using a snow tube, such as a Mount Rose, Federal Sampler (Goodison et al., 1981). For research purpose, a more labour-intensive process requires the digging of a snow pit and using a wedge cutter (typically 1 L) to ex-tract density samples at a 10 cm interval. Automatically, snow depth is measured using ul-trasonic depth sensors (e.g., Ryan et al., 2008), while SWE is measured using a snow pil-low (Goodison et al., 1981).
pit sampling methods. Specifically, the research questions are 1) what is the variability of density over a given space? If it is supported that density does vary over space, can it be at-tributed to elevation? 2) Is the snow tube sampling method a substitute for the customary wedge cutting method?
2. Study Site
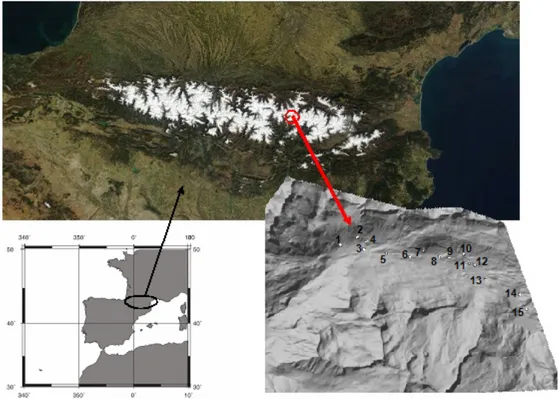
Snow surveys were conducted in the headwaters of the Rio Ésera in the Central Span-ish Pyrenees Mountains (Figure 1) in mid-January (12th to 16th) and at the end of April (21st to 24th) of 2009. The dates represented contrasted periods in terms of the snowpack. In January, most of the snowpack is still accumulating and has a somewhat homogeneous snow distribution. Low incoming solar radiation and the cold temperature during accumu-lation should have maintained a strong thermal gradient through the snowpack. In April, incoming radiation is higher yielding possible snowpack differences in forest openings compared to wide open areas. Some areas should be ablating while others should be near their peak accumulation or still accumulating. The snowpack in most locations should be isothermal at zero degrees Celsius. Density was sampled at 15 locations over a distance of 5380 metres and an elevation range of 344 metres from 1735 to 2074 metres above sea level (Figure 1). Individual sampling locations were selected under the condition that sur-face of each appeared homogeneous over a 10 by 10 metre plot. Eight locations were in forest openings (size of the open area was less than twice the height of the surrounding trees) and seven in open areas (size of the open area is higher than five times the height of the surrounding trees).
3. Methodology
3.1 Sampling and Data Collection
In January, a snow pit was dug to the ground at each location. Density was measured following the procedure of Elder et al. (1991). Snow samples were taken at 10cm intervals through the height of the pit using a 1 L metal wedge cutter (Figure 2a) and weighed on a digital scale to the near gram. The scale had been tared with the cutter. Two samples were taken at each interval, with additional samples being extracted if the difference between samples was greater than 20 grams. The weight of each sample directly yielded a density in kilograms per cubic metre. An average density was computed for each 10-cm interval, with the bottom interval scaled to consider that the total snow depth was not a multiple of 10. A snow pit average density was then computed. The snowpack temperature was measured at a 10-cm interval. Snow pits were not dug in April and thus no snow pit densities were measured.
For the snow tube measurements in January, we crafted a custom snow tube by cutting 1-cm teeth into a 6.9-cm diameter PVC pipe. After the snow pit had been dug, this tube was carefully turned into the snowpack by applying a downward force. Since we were in the snow pit while inserting the tube we knew when dense melt-freeze layers were encoun-tered and increased the turning to cut through these layers. Upon reaching the bottom of the snow pit, an 8-cm wide thin (<1mm), but rigid, plastic mat was pushed along the snow-soil interface to cap the snow tube. The snow tube was extracted from the snowpack, the snow core was poured into a container and weighed. The mass of any soil present was also weighed and deducted from the mass of the snow core. This mass was converted into SWE and using the depth of snow where the core was extracted the snow tube density was
com-puted. Five snow tube density measurements were made at each location, except the lowest location where only four measurements were made.
In April, the SnowHydro (2004) SWE coring tube was used (Figure 2b). This is a 2-m long clear lexan tube with metal cutting teeth on the bottom. It is similar to the Adirondack or Meteorological Service of Canada snow samplers (see Goodison et al., 1981 for infor-mation on those samplers). As with the Federal Sampler, the SnowHydro sampler is used with a scale calibration to directly measure SWE. At six locations, two samples were taken while at eight locations three samples were taken. Four samples were taken at the third lowest location.
Figure 1. Location map. 3.2 Data Analysis
The variation of snowpack density was investigated over the range of elevations sur-veyed. For the January measurements, the average density derived from snow pit was compared to that obtained from the snow tube sampling. The maximum and minimum measurements for each snow pit interval and for each set of snow tube measurements was used to determine measurement variability. We assessed the incremental snow pit density. To assess variation in depth versus the differences in the measurements over each sampling location, SWE was computed at each location. The SWE was investigated over the sur-veyed elevation range. We used the depth from the density measurement compared to the depth from 121 points taken around the density measurements over a 10 by 10 metre plot.
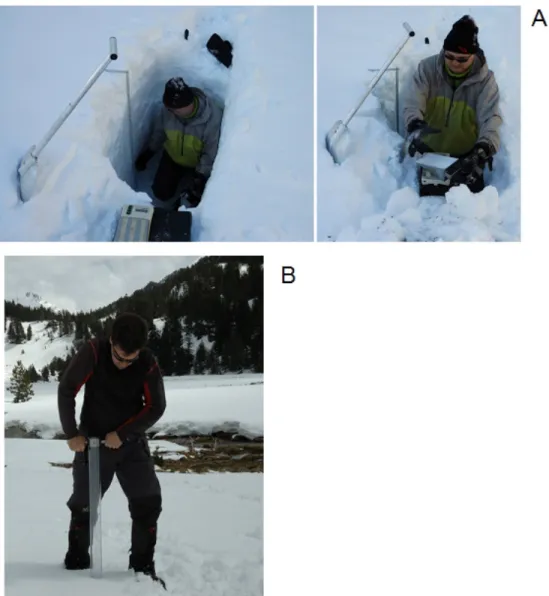
Figure 2. Sampling tools for measuring snow density a) 1-‐L wedge cutter used in a snow pit for meas-‐ uring density at a 10-‐cm interval, and b) snow tube for extracting a snow core and measur-‐ ing an integrated snow density.
4. Results
In January there is no obvious relationship in average density and elevation, with the exception of the lowest three locations (Figure 3a), for which the density increases as ele-vation decreases. In April these three locations and the fourth lowest location vary from the remaining 11 locations that show no obvious relationship between average density and elevation (Figure 3b). The fourth location is least dense in January but most dense in April.
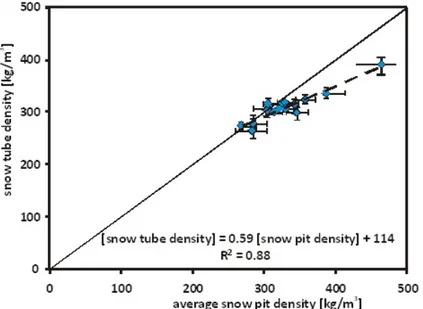
For a lesser dense snowpack, the average snow tube density was similar, yet slightly less, than the snow pit density (Figure 4). The two lowest elevation samples were most va-riable; when a linear regression was fit through all data, the slope was only 59%. For these locations, the snow tube samples remained less dense, even considering the measurement variation. When these two locations were removed, the slope remained less than 100%, but
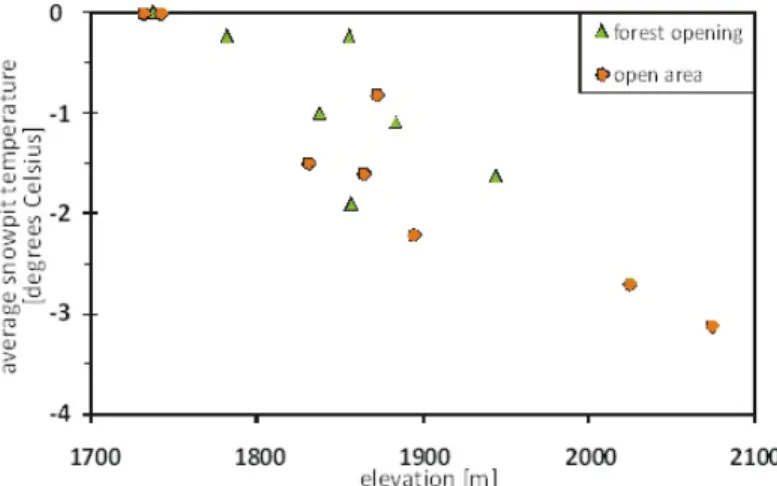
100%, but the density variation was low. These two locations and the next dense location, as highlighted above in Figure 2a, are isothermal at zero degrees Celsius (Figure 5) and melting had started. Otherwise, the average snowpack temperature decreased as elevation increased (Figure 5). Open areas tended to be colder than forest openings.
The average snow tube density for the 15 locations was 310 kg/m3 with an average for the seven forest openings of 302 kg/m3 and the eight open areas of 316 kg/m3. As above (Figure 4), the average snow pit density was greater at 331, 340, and 320 kg/m3 for all lo-cations, forest openings, and open areas, respectively. The density in the snowpack varied with depth (Figure 6) with less dense fresh snow at the top of the pack and metamorphosed crystals below. Some depth hoar was present at the bottom of the snowpack yielding less dense layers.
The average snow tube density was greater in April than in January (Figure 7), except for the first location (392 versus 378 kg/m3), which was melting during the January sur-vey. The samplers were different between surveys, with the SnowHydro sampler assumed to be more accurate due to its metal cutting teeth. As mentioned previously the fourth low-est point had the lowlow-est density in January (264 kg/m3) and highlow-est in April (419 kg/m3) yielding the largest difference in Figure 7.
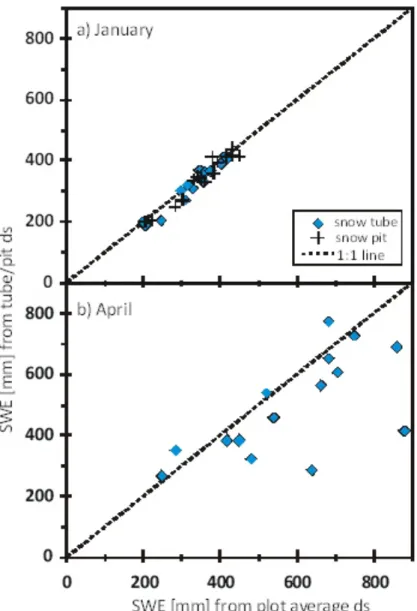
In January the SWE computed using the different depths are almost identical for both the snow tube and the snow pit (Figure 8a). However, in April SWE from the plot average depth using 121 points tends to be greater than from the 5 depth measurements using the snow tube (Figure 8b).
In only two locations was the computed SWE less.
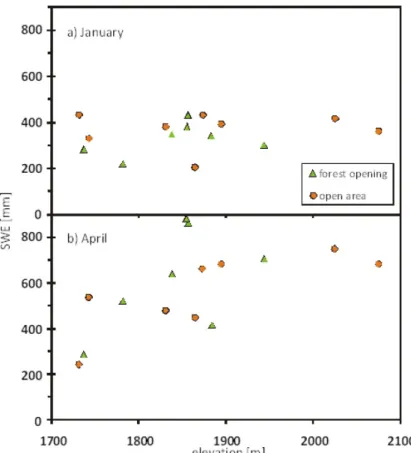
In January, SWE did not vary with elevation (Figure 9a) with SWE ranging from 205 to 431 mm. In April, SWE was limited at the lowest two elevations (247 and 285 mm for first and second lowest locations), but no discernible pattern for the other locations ranging from 416 to 881 mm of SWE (Figure 9b). There was less snow at the lowest elevation lo-cation in April than January (358 vs. 247 mm) and almost the same at the second lowest location (246 vs. 285 mm). There was more snow at all other locations (Figure 10).
5. Discussion
For shallow snowpacks, snow density has been shown to be conservative, varying little over space were redistribution is limited (Dickinson and Whiteley, 1972; Logan, 1973). Where wind are greater and create wind slabs and depositional zones, snowpack density variability can be substantial (Sturm and Holmgren, 1998). There was limited variability in snowpack density for the January and April measurements (Figure 3a and 3b). The simi-larities in density across the study site could be a product of the consistencies in snowpack on both the local and landscape level that express a heterogeneity in factors such as topog-raphy, vegetation, microclimate, and redistribution and melting (Lopez-Moreno et al., 2007).
Figure 3. Variation of snowpack density over the surveyed range of elevations. The January measurements
(a) include the average density derived from snow pit and snow tube sampling, and b) the April measurements are from the snow tube.
Figure 4. Comparison of snow tube and snow pit average density with error bars representing the maximum
and minimum measurements.
Figure 5. Average snow pack temperature from 10-cm snow pit measurements, excluding the top 15 cm,
versus elevation.
Figure 6. The difference between incremental snow pit density and the depth-average snow tube density
over depth.
Figure 8. Comparison of SWE computed using the snow tube (snow pit) depth (1 to 5) measurements versus
those computed from the average of the plot depth (121) measurements for a) January and b) April.
For the Canadian Prairies, Pomeroy and Gray (1995) estimated density as a function of depth for shallow snowpacks, while for the Swiss Alps Jonas et al. (2009) used a power function over a range of snow depths up to 3.5 m. There was no obvious relationship be-tween depth and density for the Rio Esera area, with a possible decrease in density as depth increase in April. However, there is a difference in SWE computed using the snow tube depth measurements versus using the 121 plot depth measurements (Figure 8b). This is to the limited number of density measurements (2 to 4) per location in April. Depth tends to vary more at a local scale later in the winter and it is recommended that more snow tube density measurements should be taken at each location. If this is not possible, it is recom-mended that additional snow depth measurements should supplement density measure-ments.
Figure 9. Variation of computed SWE (average density times average plot depth) versus elevation for a)
January and b) April.
tion) density was more at lower elevations. This study showed limited trends in density over elevation; the increase in snowpack density could only be explained when the snow-pack was isothermal and showed signs of melting (Figure 5). The lowest three locations were most dense during both sampling dates. Most research has shown that snow accumu-lation increases with elevation (e.g., Fassnacht et al., 2003 over large scales), but the aver-age increase in snow is quite variable (Meiman, 1968). While elevation tends to be most important topographic variable related to SWE or depth, numerous other topographic vari-ables are relevant at different scales depending upon the location (e.g., Elder et al., 1991; Fassnacht et al., 2003; Lopez-Moreno et al., 2007). Therefore, it is recommended that den-sity be sampled at more locations and that other topographic variables should be consid-ered to explain density variations.
The time required to sample density in a snow pit is a function of snow depth due to pit excavation, sampling, and pit refilling, with experience in continental snow pits (especially in Colorado, United States) showing that the exercise requires approximately one hour per metre of depth. Also, snow density sampling is a destructive procedure and the footprint of a snow pit is a function of depth (~0.5 m2 per metre of depth). The footprint of snow tube sample is much smaller and sampling can require less than five minutes per sample. There-fore it is recommended that a number of snow tube samples should be taken at each loca-tion and due to the varialoca-tion in depth, several samples should be taken close together in at least two sets that are 5 to 10 metres apart. The snow tube sampling should be supple-mented by snow pit measurements. The snow pit can be used to determine if the snowpack is isothermal and melting. Snow tube samples are undersampled in denser snow or over-sampled in less dense snowpack for shallow snowpacks (Goodison, 1978) while in a wet, deep snowpack (California, United States) the Federal Sampler snow tube overestimated density (Peterson and Brown, 1975). Therefore, a combination of snow tube and snow pit sampling should improve density estimation. With a combination of density (or SWE) and depth measurements over an area an optimal ratio of depth to density measurements can be determined, as per Rovansek et al. (1993).
6. Conclusions
Along a 5-km section of the Rio Esera, there is variation in snowpack density, but with no discernible pattern. The lowest three of 15 sampling locations tended to have a higher density. In January, the snowpack at these locations was isothermal and had started to melt. It is recommended that density should be measured across any new study area due to the uncertainty in density variation.
When the snowpack was melting, i.e., the lowest three locations in January, the snow tube underestimated density compared to the snow pit wedge cutter method. The two sets of density at the other 12 locations were similar. It is recommended that for any snow sur-vey in a new area, both methods should be used to balance the accuracy (snow pit) with the rate of sampling, which is much faster for the snow tube. Once the measurement tech-niques have been compared for different time of a winter, a specific density sampling strat-egy can be determined. Snow pits are recommended for locations where the snowpack has started to ablate.
Acknowledgements. This work was supported by research projects
CGL2006-11619/HID, CGL2008-01189/BTE, and CGL2008-1083/CLI, financed by the Spanish Commission of Science and Technology, and FEDER, EUROGEOSS (FP7-ENV-2008-1-226487), and the project “Las sequías climáticas en la cuenca del Ebro y su respuesta hidrológica”, financed by “Obra Social La Caixa” and the Aragón Government, and “Pro-grama de grupos de investigación consolidados”, financed by the Aragón Government. Data collected was assisted by Gonzalo López, Pablo Corella and Mario Morellón; their efforts are acknowledged with thanks.
References
Elder, K., J. Dozier, and J. Michaelsen, 1991. Snow accumulation and distribution in an alpine watershed.
Water Resources Research, 27(7): 1541-1552.
Dickinson, W.T., and H.R. Whiteley, 1972. A sampling scheme for shallow snowpacks. IAHS Bulletin,
17(3): 247-258.
Fassnacht, S.R., K.A. Dressler, and R.C. Bales, 2003. Snow water equivalent interpolation for the Colorado River Basin from snow telemetry (SNOTEL) data. Water Resources Research, 39(8): 1208 [doi:10.1029/2002WR001512].
Goodison, B.E., 1978. Accuracy of Snow Samplers for Measuring Shallow Snow Packs: An Update. Proc. of
35th Annual Eastern Snow Conference, Hanover, NH.
Goodison, B.E., H.L. Ferguson and G.A. McKay, 1981. Measurement and Data Analysis. Chapter 6 in
Handbook of Snow, (eds. Gray, D.M. and Male, D.H.), Pergamon Press Canada Ltd., 191-274.
Jonas, T., C. Marty, and J. Magnusson, 2009. Estimating the snow water equivalent from snow depth meas-urements in the Swiss Alps. Journal of Hydrology, 378: 161– 167
Logan, L.A., 1973. Basin-wide water equivalent estimation from snowpack depth measurements. IAHS
Pub-lication, 107: 864-884.
López-Moreno J.I., S.M. Vicente-Serrano, and S. Lanjeri, 2007. Mapping of snowpack distribution over large areas using GIS and interpolation techniques. Climate Research, 33(3): 257-270.
Meiman, J. R. 1968. Snow Accumulation Related to Elevation, Aspect, and Forest Canopy. Proc. Of Snow
Hydrology: Proceedings of the Workshop Seminar, sponsored by the Canadian National Committee for
the International Hydrological Decade, p 35-47.
Peterson, N.R., and A. J. Brown, 1975. Accuracy of Snow Measurements. Proceedings of 43rd Western Snow Conference, Coronado, California, p 1-5.
Pomeroy, J.W., and D.M. Gray, 1995. Snow Accumulation, Relocation and Management. National Hydrol-ogy Research Institute Science Report No. 7, 144pp.
Rovansek, R.J., D.L. Kane, and L.D. Hinzman, 1993. Improving estimates of snowpack water equivalent us-ing double samplus-ing. Proceedus-ings of the 61st Western Snow Conference, Quebec City, Quebec, p 157-163.
Ryan, W.A., N.J. Doesken, and S.R. Fassnacht, 2008. Evaluation of ultrasonic snow depth sensors for U.S. snow measurements. Journal of Atmospheric and Oceanic Technology, 25(5), 667-684.
SnowHydro, 2004. Snow-Hydro. URL: <http://www.snowhydro.com/>, last accessed November 20, 2009. Sturm, M., and J. Holmgren, 1998. Differences in compaction behaviour of three climate classes of snow.