UMEÅ UNIVERSITY MEDICAL DISSERTATIONS
NEW SERIES NO. 1380 ISSN 0346-6612 ISBN 978-91-7459-097-5 From the Department of Surgical and Perioperative Sciences
Anesthesiology and Intensive Care and Umeå University, Umeå, Sweden
Methodological aspects on microdialysis
sampling and measurements
Pernilla Abrahamsson
Fakultetsopponent:
Professor Emeritus Urban Ungerstedt Inst. för Fysiologi och Farmakologi
Karolinska institutet, Stockholm
Copyright © 2010 Pernilla Abrahamsson ISBN 978-91-7459-097-5
Printed in Sweden by Print Media, Umeå, 2010
To my family
Knowledge is limited; but imagination encircles the world
Abstract
ABSTRACT
Background: The microdialysis (MD) technique is widely spread and used both
experi-mentally and in clinical practice. The MD technique allows continuous collection of small molecules such as glucose, lactate, pyruvate and glycerol. Samples are often analysed using the CMA 600 analyser, an enzymatic and colorimetric analyser. Data evaluating the performance of the CMA 600 analysis system and associated sample handling are sparse. The aim of this work was to identify sources of variability related to handling of microdialysis samples and sources of error associated with use of the CMA 600 analyser. Further, to develop and compare different application techniques of the microdialysis probes both within an organ and on the surface of an organ.
Material and Methods: Papers I and II are mainly in vitro studies with the exception of
the No Net Flux calibration method in paper I where a pig model (n=7) was used to exam-ine the true concentration of glucose and urea in subcutaneous tissue. Flow rate, sampling time, vial and caps material and performance of the analyser device (CMA 600) were examined. In papers III and IV normoventilated anaesthetised pigs (n=33) were used. In paper III, heart ischemia was used as intervention to compare microdialysis measurements in the myocardium with corresponding measurements on the heart surface. In paper IV, microdialysis measurements in the liver parenchyma were compared with measurements on the liver surface in association with induced liver ischemia. All animal studies were approved by the Animal Experimental Ethics Committee at Umeå University Sweden.
Results: In paper I we succeeded to measure true concentrations of glucose (4.4 mmol/L)
and Urea (4.1 mmol/L) in subcutaneous tissue. Paper II showed that for a batch analyse of 24 samples it is preferred to store microdialysis samples in glass vials with crimp caps. For reliable results, samples should be centrifuged before analysis. Paper III showed a new application area for microdialysis sampling from the heart, i.e. surface sampling. The sur-face probe and myocardial probe (in the myocardium) showed a similar pattern for glucose, lactate and glycerol during baseline, short ischemic and long ischemic interventions. In paper IV, a similar pattern was observed as in paper III, i.e. data obtained from the probe on the liver surface showed no differences compared with data from the probe in liver paren-chyma for glucose, lactate and glycerol concentrations during baseline, ischemic and reperfusion interventions.
Conclusion: The MD technique is adequate for local metabolic monitoring, but requires
methodological considerations before starting a new experimental serie. It is important to consider factors such as flow rate, sampling time and handling of samples in association with the analysis device chosen. The main finding in this thesis is that analyses of glucose, lactate and glycerol in samples from the heart surface and liver surface reflect concentra-tions sampled from the myocardium and liver parenchyma, respectively.
Keywords: Microdialysis, liver ischemia, heart ischemia, epicardium, liver parenchyma,
Original papers
ORIGINAL PAPERS
This thesis is based on the following papers, which will be referred to in the text by their Roman numerals:
I
Pernilla Abrahamsson, Ola Winsö.An assessment of calibration and performance of the microdialysis system
Journal of Pharmaceutical and Biomedical Analysis 39 (2005) 730–734
II
Pernilla Abrahamsson, Göran Johansson, Anna-Maja Åberg, Michael Haney, Ola Winsö.Optimised sample handling in association with use of the CMA 600 analyser
Journal of Pharmaceutical and Biomedical Analysis 48 (2008) 940–945
III
Pernilla Abrahamsson, Anna-Maja Åberg, Göran Johansson, Ola Winsö, Anders Waldenström, Michael Haney.Detection of myocardial ischemia using surface microdialysis on the beating heart.
Clinical Physiology and Functional Imaging. Accepted for publication 2010.
IV
Pernilla Abrahamsson, Anna-Maja Åberg, Ola Winsö, Göran Johansson, Michael Haney, Per-Jonas Blind.Comparison between outcome of surface and intraparenchymatous sampling using microdialysis in an experimental liver ischemia model
Manuscript.
CONTENTS
ABSTRACT...4 ORIGINAL PAPERS...5 CONTENTS...6 INTRODUCTION ...9Introduction and general overview ...9
Historical ...9
MD probe/catheter and MD pump...10
MD sampling ...11
Recovery...12
Catheter insertion issues ...13
Assessment of absolute concentrations ...14
Analysis ...15
Glycogenolysis ...16
Glycolysis ...17
ß- Oxidation; free fatty acid...17
AIMS ...18
MATERIAL AND METHODS ...19
Animal model (I, III and IV) ...19
Microdialysis ...19 Experimental protocol ...20 Paper I...20 Paper II ...20 Paper III ...22 Paper IV...23
Interventions for paper III-IV ...24
Calculations ...24 RESULTS ...26 Paper I...26 Paper II ...28 Paper III ...31 Lactate ...31 Glucose ...33
Pyruvate...34 Glycerol ...34 Paper IV...37 Lactate ...38 Glucose ...39 Pyruvate...40 Glycerol ...41 DISCUSSION ...42 Paper I...42 Paper II ...43 Paper III ...44 Paper IV...45
Reflections Paper III and IV ...45
Considerations about Pyruvate ...45
Probe/catheter design- patent...46
Application ...46
Concerns about the MD technique: as a method ...46
Future considerations...47
CONCLUSIONS...48
ACKNOWLEDGEMENTS...49
Populärvetenskaplig sammanfattning på svenska...51
Introduction
INTRODUCTION
Introduction and general overview
The microdialysis (MD) technique is a relatively new method, designed and developed for measuring local metabolic changes in a specific tissue in vivo (1). “Micro” stands for small and dialysis for the possibility to ‘capture’, collect or sample substances from the fluid surrounding working cells in a vital organ, though this generally means substances with small molecular size. MD sampling aims to identify local metabolic events in a specific tissue through serial sampling, and in physiological terms this can be compared to repeated local venous blood sampling from the same area of the specific tissue. MD sampling collects substances from a specific local part of an organ, and in some organs there may be heterogeneity in their local or regional metabolism and circulations. Substances that can be analyzed are those that pass through the semi- permeable membrane and for which there is analysis methods for small volumes. The MD catheter is a small thin catheter which is easy to place within the organ of interest. Despite this invasive aspect, it is suitable even for vulnerable tissues such as the human heart (2-4). Results from MD sampling can be useful for understanding clinical problems, including help to identify patient’s prosperous conditions. This thesis examines some meth-odological issues concerning the MD analysis method and sampling procedure. The thesis also includes the introduction of a new approach of MD sampling which is aimed to improve the processes of sampling, analysis, and use of clinical appli-cation.
Historical
The first scientific report of dialyse membrane was published in 1957. A scientist from Canada succeeded in analysing small amounts of corticosteroids in blood plasma using a dialyse membrane to collect samples which were then analysed with chromatography (5). Since then and until 2010, 13155 papers have been published in which MD was used (Pub med). In 1966 Bito et al were the first to describe MD implantation in the brain of a dog (6). Some years after, Delgado et al implanted a MD catheter in the brain of a monkey (7). In 1974, Ungerstedt published his first work on MD sampling from rat brain (8). Since then Ungerstedt has continued to develop the MD technique using different catheters and probes for MD sampling in different tissues. The first clinical paper based on sampling in subcutaneous tissue was carried out by Lönnroth and co-workers in 1987. They also showed that it is possible to determine the true concentration of glucose in subcutaneous tissue using the No Net Flux (NNF) calibration method (9). The first reports using the MD technique for studies in the human brain were presented in the early 1990´s (10, 11).
Introduction
B
A
MD probe/catheter and MD pump
Probe/catheter
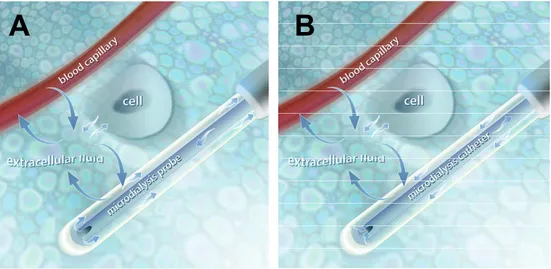
The MD probe (CMA 20) which we have employed includes a membrane which is composed of PolyArylEtherSulfone (PEAS). This is a synthetic material that is also employed in some clinically used haemodialysis membrane filters (12). In the pre-clinical (non-human use) probe, the perfusate flows through the inner channel, into a chamber on the probe side of the semi-permeable membrane area for ‘exchange’, and then exits (as dialysate) through the outer channel where the dialysate finally is collected in vials (Figure 1A). Clinically approved MD catheters have a different design where the perfusate flows through the outer channel and the semi permeable membrane, and then back (as dialysate) via the inner channel to the microvials (Figure 1B) (CMA product catalogue).
Figure 1. Microdialysis (MD) probe (panel A). The perfusate streams through an inner channel and
out to the semipermiable membrane and back to the vial.
Microdialysis (MD) catheter (panel B). The perfusate streams via an outer channel and the semipermiable membrane and back to the vial via an inner channel.
Copyright Permission: CMA Microdialysis, Solna, Sweden.
Microdialysis pump
A reliable pump system for the perfusate is needed for accurate MD sampling. The perfusate syringe or injector needs to maintain a correct and constant flow rate. Incorrect or varying flow rates will alter recovery or exchange of substances across the membrane. To follow rapid changes in local tissue interstitial fluid substance concentrations, a programmable ‘fraction’ collector can facilitate the MD sampling procedure.
Introduction
ReflectionThe MD probe and catheter, and particularly the semi-permeable membrane, is fragile and can easily be damaged. In our experimental laboratory we preferably use the CMA 20 probe. Our routine includes starting a flow of perfusion fluid through the MD probe before insertion in the organ/tissue. After the experiment the MD probe is washed with distilled water, placed in a solution of distilled water, and perfused during the night. These procedures allow the possibility to continue to use the probe the next day. The MD probe function can easily be examined by testing the probe in vitro by placing it in a solution with a known concentration.
MD sampling
Diffusion- membrane
As described above, a MD catheter/probe consists of an outer semi- permeable membrane with pore sizes which are specific for each catheter type, and currently range from 20-100 KD. This allows diffusion of molecules smaller than the pore size. In the body there is continuously diffusion and transport of small molecules across cell membranes. Molecules have kinetic energy (or heat) and this leads to motion which is the basis of diffusion and the movement of molecules along con-centration gradients. Diffusion is a passive process that occurs without need of specific reactions with other molecules. The diffusion rate across the MD mem-brane is dependent on several factors including concentration gradient, molecular size, membrane surface area and temperature. Larger molecules that theoretically would be able to pass through the semi-permeable membrane pores have a low rate of migration over the membrane. This lower recovery is due to the larger molecules moving with a slower velocity. The larger molecules do not collide or meet with the membrane as frequently as smaller molecules. Thus, it has been observed that the size of molecules that migrated through the membrane were only 25% of the actual pore size (1, 13-16).
Ringer solution is often used as perfusate since it is a physiological solution and nearly isotonic. Osmosis is the passive transport of water through a membrane. If there are two solutions with different osmotic pressures separated by a semiper-miable membrane, then water will pass through the membrane to level out the con-centration difference across the membrane. Therefore, the MD perfusate must be similar in its tonicity to the fluid surrounding the probe in order to prevent signifi-cant shifts of water across the MD membrane (17). The MD technique also allows introduction of endogenous and exogenous substances in the perfusion fluid, such as drugs or radioactively labelled substances (1, 13, 14, 18).
Reflection
When thinking about how MD sampling occurs, it is necessary to consider that the process of diffusion across the MD membrane is not only as simple as diffusion and pore size. Other factors may be important, and these are not necessarily well
Introduction
recognised today. The membrane will not always allow substances with lower molecular weight than the pore ‘size’ membrane to pass through without hindrance. In this thesis, only substances with low molecular weight were analysed: glucose (180.16 g/mol=180.16 Da), lactate (90.08 g/mol=90.08 Da), pyruvate (88.06 g/mol=88.06 Da), glycerol (92.09 g/mol= 92.09 Da) and Urea (60.06 g/mol=60.06 Da).
Recovery
Influence
“Recovery” reflects the concentration in the dialysate of the substance or molecules of interest in relation to the true concentration surrounding the catheter. A high recovery means that the concentration in the microdialysate is close to the true concentration in the interstitial fluid of a specific substance of interest. Recovery in MD is dependent on many factors: perfusion flow rate, diffusion rate (the medium and the membrane), the performance of the probe (cut-off, diameter and length of the membrane, chemical interaction between substances and the membrane), and perhaps other factors. Temperature influences the diffusion rate and also the recovery. Recovery increases with 1-2% per one degree (oC) of
increased temperature (9, 19-21).
Dependent on these above mentioned factors, it is difficult to achieve 100 % recovery. MD facilitates measurements of relative changes in concentrations and not absolute changes (1, 13, 14, 19). Substances move from the interstitial space along a diffusion gradient, established by the perfusate as it passes through the probe. High flow rate gives high hydrostatic pressure with the result that the perfusion fluid is pressed into the interstitial fluid with lower recovery as a result. On the contrary, lower flow rates for the perfusate results in lower hydrostatic pressures in the probe channels and most of the perfusion volume returns for collection and high recovery is achieved. To establish high recovery, a long membrane, with optimal pore size and a low perfusion rate, needs to be used.
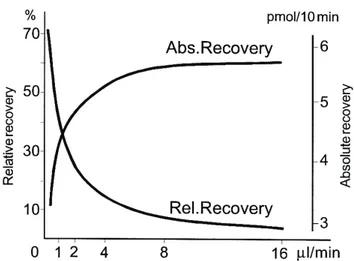
Furthermore, concerning recovery and flow rates, recovery is often presented as relative or absolute recovery (Figure 2). Relative recovery (R) reflects the ratio between the concentration in the dialysate (Cout) and the actual concentration from
the extracellular space (surrounding the probe) (Cm) (22).
Absolute recovery (Figure 2) reflects the actual mass of a substance that is dialysed from the catheter during a specific time period (mol/unit time). Absolute recovery (A) is calculated as the product of the concentration in the dialysate (Cout),
Introduction
Figure 2. Example of absolute and relative recovery as a function of flow rate.
CMA/10 microdialysis probe with 4 mm membrane.
Copyright Permission: CMA Microdialysis, Solna, Sweden.
Reflection
There are many other factors which influence the actual interstitial concentra-tions of the substances of interest, including local blood flow, metabolic rate, up-take into cells and extent of tissue vascularisation. We are interested in the rate of cellular production or consumption of a specific substance, but there is also capil-lary or lymphatic delivery or uptake, as well as cell transport away from the inter-stitium of the substances of interest. It is beyond the scope of this thesis to assess all of these cellular and local circulatory factors. But, it must be recognised that if the goal of a MD assay is to measure cellular production or consumption of a spe-cific substance, there are many other factors which can influence interstitial concentrations.
Every new study/situation requires specific attention to optimal sampling and high or low recovery. Factors such as analytical devices, sampling volumes and measured area, protocol, fast or slow course of the physiological and pharma-cological events to be studied, will be important when planning and designing the details for MD sampling.
Catheter insertion issues
Equilibrium
When a MD catheter is placed in a tissue there will be some trauma to the tis-sue, and this potentially can influence the results. An equilibration period is there-fore needed bethere-fore sample collection start.
Introduction
‘Equilibrium’, in this case, means that the MD membrane is in contact with the interstitial fluid, and that diffusion across the membrane occurs regardless of high or low recovery (23). The time (equilibration period) to reach ‘equilibrium’ is most commonly 60 minutes, but there might be conditions that demand longer equilibration periods. The time to reach ‘equilibrium’ has been shown to be different depending on analysed substances. Flodgren et al showed the need for a longer (more than 60 minutes) equilibration period for glutamate in a patient group with muscle pain. The muscular pain group reached equilibrium after 150 minutes compared with 120 minutes for the control group (24). Other studies have shown that both in healthy and diabetic patients; a stable glucose level in MD sampling was reached first after 12 hours and was thereafter stable for 18 days after insertion of a MD catheter in subcutaneous tissue (25, 26).
Local tissue effects
The insertion of the MD probe/catheter in the tissue is thought to induce only minor damage to the tissue. During the insertion a minor bleeding might occur at the insertion point. One paper showed that an inflammatory reaction of pros-taglandin E2 and Thromboxane B2 was present up to 4 hours after insertion of the
catheter (27). Other papers showed that concentrations of ATP, glucose, adenosine, glucose, lactate, lactate/pyruvate ratio, K+, Thromboxane B2 and blood flow have
returned to baseline already 30-60 minutes after insertion of the catheter (13, 28, 29).
Reflection
Studies showing different times for reaching equilibrium have been presented. These facts should be considered when a study protocol is designed. In our pig studies, an equilibration period of 60 minutes was enough for glucose, lactate, pyruvate and glycerol.
Assessment of absolute concentrations
While the MD technique often is used for measuring relative changes, it might be of interest to also assess the true concentration in a specific tissue. For example, if a drug delivery application is being studied, there can be a specific goal to assess the tissue or tissue interstitial concentrations for that specific agent. The most commonly used methods for this are the No Net Flux method (NNF-method) (9) and the Retrodialysis calibration method (22).
NNF- method
At least four different known concentrations of a solution (C) of interest are perfused (Cin) in probes placed in a specific tissue. When the solution has reach
equilibrium, the concentration of the dialysate (Cout) is determined. The difference
Introduction
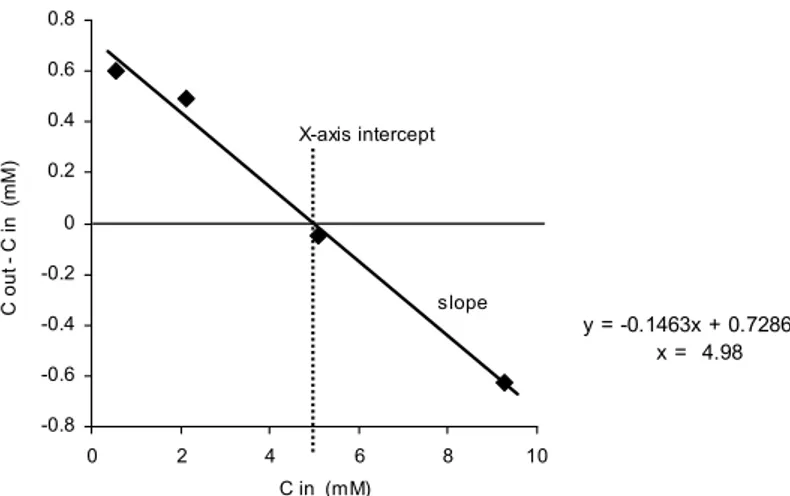
The slope of the regression line is calculated, and the true tissue concentration is the intercept with the X-axis where the regression line crosses at Y=0. An example of calculation of an absolute (true) concentration based on the NNF calibration is shown in Figure 3. This calibration method is specific but time demanding since it requires established steady state. It might also be difficult to find the right concentrations that will reflect the true concentration in the tissue (9, 23, 30).
y = -0.1463x + 0.7286 x = 4.98 -0.8 -0.6 -0.4 -0.2 0 0.2 0.4 0.6 0.8 0 2 4 6 8 10 C in (mM) C ou t C i n ( m M ) X-axis intercept slope
Figure 3. An example for calculating the true tissue concentration of glucose with the No Net Flux
calibration method (NNF). C in = Glucose concentration in perfusate. C out = Glucose concentration in dialysate. The true tissue concentration is the intercept with the X-axis where the regression line crosses at Y=0. mM: millimol/L (Paper I)
Retrodialysis
This method is applicable for in vivo studies and is easy to implement and not as time demanding as the NNF- method. The diffusion/diffusibility through the membrane is assumed to be equal in both directions. An internal standard (Cin) is
added to the perfusate and the loss of the internal standard (Cout) is measured and
recovery (R) is calculated as a function of the loss of the standard solution. Studies have shown that the delivery retrodialysis method gave equal results in muscle and adipose tissue compared with the NNF method. To establish reliable results the internal standard must be carefully chosen so it matches the substance of interests and for minimal disturbance of the experiment (22, 30-35).
in out in
C
C
C
R
=
−
AnalysisThe CMA 600 analyser (CMA MD, Solna, Sweden) is an automatic enzymatic and colorimetric analyser commonly used for measuring substances such as glucose, lactate, pyruvate and glycerol (Figure 4). In the analyser an enzymatic
Introduction
reaction takes place with the collected substance, the reaction creates a coloured solution (quinoneimine) and the colour intensity is read at a wave length of 546 nm at 37oC. A reference method for this enzymatic system is the HPLC (High
Performance Liquid chromatography) system (36). The HPLC system in our lab is used to measure many additional substances of interest, including radio-marked substrates and metabolites. In this thesis, the HPLC system has been involved as a reference method only to confirm and double-check calibration of the CMA 600 analyses.
D- Glucose + O2 → gluconolactone + H2O2
2H2O2 + phenol + 4-amino-antipyrine →quinoneimine + 4H2O
Pyruvate + Pi + O2 → acetylphosphate + CO2 +H2O2
2H2O2 + TOOS + 4-amino-antipyrine →quinoneimine + 4H2O
Glycerol + ATP → glycerol-3-phosphate + ADP
Glycerol-3-phosphate + O2 → dihydroxyacetone phospate + H2O2
H2O2 + DCHBS + 4-amino-antipyrine → quinoneimine+ 2H2O + HCL
L- Lactate + O2 → pyruvate + H2O2
H2O2 + 4-chloro-phenol + 4-amino-antipyrine →quinoneimine + 2H2O+ HCL
Figure 4. Enzymatic reaction formulas for glucose, lactate, pyruvate and glycerol that occur in the
CMA 600 analyser. Determination of the colour intensity of quinoneimine is the final step and is read by the CMA 600 analyser at a wavelength of 546 nm.
For development of the MD technique it would be an advantage if analyser systems were more optimised. An online/real-time analyse system should open for new clinical applications. A sensor for continuous glucose monitoring (SCGM1, Roche Diagnostic, Mannheim, Germany) has been tested both in animals and in diabetic and healthy humans. Glucose concentrations seem to follow the capillary concentration of glucose. This opens for new possibilities to analyse patients with diabetes but also to study other conditions in the future (26, 37-41). Other examples of online MD/realtime analysis systems are: MD-LC system (liquid chromatography), MD- ED (capillary electrophoresis) and MD- MC (mirochip electrophoresis) (42).
Glycogenolysis
Aerobic conditions
Glucose is stored in tissues as glycogen, and glycogen is broken down to glu-cose (glycogenolysis) when gluglu-cose availability or delivery is inadequate by other means. This pattern occurs in all tissue, but is especially prominent in skeletal
Introduction
muscle and in the liver, and is facilitated by the enzyme glucose-6-phosphate. In working muscle, glycogen can remain stored as long as other substrates are avail-able. While the liver helps to provide glucose to the bloodstream in working physiological ranges in this way, in muscle and other tissues glycogen is stored as a rapid and ready source of glucose for the cells own consumption.
Anaerobic conditions
In liver parenchyma, during total ischemia, glycogen breaks down to glucose and a high concentration of glucose occurs in the liver parenchyma (16).
Glycolysis
Aerobic conditions
Glucose is an energy source, and under aerobic conditions glycolysis breaks down glucose to pyruvate giving some limited amounts of energy to the cell. Pyruvate is further metabolised to Acetyl CoA that enters the citric acid cycle, and is combined with cellular respiration/oxidative phosphorylation the largest amount of cellular energy production (ATP generation).
Anaerobic conditions
During anaerobic glycolysis pyruvate is used as a substrate to form lactate. Lactate is a bi-product of metabolism without oxygen. Anaerobic pathway of glycolysis has a minor energy capacity compared with the aerobic glycolysis and the effectiveness decrease after a short time (16).
ß- Oxidation; free fatty acid
Aerobic conditions
Under normal conditions, free fatty acid (FFA) ß- oxidation is the main energy source for example in the heart. The end product for this FFA ß- oxidation is acetyl Co-A which is taken up into the citric acid cycle. There is very effective and efficient energy extraction from β- oxidation.
Anaerobic conditions
During ischemia, ß-oxidation of FFA do not occur, since it is dependent on availability of oxygen (16).
Glycerol
Glycerol can be produced during oxidation. During prolonged ischemia (no ß-oxidation) glycerol can be released as a result of energy depletion and progressive cell cytosolic calcium overload, which increase phospholipase activity in the cell membrane. Glycerol is separated from lipids and released in this process. Glycerol in this setting is then viewed as a marker for cell membrane injury (43, 44).
Aims
AIMS
•
To test the accuracy and precision of the CMA 600 analyser
•
To test the sampling performance of MD probes after experimental
studies
•
To evaluate the NNF calibration method both
in vivo and in vitro
•
To identify sources of error and variability in MD sample handling
and analysis steps by specifically testing the following:
o
Effects of reanalysis steps
o
Influence of storage
o
Influence of centrifugation
o
Influence of vials and caps material
•
To test the performance of MD sampling on the surface of the heart
•
To test the performance of MD sampling on the surface of the liver
Material and methods
MATERIAL AND METHODS
Animal model (I, III and IV)
In Studies I, III and IV pigs (n=40) weighing 28-45 kg were used. The pigs were kept at the University stable over night with free access to water. The study was approved by the Animal Experimental Ethics Committee at Umeå University Sweden, and was conducted in accordance with the NIH Institutional animal care and use committee guidebook (Guide for the Care and Use of Laboratory Animals, National Research Council, Washington, USA, 1996).
The pigs were premedicated with an intramuscular injection of xylazine 20 mg· ml-1 (Rompum vet, Bayer AB), atropine 0.05 mg·kg-1 (Atropin, NM, Pharma,
Stockholm, Sweden) and ketamine 10 mg· kg-1 (Ketalar®, Pfizer, Morris Plains,
New Jersey, USA). An intravenous bolus dose of pentobarbital 10 mg· kg-1
(Pento-barbitalnatrium, Apoteksbolaget, Stockholm, Sweden) induced anaesthesia, and for maintenance of anaesthesia; midazolam 0.3 mg· kg-1· h-1 (Dormicum, Roche, Basel,
Switzerland), pentobarbital 5 mg· kg-1· h-1 and fentanyl 20 µg· kg-1· h-1 (Fentanyl,
Braun, Melsungen, Germany), were infused. The animals were tracheotomised (7.0 OD endotracheal tube, Rusch, Kernen, Germany) and mechanically ventilated to normoxia and normocapnia (Evita 4, Dräger, Kiel, Germany) as adjusted by intermittent arterial blood gas analysis (ABL 5, Radiometer, Denmark). Ringer´s acetate (Pharmacia- Upjohn, Sweden) was infused at 15 ml· kg-1· h-1.
A pressure monitoring and sampling catheter was placed in a small neck artery and a central venous catheter was inserted in the external jugular vein. Basal monitoring comprised registration of heart rate (HR), mean arterial pressure (MAP) and central venous pressure (CVP). Pressures were measured using catheters filled with isotonic saline and pressure transducers (DTX- pressure transducer, Becton Dickinson, Stockholm, Sweden) placed at the mid- axillary level. Data were con-tinuously recorded using a computer based multi- channel signal acquisition and analysis system (Acknowledge, Biopac system Inc., CA, USA).
In Paper III a sternotomy was performed and a diagonal branch of the left ante-rior descending (LAD) artery was identified and a tape snare was placed around the proximal part of LAD. In Paper IV a laparotomy was made, the hepato- duodenal ligament, containing the branches of the liver artery, portal vein, and bile- duct, was identified and encircled by a cotton tape. For both Papers III and IV the ends of the tape were extracted through tight plastic tubing. Ischemia was obtained by tightening and locking the tape against the tube using a forceps.
Microdialysis
All MD probes were perfused with a modified Krebs-Ringer phosphate buffer (Fresenius Kabi, Halden, Norway). A 60 minutes period of equilibration was al-ways allowed before starting the experimental protocol (in vivo). The CMA 600
Material and methods
analyser was used for analysis of glucose (papers I-IV), lactate (papers II-IV), pyruvate (papers II-IV), glycerol (papers II-IV) and urea (paper I). Results in paper II changed our routines concerning MD sampling and analyses. In papers III-IV the MD samples were collected in glass vials and sealed with crimp caps that were kept in place during analyse. The MD samples were always centrifuged for 30 seconds (1177 g) before analyses (Paper III and IV) (45).
Experimental protocol Paper I
The experimental protocol consisted validation of the CMA 600 analyser, in vitro calibration, probe control and in vivo calibration using the NNF- calibration method. All samples were collected in plastic vials that were sealed with plastic caps for storage. The caps were removed before analyses which mean that vials were unsealed during analysis. During the in vitro calibration the influence of time and flow rate on recovery was examined. A CMA 60 catheter (CMA Microdialysis, Solna, Sweden) was placed in a glucose solution of known concentration and perfused at 1 µL/min. Sampling times were set at 10, 20 and 30 minutes. The flow rate was thereafter changed (0.3, 0.5, 1, 2 and 5 µL/min) and a constant sampling volume of 10 µL was collected.
Probe membrane function of 14 CMA 20 microdialysis probes was tested in vitro after experimental studies in animals. The probes were placed in a 5 mmol/L glucose solution and tested at a flow rate of 2 µL/min with a sampling time of 10 minutes. Each probe was tested in vitro for these consecutive sampling period of 10 minutes each.
The NNF method was performed by placing a CMA 20 probe in subcutaneous tissue (n=7). Four different Ringer solutions of glucose and Urea of known concen-trations (0.5, 2, 5 and 10 mmol/L) were perfused through the probe at a flow rate of 2 µL/min for one hour/concentration. Samples were collected every 10 minutes after a 30 minutes equilibration period.
Paper II
Standardised solutions for glucose, lactate, pyruvate and glycerol, all in ‘low’, ‘medium’ and ‘high’ concentrations were used as ‘test’ samples (Figure 5). Each ‘batch’ comprised 24 samples (vials), and each vial was prepared with 20 µL of the respective standard solution. All samples were analysed in a CMA 600 analyser. All samples (except when specifically noted, in the case of refrigeration) were stored in the same freezer at –20o C.
Material and methods
Concentration Low Me di um Hi gh Concentration Low Me di um Hi gh batch A D G Glucose (mM) 0,45 2,3 4,5 B E H Lactate (mM) 1 5 10 C F I Pyruvate (µM) 130 651 1300 Glycerol (µM) 130 644 1290each batch contains 24 samples; each sample contains 20 µL
DAY 0 DAY 0 DAY 3 DAY 60
24 samples
batch 24 samples Freezer 24 samples Freezer 24 samples
A D G ANALYSIS -20°C ANALYSIS -20°C ANALYSIS 24 samples
batch Freezer 24 samples Freezer 24 samples
B E H -20°C ANALYSIS -20°C ANALYSIS
24 samples
batch Freezer 24 samples
C F I -20°C ANALYSIS
Figure 5. Protocol for sample preparation, analyses, storage and re-analyses in plastic vials. Each
batch contained 24 samples with 20 µL sample volume of low, medium and high concentration of standard solution of glucose, lactate, pyruvate and glycerol, respectively.
mM: millimol/L, µM: micromol/L (Paper II)
Drift and re-analyses
All experiments were performed in batches (n=24) using plastic vials (CMA, Microdialysis, Solna, Sweden) with the same solution in each batch. The plastic vials were sealed with plastic caps for storage which were removed before analyses. Each test started with immediate analysis of batch A0. After analysis, the samples were stored in a freezer for 3 days, and then reanalysed (A3). The same samples were then stored in the freezer for 60 days, and then re-analysed a third time (A60). The same procedure was performed for the ‘low’, ‘medium’, and ‘high’ concentrations of each substance.
Storage at -20O C
Samples were placed in plastic vials without caps. Two batches of each solution were prepared in vials on day zero and then stored in a freezer for 3 days (B3, E3 and H3) or 60 days (C60, F60 and I60) before analysis. These results were compared with analyses on day zero (A0, D0 and G0).
Centrifugation
A group of samples prepared and handled in the same way as batch B3 was centrifuged (Mini Galaxy, VWR, West Chester, PA, USA) for 30 seconds (1177 g) before analyses (K3). These samples were restored in a freezer for 60 days and then analysed again after centrifugation. These results were compared with results for analyses of B3 and B60.
Material and methods
Vial materials, different capsOne batch of ‘low’ concentration solution was prepared and placed in plastic vials with crimp caps (Chromacol, CT, USA), glass vials (Chromacol, CT, USA) with crimp caps, and microvials (CMA Microdialysis, Solna, Sweden). The vials were centrifuged (1177 g) for 30 seconds before analysis. After analysis, they were stored in a freezer for three days and then re-analysed.
Storage in plastic or glass vials and crimp cap vs microvials, freezer or refrig-erator
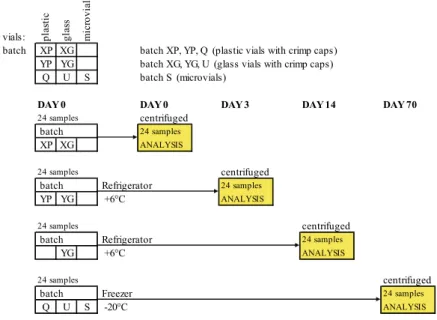
Five batches containing ‘low’ concentration solution were prepared in plastic and glass vials. One batch from plastic and glass vials, both with crimp caps, was analysed on days 0, 1, 2, 3 and 14 after storage in a refrigerator (Figure 6). All samples were centrifuged before analysis. Batches with plastic vials, microvials, and glass vials were stored in a freezer for 70 days and then centrifuged and analysed. vials: plas tic gla ss m icr ov ial
batch XP XG batch XP, YP, Q (plastic vials with crimp caps) YP YG batch XG, YG, U (glass vials with crimp caps)
Q U S batch S (microvials)
DAY 0 DAY 0 DAY 3 DAY 14 DAY 70
24 samples centrifuged batch 24 samples
XP XG ANALYSIS
24 samples centrifuged batch Refrigerator 24 samples
YP YG +6°C ANALYSIS
24 samples centrifuged batch Refrigerator 24 samples
YG +6°C ANALYSIS
24 samples centrifuged
batch Freezer 24 samples
Q U S -20°C ANALYSIS
Figure 6. Protocol for sample preparation, analyses, storage and re-analyses using different vials and
crimp caps. Each batch contained 24 samples with 20 µL sample volume of low concentration of standard solution of glucose, lactate, pyruvate and glycerol, respectively. (Paper II)
Paper III
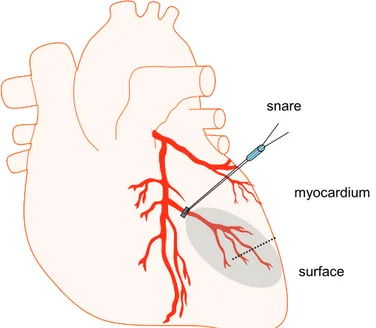
MD probes were placed in the myocardial tissue (myocardial probe) supplied by the snared LAD branch. A second MD probe was placed on the epicardial surface (surface probe) in the same area as the myocardial probe (Figure 7). The probes were secured with one suture placed over the membrane and one suture placed in the fixation point. MD probes were perfused at a flow rate of 2 µL/min and
Material and methods
samples were collected at 10 minute intervals throughout the study protocol. After an equilibration period of 60 minutes, during which MD samples were collected and analysed, animals were randomized in two groups according to a protocol for another study. One group, (n=10) labelled protocol 1, had a 150 minutes period without any intervention (baseline) before 50 minutes of ischemia induced by tightening the snare, control group. The second group, (n=9) labelled protocol 2, had a 30 minutes baseline period before four 10 minute periods of snare occlusion, each followed by 20 minutes of reperfusion (short ischemic period), before the 50 minutes ischemic period (long ischemic period).
snare
surface myocardium
Figure 7. Schematic picture over the heart, placement of the snare over the LAD branch and the MD
probe in the myocardium (dotted line) and on the surface of the heart (solid line). The ischemic area is shaded. (Paper III)
Paper IV
Four MD probes were placed on the surface of the liver (surface) and four probes (parenchyma) were placed in the liver parenchyma. Two MD probes on the liver surface and two in the liver parenchyma were perfused at a flow rate of 1 µL/min (n=13). The other two probes placed on the liver surface and in the liver parenchyma were perfused at a flow rate of 2 µL/min (n=9) (Figure 8). The MD samples were collected every 15 minutes. The protocol started with 60 minutes of equilibration followed by baseline measurement for 60 minutes, 45 minutes total occlusion of the portal vein and liver artery and therefore 60 minutes of reperfusion.
Material and methods
Figure 8. Schematic picture of the liver. MD probes placed on the liver surface (a, c) and MD probes
placed in the liver parenchyma (b, d). The probes were perfused with a flow rate of 2 µL/min and 1 µL/min, respectively. (Paper IV)
Interventions for paper III-IV
During Papers III and IV, ischemia in the heart and liver were used as inter-ventions to compare measurements of metabolic changes in the myocardium and liver parenchyma with metabolic changes on the surface of the myocardium and liver parenchyma. Ischemia is defined as a stop in arterial blood supply into a tissue, stoppage of delivery of blood-born substrates to tissues. The tissue is not able to find energy sources enough to meet its obligatory metabolic demands. Ischemia means that energy extraction will continue for a short period without oxygen based on anaerobic glycolysis. Pyruvate is consumed producing lactate during progressive anaerobic glycolysis, and pyruvate concentrations will decrease during prolonged ischemia. An increasing pattern in Lactate/Pyruvate (L/P)- ratio is commonly observed when anaerobic glycolysis is prolonged (16, 46).
Calculations
In Papers I, III and IV paired t-tests were performed (p< 0.05). In Paper II, to calculate the relation between time in the analysis machine and concentration (drift), linear regression analysis was performed. An estimation of the maximal time effect on concentration (absolute drift) was presented as the difference between the Y- value of the regression line at time 0 (sample 1) and time 192 minutes (sample 24). The concentration change in percent (drift %) was calculated as:
Material and methods
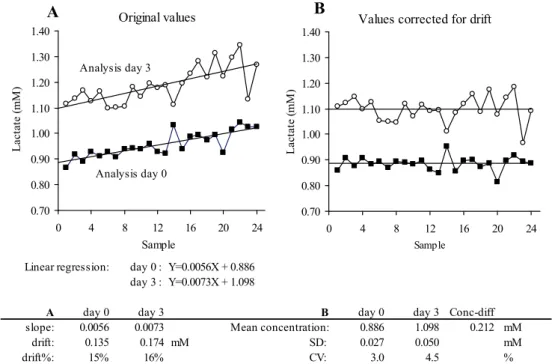
To calculate variation we subtracted each sample value from the corresponding part of the regression line. We then added the start value, Y-intercept (at time 0), to each calculated difference; this was functionally the same as placing the regression line, on the zero-level, and then adding the start value (Figure 9). This was done for both batches (Day 0 and Day 3) which enabled us to calculate the difference between mean concentrations for each batch (after correction for drift). Calculations of standard deviation (SD) and coefficient of variation (CV) for each batch were performed. Measured values are presented as mean ± SD. Independent samples T-test between groups was used for testing for differences in mean con-centration between two batches. A p-value of less than 0.05 was used for statistical significance. The one-sample Kolmogorov-Smirnov test was used to determine normality in results distribution.
Linear regression: day 0 : Y=0.0056X + 0.886 day 3 : Y=0.0073X + 1.098
A day 0 day 3 B day 0 day 3 Conc-diff
slope: 0.0056 0.0073 Mean concentration: 0.886 1.098 0.212 mM
drift: 0.135 0.174 mM SD: 0.027 0.050 mM drift%: 15% 16% CV: 3.0 4.5 % 0.70 0.80 0.90 1.00 1.10 1.20 1.30 1.40 0 4 8 12 16 20 24 L act at e ( m M ) Sample Analysis day 3 Analysis day 0 Original values A 0.70 0.80 0.90 1.00 1.10 1.20 1.30 1.40 0 4 8 12 16 20 24 L act at e ( m M ) Sample
Values corrected for drift
B
Figure 9. Examples of calculations made for each batch analysis of 24 samples, calculating the drift
and spread of each batch and the difference in concentration between the two batches. SD = Standard deviation, CV = Coefficient of variation. (Paper II)
In Papers III and IV measured values are presented as mean and for Paper III standard error of the mean (SEM) and for Paper IV 95% confidential interval. A paired comparison to measure differences in relative changes between probes was calculated with a 95% confidential interval (Papers III and IV). The analyses were performed with the SPSS software package (version 18.0; SPSS Inc., Chicago IL, USA). In Microsoft Excel calculation and figures were accomplished.
Results
RESULTS
Paper I
Flow rate vs. concentration
Figure 10 illustrates that glucose concentrations decreased when the flow rate was increased. The largest decrease in concentration occurred when the flow rate was increased from 2 µL/min to 5 µL/min.
0 1 2 3 4 5 6 0.3 0.5 1 2 5 G luc os e ( m m o l/L)
Flow rate (μL/min)
* * * * n= 10 10 10 9 10 # # # #
Figure 10. In vitro study. A CMA 60 catheter was placed in a glucose solution of known
concentration and perfused at 0.3, 0.5, 1, 2 and 5 µL/min. Data are presented as mean and 95% confidence intervals. * p<0.05 using between groups T-test vs. the lowest flow rate. # p<0.05 vs. the previous flowrate. (Paper I)
No Net Flux calibration method
Four different glucose and urea solutions of known concentrations were perfused through a CMA 20 probe placed in subcutaneous tissue. Samples were then analysed and plotted against known concentrations. The calculated glucose concentration was 4.4 mmol/L (Figure 11A). In the same way the real concentration of urea in subcutaneous tissue was calculated and found to be 4.1 mmol/L (Figure 11B).
Further results
A pilot study (n=1) showed that the concentration of pyruvate in the pancreas parenchyma (CMA 20 probe) was about 160 µmol/L (Figure 12A) as measured by the NNF method. Figure 12B show the difficulties to determine the true concentration of urea in the liver tissue (CMA 20 probe) using the NNF calibration method. The four different concentrations that were chosen for perfusion of the liver tissue resulted in a spread pattern with no possibility to draw a regression line.
Results
y = -0.1884x + 0.8219 R2 = 0.994 -2.0 -1.5 -1.0 -0.5 0.0 0.5 1.0 1.5 0 2 4 6 8 10 G luc os e C ou t C in ( m m ol /L)Glucose Cin (mmol/L)
A y = -0.2631x + 1.0658 R2 = 0.9984 -2.0 -1.5 -1.0 -0.5 0.0 0.5 1.0 1.5 0 2 4 6 8 10 12 U rea C out C in ( m m ol /L)
Urea Cin (mmol/L)
B
Figure 11. Determination of the true subcutaneous tissue concentration estimated by the NNF
calibration method. Four different solutions with known concentrations of glucose (panel A) and urea (panel B) were used as perfusate (C in). The glucose and urea concentration was found to be 4.4 mmol/L and 4.1 mmol/L. Data are presented as mean ±SEM, n=7. (Paper I)
Calculation method is shown in figure 3.
y = -0.4535x + 70.797 R2 = 0.9937 -200.0 -150.0 -100.0 -50.0 0.0 50.0 100.0 0 100 200 300 400 500 Py ru va te C ou t - C in (µ m ol /L )
Pyruvate Cin (µmol/L)
A -2.0 -1.5 -1.0 -0.5 0.0 0.5 1.0 1.5 2.0 0 1 2 3 4 5 6 U rea C out C in ( m m ol /L)
Urea Cin (mmol/L)
B
Figure 12. Pyruvate concentration in pancreas parenchyma (panel A) as estimated by the NNF
calibration method. Four different solutions with known concentrations of pyruvate were used as perfusate. The true pyruvate concentration was found to be 160 µmol/L.
Panel B shows Urea concentration in the liver parenchyma. Similarly, solutions with different known concentrations of urea were used as perfusate. Since it was impossible to draw a regression line this measurement could not calculate the real urea concentration. Data are presented as mean ±SEM, n=1.
Results
Paper II
All presented results are from samples with ‘low’ concentrations of glucose (0.45 mmol/L) and lactate (1.0 mmol/L).
Drift and reanalyses
The temperature inside the CMA 600 analyser was measured to be 27 °C. Pro-grammed batch analyses of 24 samples over 192 minutes showed a difference in concentration (drift) of 12-25% for the four substances (Table 1, paper II). Figures 13A and 13B show the drift over time for glucose and lactate during analysis on the first day and after 3 days of storage in a freezer.
0.0 0.1 0.2 0.3 0.4 0.5 0.6 0 4 8 12 16 20 24 0.8 1.0 1.2 1.4 1.6
Glucose (mmol/L) Lactate (mmol/L) Analyse day 0 Sample A 0.0 0.1 0.2 0.3 0.4 0.5 0.6 0 4 8 12 16 20 24 0.8 1.0 1.2 1.4 1.6 Glucose (mmol/L) Lactate (mmol/L)
Analyse day 3
Sample B
Figure 13. Drift and re-analysis. Batch analysis (24 samples) of a low standard solution of glucose
(0.45 mmol/L) and lactate (1.0 mmol/L)) using plastic vials without caps. Panel A shows the samples with glucose and lactate that were analysed during a batch analysis the first day (A0) compared with panel B were the same samples were analysed after 3 days after storage in -20 °C (A3). (Paper II)
Freezer storage (-20O C)
There were no differences in concentrations of glucose, lactate, pyruvate and glycerol in samples analysed after 60 days of storage in a freezer (-20OC)
compaired to analyses in the first day (Figures 14A and 14B).
Centrifugation
Variation between samples in one batch analyse was reduced with centrifuga-tion (Figures 15A and 15B).
Results
0.0 0.1 0.2 0.3 0.4 0.5 0 4 8 12 16 20 24 A0 C60 Glucose (mmol/L) Sample A 0.0 0.3 0.6 0.9 1.2 0 4 8 12 16 20 24 A0 C60 Lactate (mmol/L) Sample BFigure 14. Storage in a freezer at -20 °C. Glucose (panel A) and lactate (panel B) analysed at day 0
(A0) and after 60 days in a freezer (C60). These figures illustrate that concentration of glucose (panel A) and lactate (panel B) were not changed after 60 days of storage. Note that concentrations and drift are similar when comparing samples analysed on day 0 and day 60. (Paper II)
0.30 0.40 0.50 0.60 0 4 8 12 16 20 24 B3 K3 Glucose (mmol/L) Samples A 0.5 0.7 0.9 1.1 1.3 0 4 8 12 16 20 24 B3 K3 Lactate (mmol/L) Samples B
Figure 15. Centrifugation before analyses. Samples with glucose (panel A) and lactate (panel B) were
analysed after 3 days in a freezer. One batch was centrifuged before analyses (K3) compared to samples that were not centrifuged (B3). (Paper II)
Vial materials, different caps
During batch analysis, on the first day the drift was similar regardless of which vials were used for analyses. After 3 days in the freezer, samples in plastic vials with crimp caps and microvials had a larger change in concentration in glucose and pyruvate compared to samples stored in glass vials with crimp caps (Table 2, paper II). The main finding in this respect was that re-analysis of samples (all) was associated with higher concentrations (Figure 16A and 16B).
Results
0.0 0.1 0.2 0.3 0.4 0.5 0.6 0 4 8 12 16 20 24 T0 T3 Glucose (mmol/L) Sample A 0.0 0.2 0.4 0.6 0.8 1.0 1.2 1.4 0 4 8 12 16 20 24 T0 T3 Lactate (mmol/L) Sample BFigure 16. Vial materials, crimp caps. Analyses of solutions in glass vials sealed with crimp caps.
These figures illustrate that concentrations of glucose (panel A) and lactate (panel B) were not changed during a batch analyse on day 0 (T0) and after 3 days of storage in a freezer (T3). (Paper II)
Storage in refrigerator: plastic with crimp caps or glass vials with crimp caps Samples kept in plastic vials with crimp caps demonstrated an increased concentration during storage in a refrigerator for 3 days (Figure 17A). When samples were kept in glass vials with crimp caps glucose concentrations were unchanged during 14 days of storage in a refrigerator (Figure 17B).
0.3 0.4 0.5 0.6 0.7 0.8 0 4 8 12 16 20 24 Day 0 Day 3 G luc os e ( m m ol/ L ) Sample Plastic vials A 0.3 0.4 0.5 0.6 0.7 0.8 0 4 8 12 16 20 24 Day 0 Day 14 G luc os e ( m m ol /L ) Sample Glass vials B
Figure 17. Different vial materials with crimp caps. Analyses of glucose. Panel A shows results from
samples analysed on Day 0 and samples stored in plastic vials sealed with crimp caps in a refrigerator for three days. Panel B shows results from samples analysed on Day 0 and samples stored in glass vials sealed with crimp caps in a refrigerator for 14 days. (Paper II)
Results
Paper III
The main finding in Paper III was that measurement of glucose, lactate,
pyruvate and glycerol on the surface of the myocardium reflects relative changes in the myocardium.
Lactate
Absolute concentration
Absolute lactate concentrations during baseline were significantly higher in samples obtained from the surface probe compared with samples from the myocardial probe in both protocol 1 and 2 (Table 1).
Table 1. Absolute concentrations in microdialysate samples from a probe on the
surface (S) of the heart and from a probe in the myocardium (M) during baseline (time 0), the four short ischemic periods and at the end of the long ischemic period. The baseline values were calculated as the group mean of the first two samples, short ischemia is a grouped mean over the four peak values and the long ischemia is a mean over the last sample during the ischemic period.
Substance Protocol 1 Lactate - S (mM) 1.46 ± 0.59 * 5.03 ± 1.44 Lactate - M (mM) 1.01 ± 0.36 4.03 ± 1.11 Glucose - S (mM) 2.00 ± 0.67 0.42 ± 0.32 Glucose - M (mM) 1.76 ± 0.37 0.29 ± 0.23 Pyruvate - S (µM) 71.3 ± 18.7 * 92.9 ± 40.2 * Pyruvate - M (µM) 26.0 ± 11.9 33.7 ± 26.2 Glycerol - S (µM) 54.0 ± 37.5 127.8 ± 44.4 Glycerol - M (µM) 57.4 ± 36.8 201.3 ± 94.9 * Protocol 2 Lactate - S (mM) 1.42 ± 0.34 * 2.32 ± 0.56 3.44 ± 1.22 Lactate - M (mM) 0.83 ± 0.23 2.08 ± 0.67 3.17 ± 1.30 Glucose - S (mM) 2.60 ± 0.90 1.77 ± 0.41 0.75 ± 0.73 Glucose - M (mM) 2.06 ± 0.48 1.27 ± 0.41 0.42 ± 0.30 Pyruvate - S (µM) 65.8 ± 28.0 * 102.0 ± 46.8 111.6 ± 35.3 * Pyruvate - M (µM) 31.2 ± 10.9 60.4 ± 18.1 51.9 ± 24.6 Glycerol - S (µM) 46.3 ± 35.3 38.3 ± 24.4 46.0 ± 32.7 Glycerol - M (µM) 39.7 ± 38.3 43.0 ± 33.7 64.6 ± 45.8 Baseline Short ischemia Long ischemia
Data are presented as mean ± 95% confidence intervals, * p< 0.05 using paired T-test.
S: Surface probe; M: Myocardial probe; mM: millimol/L; µM: micromol/L. Protocol 1: n=10 for all substances. Protocol 2: n=9 for lactate and glucose and n=8 for pyruvate and glycerol. (Paper III)
Results
Relative changesBoth probes showed the same pattern with increased and decreased relative changes in concentrations during baseline, ischemic periods and reperfusion, respectively (Figures 18A-18B). A comparison between relative changes in lactate concentrations obtained from both probes revealed a similar pattern throughout the study protocol (Figures 18C-18D).
-1 0 1 2 3 4 5 6 -60 -30 0 30 60 90 120 150 180 R e l. La ct at e ( m M ) A Protocol 1 B I E Time (min) -1 0 1 2 3 4 5 6 -60 -30 0 30 60 90 120 150 180 I R e l. La ct at e ( m M ) B Protocol 2 B I E Time (min) I I I -2 -1 0 1 2 3 4 5 -60 -30 0 30 60 90 120 150 180 R e l. L a ct at e di ffer enc e ( m M ) Protocol 1 B I E
Surface probe - Myocardial probe C Time (min) -2 -1 0 1 2 3 4 5 -60 -30 0 30 60 90 120 150 180 R e l. Lac ta te di ffer ence (m M ) Protocol 2 B I E D Time (min) I I I I
Surface probe - Myocardial probe
Figure 18. Lactate. Panels A and B depicts relative changes in lactate concentrations from baseline
(time 0) based on data obtained from the surface probe (open squares) and the myocardial probe (filled triangles). Panels C and D depicts paired comparisons of relative changes in lactate concentrations between the surface probe and the myocardial probe at corresponding time points (filled circles). Data are presented as mean ±SEM (panels A and B) and as mean ±95% confidence intervals (panels C and D). E=Equilibration time, B=Baseline, I=Ischemia. Protocol 1, n=10 and protocol 2, n=9. mM: millimol/L (Paper III)
Results
Glucose
Absolute concentration
There were no significant differences in absolute glucose concentration in samples from the surface probe compared with samples from the myocardial probe for both protocol 1 and 2 (Table 1).
-3 -2 -1 0 1 2 -60 -30 0 30 60 90 120 150 180 R e l. G luc ose ( m M ) A Protocol 1 B I E Time (min) -3 -2 -1 0 1 2 -60 -30 0 30 60 90 120 150 180 R e l. G lucose ( m M ) B Protocol 2 B I E Time (min) I I I I -2 -1 0 1 2 -60 -30 0 30 60 90 120 150 180 R e l. G luc ose di ffer ence ( m M ) Protocol 1 B I E C Time (min)
Surface probe - Myocardial probe
-2 -1 0 1 2 -60 -30 0 30 60 90 120 150 180 Rel . G luc os e di ffe re n ce ( m M ) Protocol 2 B I E D Time (min) I I I I
Surface probe - Myocardial probe
Figure 19. Glucose. Panels A and B depicts relative changes in glucose concentrations from baseline (time 0) based on data obtained from the surface probe (open squares) and the myocardial probe (filled triangles). Panels C and D depicts paired comparisons of relative changes in glucose concentrations between the surface probe and the myocardial probe at corresponding time points (filled circles). Data are presented as mean ±SEM (panels A and B) and as mean ±95% confidence intervals (panels C and D). E=Equilibration time, B=Baseline, I=Ischemia.
Results
Relative changesRelative changes in glucose concentrations obtained from both probes showed a similar pattern, with no significant difference between the surface and myocardial probe during baseline, short ischemia and long ischemia. Note that the surface probe did not show the same pattern (though inverted) as the myocardial probe with decreased and then increased glucose concentrations during short ischemia periods and reperfusion (Figures 19A-19D).
Pyruvate
Absolute concentration
Absolute values for pyruvate concentrations were significantly higher in sam-ples obtained from the surface probe during baseline and long ischemic period for both protocol 1 and 2 (Table 1).
Relative changes
There was a tendency towards higher concentrations in samples obtained from the myocardial probe during the long baseline period in protocol 1, but not during any of the other periods, i.e. ischemia and reperfusion (Figures 20A-20D).
Glycerol
Absolute concentration
Absolute glycerol concentrations in samples obtained from the myocardial probe were significantly higher than concentrations in samples from the surface probe during the long ischemic period in protocol 1 (Table 1). There were no other significant differences in absolute concentrations between samples obtained from both probes.
Relative changes
A comparison between relative changes in glycerol concentrations obtained from both probes revealed a similar pattern throughout the study (Figures 21A-21D).
Results
-40 -20 0 20 40 60 80 -60 -30 0 30 60 90 120 150 180 R e l. P yru va te (µ M ) A Protocol 1 B I E Time (min) -40 -20 0 20 40 60 80 -60 -30 0 30 60 90 120 150 180 R e l. P yru va te (µ M ) Protocol 2 B I E Time (min) I I I I B -150 -100 -50 0 50 100 150 -60 -30 0 30 60 90 120 150 180 R e l. Py ru vat e di ffe rence ( µ M ) Protocol 1 B I E C Time (min)Surface probe - Myocardial probe
-150 -100 -50 0 50 100 150 -60 -30 0 30 60 90 120 150 180 R e l. Py ru vat e di ffe rence ( µ M ) Protocol 2 B I E Time (min) I I I I
D Surface probe - Myocardial probe
Figure 20. Pyruvate. Panels A and B depicts relative changes in pyruvate concentrations from
baseline (time 0) based on data obtained from the surface probe (open squares) and the myocardial probe (filled triangles). Panels C and D depicts paired comparisons of relative changes in pyruvate concentrations between the surface probe and the myocardial probe at corresponding time points (filled circles). Data are presented as mean ±SEM (panels A and B) and as mean ±95% confidence intervals (panels C and D). E=Equilibration time, B=Baseline, I=Ischemia. Protocol 1, n=10 and protocol 2, n=8. µM: micromol/L (Paper III)
Results
-50 0 50 100 150 200 250 -60 -30 0 30 60 90 120 150 180 R e l. G lyc er ol ( µ M ) A Protocol 1 B I E Time (min) -50 0 50 100 150 200 250 -60 -30 0 30 60 90 120 150 180 R e l. G ly ce ro l (µ M ) B Protocol 2 B I E Time (min) I I I I -200 -150 -100 -50 0 50 100 150 200 -60 -30 0 30 60 90 120 150 180 R e l. G lyc er ol di ffe rence ( µ M ) Protocol 1 B I E C Time (min)Surface probe - Myocardial probe
-200 -150 -100 -50 0 50 100 150 200 -60 -30 0 30 60 90 120 150 180 R e l. G lycer o l d iff er e n ce ( µ M ) Protocol 2 B I E D Time (min) I I I I
Surface probe - Myocardial probe
Figure 21. Glycerol. Panels A and B depicts relative changes in glycerol concentrations from baseline
(time 0) based on data obtained from the surface probe (open squares) and the myocardial probe (filled triangles). Panels C and D depicts paired comparisons of relative changes in glycerol concentrations between the surface probe and the myocardial probe at corresponding time points (filled circles). Data are presented as mean ±SEM (panels A and B) and as mean ±95% confidence intervals (panels C and D). E=Equilibration time, B=Baseline, I=Ischemia. Protocol 1, n=10 and protocol 2, n=8. µM: micromol/L (Paper III)
Results
Paper IV
Oxygen tension in the liver parenchyma fell from a mean of 41 mm Hg (range 22-55 mm Hg) to a mean of 7 mm Hg (range 0-25 mm Hg) during the period when the cotton tape encircling the portal vein and hepatic artery was kept tightened (n=9). Tissue oxygen tension remained at the attained level until the cotton tape was loosened. Thus, transient liver ischemia was achieved using the experimental model (Figure 22).
The main finding in Paper IV was that measurements of glucose, lactate and glycerol on the liver surface reflect relative changes in the liver parenchyma. MD data are presented as relative changes for the concentration of glucose, lactate, pyruvate and glycerol.
0 10 20 30 40 50 60 -60 0 60 120 180 PO 2 ti ss ue ( m m H g) Time (minutes) I R
Figure 22.PO2 tissue (mm Hg) in liver parenchyma during 45 min liver ischemia (I) and 60 min
Results
Lactate
In protocol 1 (1 µL/min), no significant differences in relative changes of lactate levels were seen between samples from surface probes and probes in liver parenchyma during equilibration, baseline, ischemia or reperfusion (Figures 23A and 23C). In protocol 2 (2 µL/min), significant differences in relative changes of lactate levels were observed in samples from the surface probes and probes in liver parenchyma during 15 to 45 min of ischemia (Figures 23B and 23D).
-1 0 1 2 3 4 5 6 -60 0 60 120 180 MD -L ac ta te ( mM) A Time (minutes) E B I R Protocol 1 -1 0 1 2 3 4 5 6 -60 0 60 120 180 MD -L ac ta te ( mM) B Time (minutes) E B I R Protocol 2 -2 -1 0 1 2 -60 0 60 120 180 M D -L ac ta te di ff er en ce ( m M ) Time (minutes)
Surface probe - Parenchymal probe
C E B I R Protocol 1 -2 -1 0 1 2 -60 0 60 120 180 M D -L ac ta te di ff er en ce ( m M ) Time (minutes)
Surface probe - Parenchymal probe
D
E B
I R
Protocol 2
Figure 23. Lactate. Panels A-B depicts relative changes in lactate concentrations from baseline (time 0-60) based on data obtained from the liver surface probe (open squares) and the liver parenchymal probe (filled triangles). The flow rate was 1 µL/min in protocol 1, n=13 (panels A, C) and 2 µL/min in protocol 2, n=9 (panels B, D). Panels C-D depicts paired differences of relative changes in lactate concentrations between the surface probe and the parenchymal probe at corresponding time points (filled circles). E=Equilibration time, B=Baseline, I=Ischemia (shaded), R=Reperfusion. Data are presented as mean ±95% confidence intervals. mM: millimol/L (Paper IV)
Results
Glucose
During the equilibration period, relative changes were significantly less pronounced in samples from surface probes as compared to samples from probes in liver parenchyma in protocol 2 (Figures 24B and 24D). No significant differences in relative changes in glucose levels were observed between samples from the liver surface and samples from the liver parenchyma during equilibration (protocol 1), baseline, ischemia or reperfusion for both protocols 1 and 2 (Figures 24A- 24D).
-2 0 2 4 6 8 10 12 14 -60 0 60 120 180 M D -G lu co se ( m M ) A Time (minutes) E B I R Protocol 1 -2 0 2 4 6 8 10 12 14 -60 0 60 120 180 M D -G lu co se (m M ) B Time (minutes) E B I R Protocol 2 -5 -4 -3 -2 -1 0 1 2 3 4 5 -60 0 60 120 180 M D -G lu co se di ff er enc e (m M ) Time (minutes)
Surface probe - Parenchymal probe
C E B I R Protocol 1 -5 -4 -3 -2 -1 0 1 2 3 4 5 -60 0 60 120 180 M D -G lu co se di ff er enc e (m M ) Time (minutes)
Surface probe - Parenchymal probe
D
E B
I R
Protocol 2
Figure 24. Glucose. Panels A-B depicts relative changes in glucose concentrations from baseline (time 0-60) based on data obtained from the liver surface probe (open squares) and the liver parenchymal probe (filled triangles). The flow rate was 1 µL/min in protocol 1, n=13 (panels A, C) and 2 µL/min in protocol 2, n=9 (panels B, D).Panels C-D depicts paired differences of relative changes in glucose concentrations between the surface probe and the parenchymal probe at corresponding time points (filled circles). E=Equilibration time, B=Baseline, I=Ischemia (shaded), R=Reperfusion. Data are presented as mean ±95% confidence intervals. mM: millimol/L (Paper IV)
Results
Pyruvate
No significant differences in relative changes in pyruvate levels were noted in samples from surface probes and probes in liver parenchyma during equilibration, baseline or reperfusion (protocols 1 and 2) (Figures 25A-25D). During the latter phase of ischemia, relative changes were significantly more pronounced in samples from surface probes as compared to samples from probes in liver parenchyma, for protocols 1 and 2 (Figures 25A-25D).
-50 0 50 100 150 200 250 -60 0 60 120 180 M D -P yr uv at e ( µ M ) A Time (minutes) E B I R Protocol 1 -50 0 50 100 150 200 250 -60 0 60 120 180 M D -P yr uv at e ( µ M ) B Time (minutes) E B I R Protocol 2 -100 -50 0 50 100 150 200 250 -60 0 60 120 180 M D -P yr uv at e di ff ere nc e (µ M ) Time (minutes)
Surface probe - Parenchymal probe
C E B I R Protocol 1 -100 -50 0 50 100 150 200 250 -60 0 60 120 180 M D -P yr uv at e di ff er enc e ( µ M ) Time (minutes)
Surface probe - Parenchymal probe
D
E B
I R
Protocol 2
Figure 25. Pyruvate. Panels A-B depicts relative changes in pyruvate concentrations from baseline (time 0-60) based on data obtained from the liver surface probe (open squares) and the liver parenchymal probe (filled triangles). The flow rate was 1 µL/min in protocol 1, n=13 (panels A, C) and 2 µL/min in protocol 2, n=9 (panels B, D). Panels C-D depicts paired differences of relative changes in pyruvate concentrations between the surface probe and the parenchymal probe at corresponding time points (filled circles). E=Equilibration time, B=Baseline, I=Ischemia (shaded), R=Reperfusion. Data are presented as mean ±95% confidence intervals. µM: micromol/L (Paper IV)
Results
Glycerol
During ischemic phase relative changes in glycerol levels were significantly less pronounced in samples from surface probes as compared to samples from probes in liver parenchyma, for both protocols 1 and 2 (Figures 26A-26D).
-100 0 100 200 300 400 500 600 700 -60 0 60 120 180 M D -G ly ce ro l (µ M ) A Time (minutes) E B I R Protocol 1 -100 0 100 200 300 400 500 600 700 -60 0 60 120 180 M D -G ly ce ro l (µ M ) B Time (minutes) E B I R Protocol 2 -400 -300 -200 -100 0 100 -60 0 60 120 180 M D -G ly ce ro l di ff er enc e ( µ M ) Time (minutes)
Surface probe - Parenchymal probe
C E B I R Protocol 1 -400 -300 -200 -100 0 100 -60 0 60 120 180 M D -G ly ce ro l di ff er enc e ( µ M ) Time (minutes)
Surface probe - Parenchymal probe
D
E B I R
Protocol 2
Figure 26. Glycerol. Panels A-B depicts relative changes in glycerol concentrations from baseline (time 0-60) based on data obtained from the liver surface probe (open squares) and the liver parenchymal probe (filled triangles). The flow rate was 1 µL/min in protocol 1, n=13 (panels A, C) and 2 µL/min in protocol 2, n=9 (panels B, D). Panels C-D depicts paired differences of relative changes in glycerol concentrations between the surface probe and the parenchymal probe at corresponding time points (filled circles). E=Equilibration time, B=Baseline, I=Ischemia (shaded), R=Reperfusion. Data are presented as mean ±95% confidence intervals. µM: micromol/L (Paper IV)