Spring Term 2018
Magister’s thesis in Human Geography, 15 ECTS
Master’s Programme in Human Geography with specialization in Geographical Information Systems (GIS), 60 ECTS
Department of Geography and Economic History, Umeå University Supervisor: Emma Lundholm
Adama Blekou
Last version: June 3, 2018Assessing the walking access to bus stops in Umeå
urban area and the relationship with the
socio-economic characteristics
ACKNOWLEDGEMENT
ACKNOWLEDGEMENT
I would first like to thank my thesis advisor Emma Lundholm, Senior Lecturer at the Department of Geography and Economic History for her availability and for the wise advices about the research and the writing. She consistently allowed this paper to be my own work, but steered me in the right the direction whenever she thought I needed it.
I would also like to thank the main teachers of the Master’s Programme in Human Geography with specialization in Geographical Information Systems (GIS), Magnus Strömgren (Senior Lecturer) and Olof Olsson (Senior Lecturer) as well as the other teachers for the quality of teaching in an environment conductive to success.
Finally, I must express my very profound gratitude to my husband Didier Blekou for providing me unfailing support and continuous encouragement throughout this two years of study at Umeå University and through the process of researching and writing this thesis. This accomplishment would not have been possible without him.
Abstract
To reduce greenhouse gas emissions in the atmosphere and protect the environment, Swedish cities are heavily invested in sustainable development by developing pedestrian roads and intensifying public transport. Their goal is to make the population less dependent on cars by facilitating accessibility to transit transport. The urban area of Umeå (Sweden), which is experiencing an annual increasing of it population due to urban development, includes 244 km of pedestrian or bike routes and an intensified bus network. The purpose of this paper is to evaluate the walking accessibility of the population at bus stops and to analyze the socio-economic relationship. The use of GIS tools allowed to calculate the proportion of the population and the houses around the bus stop, the average distance accessibility. The use of 3D allowed the observation of access constraints related to the topography and to calculate the slope. The use of the multiple regression model has analyzed the relationship between the shortest accessibility distance and the socio-economic factors that are the income, gender and age. The results show that the average distance of access to the bus stop is 186m. 99.2% of the population lives within 800m from the bus stops. The results of the regression showed that income is the main factor that pushes people to take the bus and live in certain types of housing. The observation of the 3d map and the calculation of the slope made it possible to know the neighborhoods established in the hill and whose residents are susceptible to spend more energy than the other inhabitant living on flat ground. The results mean that most people living in the urban area of Umeå have good access to the bus stop whatever the social group, the level of income and the type of housing.
Keywords: Bus stop, Accessibility, GIS, Network analysis, Service area, Closest
Table of contents
Table of contents
1. Introduction ... 1
2. Aims and Research questions ... 3
3. Theoretical framework and previous studies ... 4
3.1. Accessibility ... 4
3.2. Walking access to bus stop ... 5
3.2.1. Walking distance access to bus stop ... 6
3.2.2. Walking speeds ... 6
3.2.3. Public transit access and health ... 6
3.2.4. Walking distance and constraints ... 7
3.3. Walking distance with socio-economic factors. ... 8
3.3.1. Income ... 8
3.3.2. Gender ... 9
3.3.3. Age ... 9
4. The study area ... 11
4.1. Local traffic ... 11
5. Methodology ... 13
5.1. Methodological choices ... 13
5.2. Geographical information system (GIS) ... 14
5.3. Data... 15
5.4. Integrate tool ... 19
5.5. Multimodal network dataset ... 19
5.6. Service Areas ... 20
5.7. Shortest network distance to bus stop ... 20
5.8. Summarize statistic ... 21
5.9. The ordinary least square regression analysis ... 21
5.10. Topographic constraint observation and the slope calculation... 22
5.11. Ethical considerations ... 22
6. The result analysis ... 23
5.1. Research question 1: The maximum walking distance so that most residents can reach the bus stop. ... 23
6.1.1. Income ... 26
6.1.3. Age ... 27
6.2. Research question 2: Are the closest distance to bus stop is the same for all neighborhoods and houses in Umeå city? ... 27
6.3. Research question 3: Is there relationship between access distance and the socio- economic characteristics? ... 29
6.3.1. Income ... 29
6.3.2. Gender ... 29
6.3.3. Age ... 30
6.3.4. The housing ... 30
6.4. Research question 4: Is the topography influences access to bus stops? ... 32
7. Concluding discussion ... 33
8. Summary ... 37
9. Reference: ... 38
List of figures
List of figures
Figure 1.The relationship between the accessibility and its components ... 5
Figure 2. The hill pattern gradient ... 7
Figure 3. Umeå urban area localization in the municipality and in Sweden ... 11
Figure 4. The traffic network overview in the urban area ...12
Figure 5. The daily bus traffic map ...12
Figure 6. Difference between the Euclidean (a) and the network distance (b) ...14
Figure 7. The population percentage in the urban area (by 250 meter square) ...16
Figure 8. The average population distribution in the urban area ...16
Figure 9. The average income distribution ... 17
Figure 10. The different housing shares in the municipality. ... 17
Figure 11. The different housing distribution ... 18
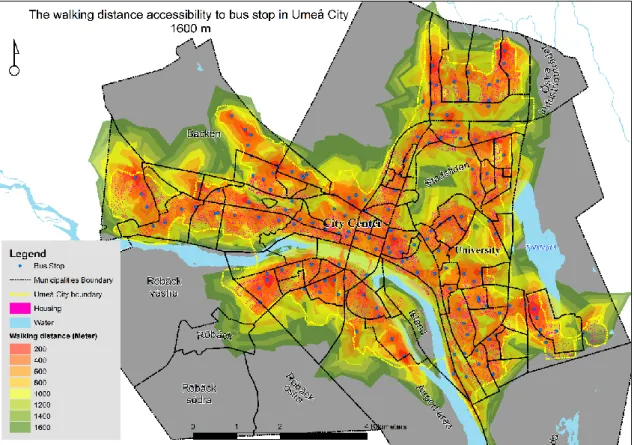
Figure 12. The bus stop accessibility within 1600 m covering the urban areas ... 24
Figure 13. The bus stop accessibility within the ideal walking distance (400m) ... 24
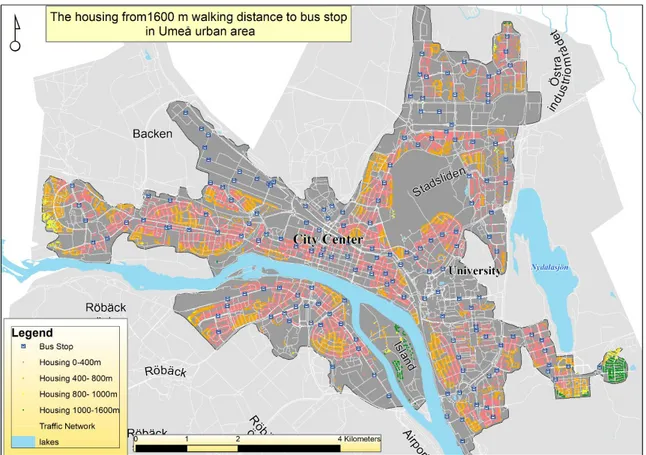
Figure 14. The bus stop accessibility from houses ... 25
Figure 15. The selected bus stop for the population analysis ... 26
Figure 16. The shortest network distance from housing to bus stop in Sofiehem and Umeå City center ... 28
Figure 17. The shortest network distance share from the housing and population to bus ... 29
List of table
Table 1. The files used for the analyze and their provenance ... 15
Table 2: The road structuration ... 18
Table 3. The walk distance and walk time expression ... 20
Table 4: The explanatory variables for the regression analysis ...21
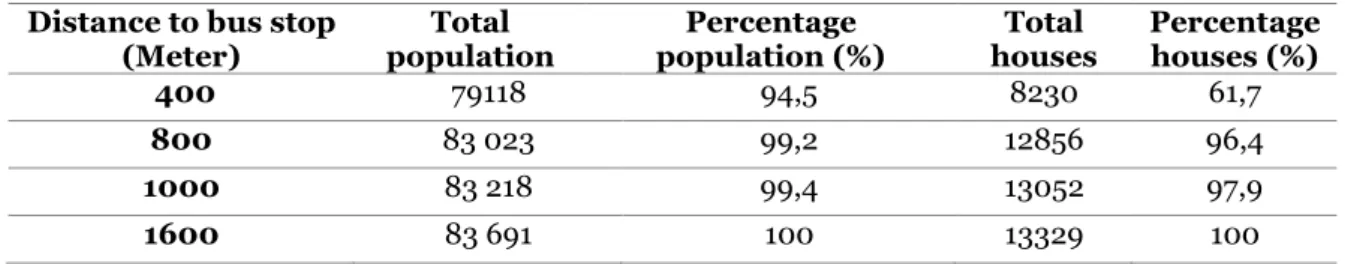
Table 5. The population and housing share within a distance to bus stops in Umeå urban areas ... 23
Table 6. The summary statistic of the shortest distance network to bus stop ... 28
Table 7. The OLS regression between the shortest distances to bus stop and the individual incomes ... 29
Table 8. The OLS regression between the shortest distances to bus stop and gender ... 30
Table 9. The OLS regression between the shortest distances to bus stop and population age 30 Table 10. The OLS regression between the shortest distances to bus stop and housing ... 31
List of appendixes
Appendix 1 ... 43Appendix 2 ... 44
1 Introduction
1. Introduction
The urbanization is defined as the transformation of rural areas into a city. It is closely linked to the economic growth and the development of the transportation system. Transportation has played an important role in shaping the city and in the movement of goods and services. Before the industrial revolution in the world, the transportation system in cities was pedestrian. They occupied only 10% of the city land use (Rodrigue, 2016, p. 256). The industrial revolution with the creation of the first automobiles had bring change in the shape of cities.
Transportation systems play an important role in the interaction between the land use components (demand and opportunities locations) by the moving of people, goods and services. For the human mobility from home to workplaces, a large part of the urban population has low incomes and is not able to buy cars for own trips. The authorities of cities have put in place public transits which serve more for the social and equity interests than for the economic benefits (Rodrigue, p. 272). In the 21st century, motorized cities with very dense road networks can affect the health of the population and negatively affect the environment. The impact on the population are noises and the emission of Carbone monoxide which is toxic for the human health (Rodrigue, p. 288). The impact on the environment and the ecosystem are the soil and the plant acidification (acid rain), the destruction of the ozone and the global warming (greenhouse effect). The transport sector occurs 15% of the global Carbone dioxide (Rodrigue, p. 289).
For the preservation of nature and sustainable development, some countries are committed to making their cities more ecological. In order to limit CO2 emissions, Swedish urban areas are designed to respect the principles of sustainable development. Transit networks are intensified. Pedestrian and bicycle tracks are highly developed and are mostly separated from car traffic systems. Green spaces in urban areas are preserved and taxes are imposed on motorists. City. That is why Sweden ranked first in 2016 as the greenest country by the Global Green Economy Index (GGEI) (Tamanini, 2016, p. 11) with a score of (77.6) ahead of Norway (66.1) and Finland (67.8). In the ranking of sustainable cities, Stockholm ranks second with 87.1% after Zurich (87.9%) according to Arcadis (Arcadis, 2016).
The public transit describes the use of urban transportation modes for short-distance mobility demands. The use of urban transport modes depends on the density of the population living in the city and its surroundings. If the demand is higher, the transit system will be more productive (Rodrigue, 2016). Several modes of transport characterize the transit system. This can be the use of buses, trains, subways and ferries. These different modes of transport can coexist in the same city. They give to users the choice to access services easily depending on their incomes. However only metropolitan municipalities like Stockholm, Göteborg and Malmö contain several transit transports. In Swedish middle-sized cities like Umeå, the bus is the only transit transport which is easily accessible by the users. The bus transit has the capacity to carry many people and contains seating and standing capacity. It offers space for strollers and wheelchair. The advantage of buses are they allow people to access
2 facilities with affordable rates. The authorities of Umeå’s municipality plan to transform the European motorways E4 and E12 which crosses the urban area in green space with more roads for passenger pedestrians and cyclists (Umeå kommun, 2018a). Currently, the urban area has 224 km of pedestrian and bicycle routes as well as an intensified bus network which serves 165 bus stops (Umeå kommun, 2018b).
The bus stops are located near the residences and allow the population to have easy access to the transit bus following a pattern of arrival and departure. However in the past, the Swedish Gender Equality Council for Transport and ITs (Jämit) reported that the transport structures were clearly dominated by men because women are absent from the Swedish Road Administration (Vägverket) (Statens Offentliga utredningar, 2001, p. 15). Transport policies have been defined without considering women needs and have been shaped to men needs (Simićević, 2016). It is why the social equity between men and women in transport is a priority for the Government. The gender equality policy states that the same right, opportunities and obligations apply to women and men. However, it exists a difference between men and women concerning the use, the need and the attitudes to travel (län, 1998, p. 33). The government states also that people with incapacity to live in the same way as the citizens and to participate in the social life. For this to be achieved, the physical environment including the transport system is required for disabled people (Ibid.).
If there is equity in the use of public mode of transport, it is therefore important to assess the walking accessibility to transit transport. Then, to evaluate the relationship between the walking distances to bus stops with socio-economic characteristics.
3 Aims and Research questions
2. Aims and Research questions
The aims of this thesis are to evaluate the accessibility to bus stops by the population of Umeå urban area, to calculate the closest road network from the neighborhoods and different kind of housing with GIS tools. Then to determine the influence of socio-economic factors on the distance accessibility to bus stops with statistical models. The research questions are the following:
• What is the maximum walking distance so that most residents can reach a bus stop?
• Are distances to bus stop the same for all neighborhoods and type of housing in Umeå city?
• Is there a relationship between access distance and the socio-economic characteristics?
4
3. Theoretical framework and previous studies
This chapter summarizes previous studies that have been done on the walking access bus stop. More studies have assessed the walking distance to rail stations. Others have made studies on bus stop access compared to other terminals. Only few have talked about access to bus stops. However, there is no difference in the accessibility on foot to bus stops and train station. The only difference that studies have shown is the bus stops are generally more accessible than train stations. Transit users walk shorter distance to access bus stop thane train station. The researchers have also evaluated the walking accessibility in relation with the socioeconomic characteristics of transit users. The method that they use can be statistical or based on geographical analysis.
So, this section will be divided into 3 parts: the accessibility, the walking distance to the bus stop and the relationship of this walking distance with socio-economic factors.
3.1. Accessibility
Accessibility is defined as the ability to reach facilities by different modes of transportation. This accessibility is depending on the geographical distance between two locations (Rodrigue, 2016, p. 361). It can be also defined as a measure of the trip time and distance between an origin and a destination by using a mode of transport (Geurs, 2004). However, the travel distance and the travel time are limited by the cost which prevent people to reach their destinations (El-Geneidy A., 2016). Other researchers define accessibility as freedom to select one or more activities (Burns & Pergamon Press, 1980). Ben-Gueurs has cited from Akiva and Lerman define the accessibility like benefits provided by transportation systems and land use (Ben-Akiva, 1985).
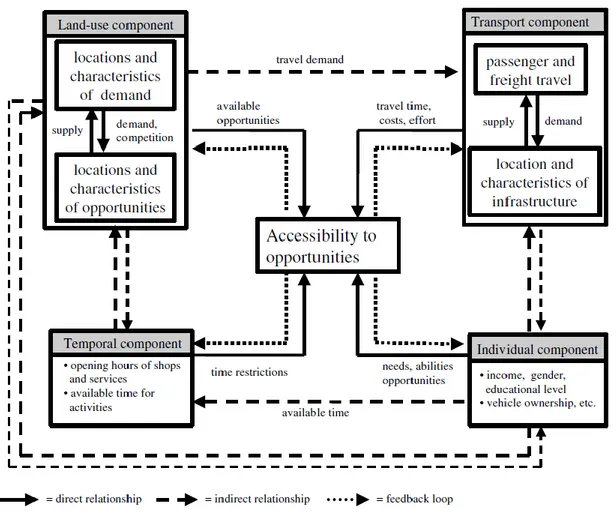
It also important to define the mobility to avoid the confusing with the accessibility. The mobility is an economic and social activity characterized by the movement of good, people and information between two locations. Mobility is the engine of the development because it creates jobs and profits (Rodrigue, 2016, p. 105). The mobility in cities is very developed with an intensified transport network which allowed the users to choose the car, the train, the bicycle or the bus to access the same service. Geurs and Van Wee (2004) have given a more detailed explanation of accessibility in general which can be measured according to 4 components which are: land use, time, transportation and individual (See fig 1).
- The land use component corresponds to the structure of the built environment which is composed of (a) the localization of supplies such as workplaces or businesses places, retails or hospitals, (b) the localization of demand such as residential areas and (c) the interaction between supply and demand involving competition between retailers for the same product and competition in the job seeking for limited vacant posts
- The transport component representing by the transport system which is the ability to go from an origin to a destination using a specific mode of transport. this
5 Theoretical framework and previous studies
component is measured according to the a) duration of the trip, b) the distance between the supply (services localization) and the demand (passenger travelling), c) the cost of transportation that can be fixed or variable and d) the effort of the modes of transport characterized by comfort and the level of security.
- The time component is characterized by the a) availability of the offer at different times of the day such as the arrival scheduling of the bus and b) the time devoted to different activities such as work, school, leisure etc.
- The individual component is represented by the socio-economic characteristics (income, age, gender, level of education, physical condition….) that can influence the level of access to modes of transportation such as by walking, cycling or driving a car.
Figure 1.The relationship between the accessibility and its components
Source: Geurs and Van Wee, 2004
In the case of the study areas, the location of the demand is characterized by the housing. The facility is the bus stop. The transport component is corresponding to the walking by foot and the individual component is the socio-economic characteristics which are income, gender and age.
3.2. Walking access to bus stop
Walking is the first mode of transportation from home to transit system (Daniels, 2013). It is also considered as an access mode. Access to the bus stop is influenced by the density of the surrounding population. Residents living in Montreal tend to travel
6 short distances because the bus stops are very close to homes. (El-Geneidy A. Grimsrud M., 2014). These researchers have shown that this short access distance is due to bus stops space. Short bus stops space increases the travel time of the transit bus because the bus registers a delay at each stop. The standard stop distance is between 200 and 600 m for the bus transit system (Ammons, 2001). Swedish planners estimate that a bird distance of 400 m to bus stops is a good standard for pedestrians (Göteborgs Stad, 2004, p. 13).
3.2.1. Walking distance access to bus stop
The walking distance traveled by users varies by region. 60% of transit users in Toronto (Canada) live within 300 meters to bus stops and 80% live within 500 meters around (Alshalalfah, 2007). In Calgary, Canada, Lam and Morrall have identified that the average distances to bus stops varies according to the streets (Lam & Morrall, 2006). This distance is between 327 and 450 meters on average. In Rouen, France, Mondou has shown that the walking distance is 500 m (Mondou, 2001). In Brisbane, Australia, transit users must walk up to 510 m on average to reach public transport (Burke, 2007). In Uppsala County, a distance to bus stop of 400-800m can be useful in urban areas (Uppsala län, 2013). When the distance to get the bus, stop is long in an area that has other modes of transport. People will tend to choose the most appropriate public transit (Zhao J., 2013). This is the case in Jinan in China where people choose minibuses because they are more accessible than buses (Jiang, 2012). In Göteborg, many living outside the city center combine the collective traffic with biking or car by the establishment of Park & Ride (pendelparkeringar) near transit stations (Göteborgs Stad, 2004, p. 15).
This subchapter is connected to the first and second research questions for assess the population rate within a distance from bus stop and to compute the average shortest distance to bus stops.
3.2.2. Walking speeds
The preferred walking speed for pedestrian is for 1,4m/s (Wikipedia, 2014). The ideal walking time to access a bus stop is estimated at 5 min in 400m (Ammons, 2001). However, this time may vary depending on the walking speeds. People who walk faster underestimate distance traveled (Hess D. B., 2012). The young and adults walk faster than children and older to access the rail station (Zhao J., 2013).
The walking speed of older adults is 1.2m / s (Coffin, 1995). In very dense urban centers, the walking speed for adult’s decreases from 0.7 to 1m / s. This is due to the pedestrian congestion and the traffic lights. This part is linked to the first question for calculate the walking time.
3.2.3. Public transit access and health
Some studies have shown that there is a relationship between walking to the bus stop and health. Walking to bus stops can be beneficial for health (Besser, L. M., & Dannenberg, A. L., 2005). They found that half of Americans do not meet General Surgeon's recommendations (≥ 30 of physical activity for adults per day). Besser and Dannenberg demonstrate that only 29% of transit riders walk for 19 minutes to and from station. This walk time corresponding to 30 minutes of physical activity. The researchers propose that the distance to public transport should be increased to allow the population to fulfill General Surgeon's recommendations.
7 Theoretical framework and previous studies
In Bogotá, a cycle track (Ciclovia) was set up to enable the population to choose another mode of transport. The research of Cervero has thus shown that people living in poor neighborhoods do not have access to this track and therefore use it only for recreational and physical activities during the weekend. This bike path is more accessible by people living in wealthy neighborhoods who use the bike as a mode of transportation to go to work (Cervero, 2009).
This subchapter is connected to the second question: Are distances to bus stop the
same for all neighborhoods and type of housing in Umeå city? This is important
because it allows to know if the city dwellers of Umeå urban area fulfill the General Surgeon's recommendations.
3.2.4. Walking distance and constraints
Jiang (2012) and Zhao (2013) show that the environmental built or topographic constraints can dissuade users of walking access to public transport. They have made three-dimensional observations of transit station location in Jinan and Nanjing (China) to determine which station have high or low-density gradients. They use both the three-dimensional maps of (EDUSHI, 2009) to identify “hill pattern (intensive
development adjacent to station), flat pattern (constant density emanating out of the station) and valley pattern (low density or vacant land adjacent to station)”
(Jiang, 2012) (Zhao J., 2013). (See fig 2)
Figure 2. The hill pattern gradient Source: (Jiang, 2012) and (Zhao J., 2013)
They have investigated and found that when the stations are in a Valley pattern, the pedestrians walk shorter distance and faster. This makes the transit station more attractive. On the other hand, when the station is on a hill, the pedestrians walk longer distance. This makes to the transit station less attractive.
Rodriguez (2004) has reported with his research on the town of Chapel hill and Carrboro (USA) that walking at a high-slope station leads to a higher energy consumption than on flat terrain. Walking on a slope of 15% grade produces energy consumption which is two times higher than walking on flat ground. He explains that the slopes that are positive in one direction are at the same time negative in another direction. He defined that the positive slope is an obstacle to walking or cycling and that the negative slope is considered as a facilitator. Null slope is a flat model (Rodrı́guez, 2004).
The number of cross routes, the ascending pass and the points of conflict are considered as constraint for transit users willing access to the rail station by foot in Singapore City (Olszewski, 2005). The quality of the pathway and sidewalks can be also a barrier to the bus stop accessibility in Mumbai in India, a survey has showed that 54% of transit users were not satisfied (Rastogi, 2003).
Some researcher considers the weather as a factor that can dissuade people to walk. For example, the winter is seen as a constraint because it reduces the walk time in
8 Calgary, Canada (Lam W. &., 1981). However, high temperature above 18 degrees discourages people for walking to station (Kuby, 2004).
This subchapter is linked to the fourth research question: Does the topography
influence access to bus stops? Hill patterns will be observed in the urban area and the
slope will be computed. This allows to know if residents living in hills have more difficulties and spend more energy than other living on flat ground in the bus stop accessibility.
3.3. Walking distance with socio-economic factors.
Several researches give results on the relation between bus stop accessibility and socio-economic factors. These characteristics for the thesis are the income, the gender and the age. This subchapter is linked with the Third research question: Is there a
relationship between access distance and the socio- economic characteristics? This
part is important because it allows to evaluate the influence of the population characteristics on the accessibility to bus stops in Umeå urban area.
3.3.1. Income
Many articles have ratified a reel relationship between the bus transit accessibility and income. Income is a factor that influences people of the willingness to walk to bus stops. Jiang has shown that low-income people are the most likely to use public transportation. They walk more than the other to get the Jinan Bus Rapid Transit. Richer people move less because they are more time with them and do not work at the same pace as the poor in Jinan. Jiang demonstrates that people who have no alternative are forced to walk longer unlike people who have multiple alternatives like the bike, the car or the mini-bus for example (Jiang, 2012). Welch in his article on equity in transport explains that many low-income household in Baltimore City are no car ownership and are dependent on public transit (Welch, 2013).
Urban households spend on transport between 8 to 16% of their income and household with lower income spend more than 25% in big cities (The World Bank, 2002). Eliasson explains also that people with high incomes live inner cities and in the north of these cities where the workplaces are located and where the housing renting are very expensive. Richer use less public transit than low-income people living in southern neighborhood of big cities (Eliasson, 2016).
The transport system is more efficient for high-income households in Stockholm but inequitable for the low-income population (Kristoffersson, 2017). These researchers explain that citizens who live in the southern neighborhoods have affordable housing in Stockholm and are likely to use several modes of transport (walk, train, buses and the subway) before they reach the workplaces. Thus, they find themselves more in situations of congestion (Automobile and pedestrian) and walk more.
The research of Rosenbloom and Clifton have shown that in the US, the use of modes of transportation depends on the population income. They explain that low-income households live inside the cities and perform short-distance to the workplace. They are depending on buses. While the richer who would live in the suburbs would travel longer
9 Theoretical framework and previous studies
by rail or metro. Poor people would walk more than the richer because they have no alternative transportation and no car ownership (Rosenbloom, S. & Clifton K., 1996). In Mumbai (Indian), Lower income household consider that buses are more expensive than auto-rickshaw/taxi even they have the same walking distance access (Rastogi, 2003).
3.3.2. Gender
Several articles have addressed the issue of gender on accessibility to public transit on foot. As a result, this gender difference is region-specific
In Scandinavian, Women use more transit transport. They walk more to bus stop because they express environment awareness than men. Hjortol has given as results of her investigations that 53% of workforce women in Oslo prefer use public transport because they are not polluting and only 36% of workforce men think alike (Hjorthol, 1998, s. 109). Hjortol also concludes that if women prefer to walk to the bus stop, men prefer more use car to job (Ibid. pp. X)1. In Jinan (China), the same situation has been
observed where women prefer to walk longer than men to access the transit transports (Jiang, 2012). However, in Nanjing, China, there is no difference between men and women in walking access to Rapid Rail Transit Stations (Zhao J., 2013). In Toronto (Canada), the difference between men and women in walking access to public transportation is low (Alshalalfah, 2007). These researchers have explained that the distance access to bus stop for women (201m) is lower than men (218 m). In Singapore, Olszewski and Wibowo demonstrate that men walk more than women for access the Mass Rapid Transit. The main factor is the distance which is for 608m (Olszewski, 2005).
3.3.3. Age
Several researches on the relationship between the distance to access the bus stop and the age have made focus on the elderly person from 65 years old and over because they consider that this group has a low walking speed and spend more time and energy to access bus stops. Research from Alshalalfah has shown that the relationship between walking access to bus stop and the population age is very weak in Toronto (Alshalalfah, 2007). Zhao has reported that nearly 94% of people walking to the bus stops are between 15 and 65 years old in Nanjing (Zhao J., 2013).
Hess has shown in his research on older people with the transit accessibility in Buffalo and Eric County that elderly people who live far from the transit station are generally not transit users because they are car owners (Hess D. B., 2012). In U.S.A, only 1.6% of older people can walk from home to the bus stop or to the train station ( (Burkhardt, 2002) cited by Hess). The most popular mode of transportation for older people is driving a car, the second mode of transport is being driven by someone and the walking to transit buses takes third place (Rosenbloom, 2001). Hess explains that older who use public transit the most live in suburban areas. It is unlikely that improved public transit or accessibility will attract older living far from transit station. The ideal distance of 400m between the residence and the bus stop is considered as too long and take many times by the elderly. Half of this distance is considered affordable for older
10 people in Florida ( (Neilson, 1972) cited by Hess, (2012)).The decreasing walking speed of older people to transit buses is better explained by the level of the physical conditions than by age (Cunningham, 1982).
11 The study area
4. The study area
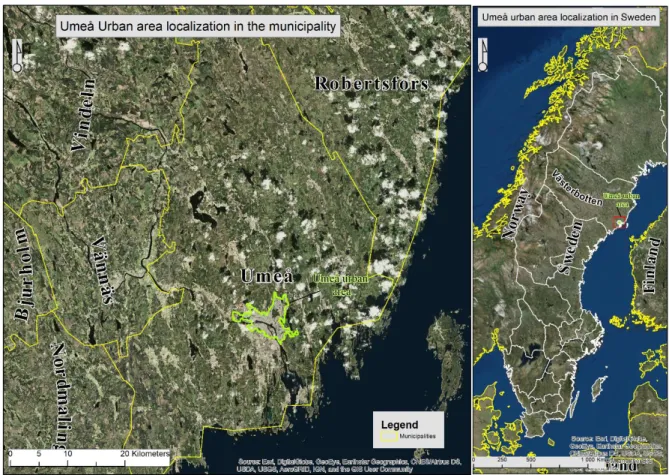
The study area is Umeå urban area. It is in the municipality of Umeå and the County of the Västerbotten (fig 3). Umeå is the biggest urban areas of the County with 32, 2km² in 2015 (Wikipedia, 2018). The population of the municipality was estimated to 125,080 inhabitants at the end of 2017 with an increasing of 2,188 new inhabitants. During this five last years, the municipality has known a strong population growth with an average of 1500 people (Umeå kommun, 2018c).
Figure 3. Umeå urban area localization in the municipality and in Sweden
Source: ArcGis 10.3, own map 4.1. Local traffic
The road network in the Umeå urban area consists of local roads which are the primary, secondary, tertiary roads. Highways with speed limits between 90 and 110 km /h are located outside the town (fig 4). In the protection of nature and the environment, the municipality of Umeå has an intensified pedestrian and cycling network that allows the population to be less dependent on cars. The length of the pedestrian and cycling network is 244 km (Umeå kommun, 2018b). 92% of the pedestrian and bike routes are separated from the car traffic and 8% are mixed. The transit transport and the bike or foot trip are the most used by resident in Umeå City.
Public bus transportation is ensured by Ultra Corporation which is a property of the County. The regional administration has no bus and no employees, but it does hire service providers. Ultra is composed of 11 main lines, a low-traffic line, five-night bus lines, five direct bus lines and a bus line from the airport (See fig 5). 30 standard buses
12 and 21 articulated buses among which 9 are powered by electricity circulate in the urban area (Wikipedia, 2018b). According to the data obtained from the Swedish Transport Administration, 165 bus stops are placed in the urban areas (See figure 4). Each year 8.5 million trips are made in the municipality. In the context of nature protection, the busses do not contain fossil fuels.
Figure 4. The traffic network overview in the urban area
Sources: ArcGis 10.3. Own map
Figure 5. The daily bus traffic map
13 Methodology
5. Methodology
This chapter is dedicated to the methods used in search of the distance access to bus stops and the socio-economic relationship by using Geographic Information Systems tools (GIS) and statistical tools.
A first method will be used to determine the distance from the bus stop in the city according to the spatial position of houses and the population geodata. The second will explain the method used to determine the shortest distance access to bus stops in the city according to the established road network. Thirdly, a statistical method will examine the relationship between the shortest distances and the socio-economic factor. Lastly, the tree-dimensional map will be used to observe the hill pattern in the urban area density and the slope will be computed.
5.1. Methodological choices
The accessibility to the bus stop in the city of Umeå can be calculated by using the Euclidean distance tool or the network service analysis. ( (Zhao, 2003) cited by Mavoa, 2012). The Euclidean distance creates circular buffer with a defined radius around the bus stop. Many researchers have found that Euclidean analysis exaggerate the distance to the bus stop because the analyst create buffers with fixed radius around the transit station ( (El-Geneidy, 2010) cited by Mavoa, 2012). The Euclidean analysis does not consider the road network and the pedestrian prohibition of land use such as rivers, lakes, railways and highway etc. The service areas method differently to the Euclidean distance is more efficient. It is built based on the transportation modelling. The service areas show all roads which are accessible within a network trip time or distance. It is considered as more realistic and easily understandable. It gives more detailed information than the Euclidean buffer which is considered as a traditional method (Langford, 2012).
To estimate the nearest distance between homes and bus stops, researchers suggest using the closest facility based on the road network and the straight-line distance (Euclidean distance). The Euclidean distance is the straight line between the origin and the destination but does not take account the network ( (Liu, 2004) and (Levinson, 2009)) (Fig 6a). The closest facility is more realistic. The distance is measured by considering the transportation modelling (Fig 6b) and it give the information about the direction of the trip travel is toward or away, and other restrictions like cutoff thresholds.
14 Figure 6. Difference between the Euclidean (a) and the network distance (b)
Source: (Levinson, 2009)
The multiple ordinary least square regression analysis is chosen for computing the relationship between the walking distance cost from bus stops and the socio-economic data. This tool is preferable because it can be used in many settings and in many kinds of models. The advantage with this model is it can treat both numerical and dummy variables. It is easy to use the regression model and it is understandable to a wide audience (Zhao J., 2013).
The three-dimensional observation will be used to analysis the topographic constraint on the bus transit accessibility according to Jiang (2012) and Zhao (2013).
5.2. Geographical information system (GIS)
The GIS is an extension of the digital cartography. It is composed a set of tools that can be used for analyzing and visualizing data on a map. The GIS application areas are wide. GIS can be applied in environmental studies, in crime analysis, in the retail location analysis, in health care planning, Emergency planning, education planning etc... (Clarke, 2017, p. 6)
The GIS tool used for the bus stop accessibility analysis in Umeå City is the multimodal network analysis. This method was used by many researchers for analyze the services area around the transit station and for analysis the nearest distance to transit transport including all available roads in a given region ( (El-Geneidy A. Grimsrud M., 2014); (Jiang, 2012), Hess, (Hess D. B., 2012), (O'Sullivan, 2000), etc.)
In Umea Urban area context, this method is important because the walking is the modes of transport. Thanks to this network dataset, a service area will be created around bus stops to determine the distance that residents will walk in all the City. This network also will allow to calculate the shortest network distance between residences and bus stops by using the closest facility tool.
15 Methodology
5.3. Data
The data for the analysis were downloaded from three websites: Swedish Transport Administration, Geodata Extraction Tool and OpenStreetMap. The table 1 presents the different files used for the analysis.
Table 1. The files used for the analyze and their provenance
FILE WEBSITE
road data Swedish transport administration
Bus stop Swedish transport administration
urban area Geodata extraction tool
Population data Geodata extraction tool
Income Geodata extraction tool
buildings Geodata extraction tool
Land use Geodata extraction tool
Digital elevation model (Höjddata
2m) Geodata extraction tool
Water bodies Geodata extraction tool
Municipalities OpenStreetMap
Road network for 3D observation OpenStreetMap
Source: Own table
The population and income data in Umeå urban areas are represented as squares of 250 m² (Fig 7). We will analyze the population age, the gender and the population income status for the year 2014. The histogram shows that 30% of squares contain less than 100 people. Squares that contain 500 people do not reach 5%. The squares that have 900 inhabitants are very few with 1%.
The figure 8 indicates that Ålidhem Västra and the Berghem Sydväst neighborhood are the most populated in the urban area with an average of respectively 673 and 488 people by 250 m². The other neighborhood located around the south of centrum, Carlshem Tomtebo, Mariehem and Ersboda are also populated with an average between 230 to 428 inhabitants.
The figure 9 shows that Ålidhem Västra which is the most populated is the poorest neighborhood of the urban areas with an annual average income of 139930.75 SEK. Böle is the neighborhood which have the higher income with an annual average income of 7 004 843 SEK. The maximum income (Medelinkomst) in 2014 of Umeå population is for 20 550 711 SEK and the mean income is for 272 751 SEK (Descriptive statistic).
16
Figure 7. The population percentage in the urban area (by 250 meter square)
Source: Stata, own graph
Figure 8. The average population distribution in the urban area
17 Methodology
Figure 9. The average income distribution
Source: ArcGis 10.3, own map
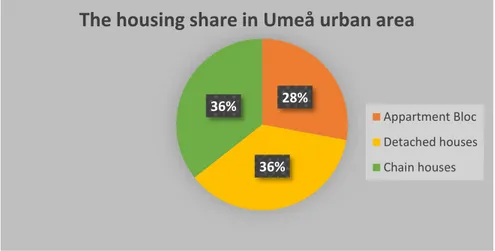
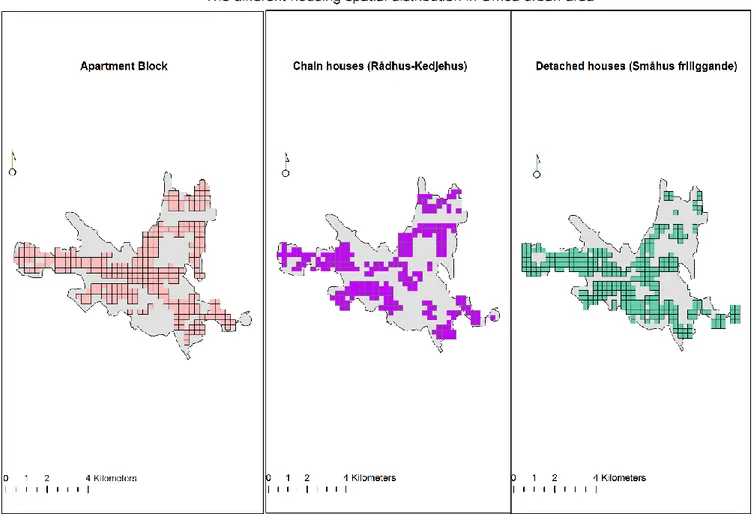
For the building data, only the chain houses, detached house and apartments blocs are considered for the analysis. Workplace, retails, factories and other facilities are excluded from the study. Figure 10 represented the share of the housing in the urban area. Apartment blocks have the lowest share compared to chain and detached houses which have equal sharing in the municipality. The fig 11 showed the squares where different housing are localized. The apartment blocks and detached houses occupied more squares than the chain houses.
Figure 10. The different housing shares in the municipality.
Source: Excel 2016,own graph
28%
36% 36%
The housing share in Umeå urban area
Appartment Bloc Detached houses Chain houses
18 Figure 11. The different housing distribution
Source: ArcGis 10.3, own map
The road and bus data of the Swedish Transport Administration (Trafikverket) have been downloaded from a service called "Laskajen". The attribute table of the road file contains all available information we need for the analysis like for example the roads class, name, category and type, the speed limit, the direction, the bus lane, the bridge, tunnel data, restrictions etc. It is important to manage the data according to the interest of the study by creating news field with aliases and attribute domain in the road feature class. The table 3 represents the new aliases created in the road attribute table.
Table 2: The road structuration
ROAD CLASS NAME ROAD CLASS RANK
Highway and expressway 0 to3 important road
Primary road 4
Secondary road 5
Tertiary road/Bikeway and
pedestrian 6 to 8
19 Methodology
ROAD TYPE PYTHON EXPRESSION IN SELECT BY
ATTRIBUTE FIELD
Road network Road type = 1
Bikeway and Pedestrian network Road type = 2 or Road type= 3
CAR RESTRICTION PYTHON EXPRESSION IN SELECT BY
ATTRIBUTE FIELD
Allowed Road type =Road network
Avoid Road type = Bikeway and pedestrian network
ROAD CATEGORY (See fig 3) PYTHON EXPRESSION IN SELECT BY
ATTRIBUTE FIELD
Tunnel and bridge Tunnel = T, Bridge =T (they were regrouped in the
same field)
Highway Highway = Speed limit ≥ 90 km/h
Local road Speed limit < 90km/h and Speed limit ≥ 5km/h
Pedestrian (Bikeway/Walkway) Road type = Bikeway and pedestrian network
Source: Trafikverket,own table 5.4. Integrate tool
The integrate tool (ArcGis pro, 2018) is used to clean and to link the road file and the bus stop by specifying an x,y tolerance. The advantage with this tool is that it creates connectivity between the road network and the bus stop. The disadvantage is that it may change the geometry of the road feature class and it does not connect all buses to the road. It is therefore important to snap the bus stop to the closest road that can allow the connectivity between entities (El-Geneidy A. Grimsrud M., 2014). Another disadvantage is that when dealing with big data, it is difficult to quickly detect entities that are not connected because the integrate tool does not provide an output feature class. In the case of the road network connectivity with bus stop in Umeå urban area, a x,y tolerance of 2 meters was applied.
5.5. Multimodal network dataset
The multimodal network dataset is used to model transportation scenarios where the passengers can use multiple mode of transportation in a single trip (ArcGis, 2018). It is important because it measures the accessibility in a system of nodes and edges. It analyzes the form and the structure of the transport network and it study the change in time and distance. The nodes represent the access point or intermediary location within a transport network. The nodes correspond to terminals like for example the bus stops or the rails stations. The edges represented the transport infrastructure flows or the link between two nodes and they abstraction to route like roads, rail link, bike way and walkway (Rodrigue, 2016, p. 345).
In the case of the study area, the bus stop and the roads feature class have been imported in the network dataset in ArcCatalog. In the connectivity field of the network dataset, only one connectivity group is defined where the road subtypes (Tunnels, Bridge, Highway, local roads and Bikeway/Walkway) and the bus stops are linked together. In the evaluation policy, the walk distance and the walk time have been defined. The walk distance cost describes the length of the road network and the unit
20 is in meter. The walk time cost is defined by considering that the pedestrian can walk 5km/h. The expression for the walk distance and the walk time are in Table 3.
The road class and the road type were also represented in the evaluation policy as descriptor. The travel mode and the route direction were not configured because only the walking distance will be used for the analysis. The travel mode is often used when the analyst will perform many modes of transportation with restriction. For example, if the car driving is defined as the travel mode, the restriction will be that the automobiles do not drive on the pedestrian way. The network is built when the configuration is finished.
Table 3.The walk distance and walk time expression
WALK DISTANCE COST= LENGHT (Meter)
WALK TIME COST (Minute) = LENGTH (Meter) * 60/5000
5.6. Service Areas
The service area is a tool of the network dataset which defines the accessible roads within a certain travel time or travel distance. The analysis is related with the network dataset and shows all the streets involved within different break times around the facilities. The service area is also defined as isochrones-based analysis with line of
equal travel time (O'Sullivan, 2000). Many researchers have used the service areas
analysis for the accessibility to transit transport and the relationship with the socio-economical characteristic. For example, Alshalalfah indicated that 60% of transit user in Toronto live within service area of 300 m around the transit station and 80% live within a service area of 800 m (Alshalalfah, 2007). 94,4% of the population in Scotland live within 40 min from transit transport via walking (Mavoa, 2012).
It is important to explain that many researchers have done surveys on a defined number of transit users ( (Zhu, 2017); (Zhao, 2003); (El-Geneidy A. Grimsrud M., 2014); (Jiang, 2012); (Hess D. B., 2012); (O'Sullivan, 2000)). They ask transit users how far they go to get to the bus stop, their income, age and other information. This allowed them to set up a service area around the stations without considering the entire population of the regions to be studied. In the case of the research on Umeå City, the service areas will consider the spatial distribution of the population and housing to know the maximum distance of access to bus stops by city dwellers.
5.7. Shortest network distance to bus stop
The shortest distance to bus stops from residences and the population spatial distribution will be calculate with the Closest Facility Tool from the network toolbar bar. The closest facility is defined as the shortest and the best route between the origin and the destination (Liu, 2004). It computes travel distance cost and indicate which direction could take the pedestrian to access his destination. The closest facility tool allows also the analyst to define a constraint of time or distance to access the facility. Liu explained that the origin and the destination should be found on the transportation network, but homes and parks are not situated on the route network. He explained that in these cases the shortest distance tool could not compute directly the distance
21 Methodology
between the origin (home, park) and the destination. Liu proposes to calculate “the
nearest point on the road network to the origin for travel by car or by foot, or the nearest transit stop on the transit network to the origin for travel by bus or train”.
In the case of the study areas, the nearest route between the bus stop to the neighborhoods (population data in square) and the housing spatial distribution will be measured. For using the method of Liu, the polygons representing population and houses data have been converted into point files. Then theses point will be selected as origin and the bus stops as destination.
5.8. Summarize statistic
Summarize statistic or descriptive tool is used to summarize and to provide information of a set of observations. The descriptive statistic is used to compare the statistical value of different mode of transportation like for example the mean walking distance to bus stop is relatively shorter than the walking distance to rail station ( (El-Geneidy A. Grimsrud M., 2014); (Rastogi, 2003)).
In the case of the transit accessibility to bus stop in Umeå urban area, the shortest network distance from housing and population to bus stop will be summarized to know the values of the mean.
5.9. The ordinary least square regression analysis
The multiple ordinary least square regression analysis is chosen for computing the linear relationship between two variables. This model was used by many researchers to analyses the influence of the socio-economic and environmental factor on the walking accessibility to transit transport ( (El-Geneidy A. Grimsrud M., 2014); (Jiang, 2012); (Zhao J., 2013)). They have done a multiple regression where they compute the relationship between the distances and other factors.
The multiple regression expression using 2 independents variables is the following Y= α+β₁x₁+ β₂x₂+ε
Where x₁ and x₂ are the independent variables, Y is the dependent variable, α is the intercept, β₁ and β₂ are the slopes and ε is the error term.
The multiple regression will be used to compute: firstly, the relationship between the nearest walking distance to bus stop (Dependent variable) and the population data located in different neighborhoods of Umeå city. Secondly, the relationship between the nearest networks distance to bus stop and different type of houses. The distance to bus stop is chosen as the dependent variable and the socio-economic characteristics are chosen as explanatory variable (table 4).
Table 4: The explanatory variables for the regression analysis SOCIO-ECONOMIC
CHARACTERISTICS EXPLANATORY VARIABLES
Individual income Share Low income
Share High income
Gender Share Men
22
Age Share Children (Under 15-year-old)
Share Workforce (From 16 to 64) Share Older (65 years and over)
Housing Apartments (Dummy variable)
Chain houses (Dummy variable) Detached houses (Dummy variable)
Source: Geodata Extraction Tool, own table
5.10. Topographic constraint observation and the slope calculation
As have done Jiang (2012) and Zhao (2013) which used the three-dimensional map of (EDUSHI, 2009) to determinate the station gradient, In the case of Umeå urban area the three-dimensional GIS application ArcScene has been used. The urban area elevation, the housing, the road network and the bus stop files have been added in the map document.
The slope is computing by converting the elevation data into degree. The degree is the slope inclination.
5.11. Ethical considerations
The data from Geodata Extraction are not accessible to the public but all students of Swedish universities can access to these data in order to make analysis. These geocoded data are reliable because they have been published by government structures such as Sweden's agricultural university (SLU), Lantmäteriet (Land Survey), Maritime Administration (Sjöfartsverket), Sweden's geological survey (SGU) and Statistics Sweden (SCB). However, data on population characteristics and incomes are not recent because they are dated to 2014. The most recent data (from 2016 to now) are not available because it requires an order with purchase. For the population data (age, gender), 443 observations have been counted and for the individual income 452 observation have been enumerated. The route data collected from the data of the Swedish Transport Authority (Trafikverket) are free and accessible to the public. People wishing to access these data must be first register. The data of Open street map are available at all public without obligation. However the data are frequently updated. All collected data are constant and can be reused by anyone in order to get the same result.
This thesis focuses on walking access to bus stop in Umeå urban area and the rela- tionship with socio-economic characteristics. The research questions are established based on previous researches dealing the same subject. The results are obtained with the help of network dataset analysis (service area and closest facilities tools) and the Ordinary Least Square regression analysis. It is important to consider that obtained maps may be considered sensitives because its shows the most populous or the richer neighborhoods. However collected data are anonymous and do not contain any personal information such as addresses and names.
This study is used for improving the access to bus stop in Umeå urban area by showing which residences have less access to bus stops with a proposal extension of the bus network in these districs.
23 The result analysis
6. The result analysis
This chapter presents the results obtained with the tools of the geographic information system by maps (service areas and closest facilities). Their interpretation has been done through graphs and regressions analyzes (Ordinary least square). Results is presented according to the research questions posed in the aim.
5.1. Research question 1: The maximum walking distance so that most residents can reach the bus stop.
The figure 12 shows a service area with a network distance of 1600 m around the bus stop can covered all residences in Umeå City. A service area of 400m which corresponding to the ideal pedestrian walking distance to reach the bus stop shows an overlapping of polygons (Fig.13). This indicates that the space between the bus stops is short (less than 400m). There is redundancy which means that a neighborhood is supplied by multiple bus stops on the same road network . It means also that the population can access several bus stops in a short distance (Less 400m). The disadvantage is that transit times will be longer.
As did many researchers such as (Alshalalfah, 2007) and (Mavoa, 2012), the share of the population in relation to the walking distance to the bus stops was evaluated (Table 5). The results show that 94.5% of the population and 61.7% of the houses are located around 400 meters from all bus stops. Almost all the population of the city lives at 800 meters from the bus stop with a share of 99.4% of inhabitants and 96.4% of houses. Table 5. The population and housing share within a distance to bus stops in Umeå urban areas
Distance to bus stop
(Meter) population Total population (%) Percentage houses Total Percentage houses (%)
400 79118 94,5 8230 61,7
800 83 023 99,2 12856 96,4
1000 83 218 99,4 13052 97,9
1600 83 691 100 13329 100
24 Figure 12. The bus stop accessibility within 1600 m covering the urban areas
Source: ArcGis 10.3, own map
Figure 13. The bus stop accessibility within the ideal walking distance (400m)
25 The result analysis
The figures 12 and 14 have shown that residents living on Ön (Island) and in the south-west of the urban area (Tavleliden) have more difficult access to bus stops. These population must walk between 800 and 1600m. This long walking distance is due to the absence public transport network and bus stops in the island. The presence of the river is also a barrier for the accessibility which forces the inhabitants of Ön to use the bridges. The location of bridges connecting the island with the city can also be a factor that increases the walking distance to the bus stops. The houses closest to the bridges are more favored than those located further away.
The difficulty of getting to bus stops from homes in Tavleliden is because there is only one bus stop in Källplatsen (see fig 5). This bus stop is the terminus of line 8.
Figure 14. The bus stop accessibility from houses
Source: ArcGis 10.3, own map
For the analysis of the socio-economic factors in the services areas, 10 bus stops (Figure 15) in different districts of the City were chosen in order to analyze the population characteristics variations. The service areas from 0 to 400m then from 400 to 800m around the bus stops were selected because they contain the largest part of the population
26
Figure 15. The selected bus stop for the population analysis
Source: ArcGis 10.3, own map
6.1.1. Income
The graphs show that low-income people do not dominate in all services areas around bus stop in the urban area (See appendix 1)
From 0 to 400m : The bus stop of Ålidhem centrum has within a service area of 400m, the higher share of residents with lower income (98%). Bus stops at Östra Ersboda Centrum and Marieberg show that low-income residents are at 80%. Shell Teg and Paradisgränd have more than 60% of the population with low incomes.
The bus stops where high-income populations dominate with more than 50% are Vasaplan, Berghemsvägen, Riksvägen and Hartvigsgatan. The latter is the bus stop that has the most residents with high incomes with 68%.
From 400 to 800m: a change occurs where the share of high income population increases to 13% at Ålidhem Centrum bus stop. Vasaplan bus station which has reported a dominance of higher income resident between 0 to 400m has now a predominance of lower incomes with more that 50%. Shell Teg bus stop indicated that the share of higher income become superior. Riksvägen has equal share of lower and higher income residents. Källplatsen and Hartvigsgatan have almost the same share of high income population with 63%.
6.1.2. Gender
The graphs show that in general the shares of men and women are equal in the service areas around bus stops (See appendix 2).
From 0 to 400m: the graph shows that there is little variation between men and women. The bus stops where men dominate slightly are: Ålidhem Centrum, Riksvägen and Källplatsen. Bus stops where women dominate slightly are Östra Ersboda Centrum, Vasaplan, Marieberg, Berghemsvägen and Shell Teg. Hartvigsgatan and Paradisgränd bus stop have equal shares of men and women.
27 The result analysis
From 400 to 800m: the graph also shows that the difference between men's and women's share is still small, but it occurs a change. Men dominate in services areas of Ålidhem, Marieberg and Berghemsvägen bus stops. The bus stops service areas that have a similar gender share between 0 and 400 do not change at 800m with an addition of Östra Ersboda Centrum bus stop. Women dominate at Vasaplan, Riksvägen, Shell Teg and Källplatsen.
6.1.3. Age
The graphs indicated a dominance of the working age people within 800m from bus stop (Appendix 3).
From 0 to 400m:Ålidhem Centrum is the bus stop that has the highest share with 95%. Old people are almost non-existent in this sector and children are very poorly represented (5%). The bus stops where the services areas show a larger share of older people are Vasaplan (26%) and Shell Teg (43%). Shell Teg is the only service areas where the worforce does not exceed 50%. Children are better represented around Östra Ersboda centrum (24%), Paradisgränd (22%) and Källplatsen (29%).
From 400 to 800m: Ålidhem Centrum has still the service area with the highest share of working age people but it decrease because the elderly appear with a share of 6% and Children rise to 9%. Shell Teg and Vasaplan service areas have more elderly person by comparing with the other bus stops but they decrease with respectively 24% and 26%. The share of children is reduced in Ö. Ersboda Centrum service area (12%) but Paradisgränd (30%) and Källplatsen (31%) have seen an increasing of children.
6.2. Research question 2: Are the closest distance to bus stop is the same for all neighborhoods and houses in Umeå city?
According to (Liu, 2004) method: “the nearest point on the road network to the origin
for travel by car or by foot “, the shortest distance was calculated for houses and for
population square. The shortest network distance is not the same for all houses in the urban area. The shortest facility tool of the network dataset computes only the distance from the house which is the closest to the bus stop and not to any houses (Fig 16). The yellow lines which represent the shortest routes are not the same in Sofiehem and in the downtown.
The summary statistic of all shortest distance (table 6) reports that the mean distance is for 186 meters, the minimum distance is for 0, 4 m and the maximum is for 2, 2 km. For the population spatial data, the mean distance is for 221 meters and the minimal is for 7, 3 meters.
The histograms in figure 17 shows that 75% of shortest routes from housing to bus stop are less than 200 m. It is the same for the population where 35% of distance are less than 200m. The housing and the population that have long “Shortest distance” to the bus stop are few. Umeå’s urban area residents have a good access to bus stops.
28 Table 6. The summary statistic of the shortest distance network to bus stop
Variable mean Standard
deviation Min Max
Shortest distance network from houses
to bus stop (meter) 186 319 0,47 2209
Shortest distance network from Population data (Square) to bus stop
(meter)
221,7 192,5 7,3 1000
Source:Stata, own table
Figure 16. The shortest network distance from housing to bus stop in Sofiehem and Umeå City center
29 The result analysis
Figure 17. The shortest network distance share from the housing and population to bus
Source: Stata, own graphs
6.3. Research question 3: Is there relationship between access distance and the socio- economic characteristics?
This part displays the result of the multiple regression model by calculating the relationship between firstly the shortest distance to bus and the individual component of the population (Income – gender- Age) and secondly the shortest distance to bus stop and the different type of houses (Apartment, chain houses and detached houses)
6.3.1. Income
The OLS reports that the coefficient of high and low income is negative (Table 7). This means that if the incomes increase, the walking distance to bus stop decreases. The coefficient of higher income population (- 2.86m) is greater than the coefficient of lower income (-3.40 m). This means that bus stops accessibility reduces more for people with lower incomes. However, the difference in accessibility between the poor and the rich is very small because it does not exceed 1 meter (3.40-2.86 = 0.54m). The higher incomes are not statistically significant because their p-value is greater than 0.05 alpha level and the null hypothesis is accepted. However, the lower income are significant because the p-value (0.016) is lower than the 0.05 alpha level and it reject the null hypothesis.
Table 7. The OLS regression between the shortest distances to bus stop and the individual incomes
Shortest walking distance to bus stop
(Population) Coef. P>t
Share High income -2.86 0.057
Share Low income -3.399 0.016
Cons 370.01 0.000
Source:Stata, own table
6.3.2. Gender
In this case because of the share of men and women is equal in the services areas, only one variable (men) is chosen for the regression analysis to avoid multicolli-neaity problem in the regression model. Multicollinearity occurs when two
inde-30 pendent variables (x₁ and x₂) have the same impact on the dependent variable Y. This means that it is difficult to differentiate who between men and women have the most impact. Before the process, the squares (or population data) with less than 10 persons have been excluded from the analysis. It was also the same for areas where the share of men or women are equal to 100% or 0%.
The OLS regression reports that men have a negative coefficient (-1.07). This means that if the share of men increases, the shortest distance to bus stop decrease. The total population with a coefficient of -0.03 is closer to the bus stops but the difference with the men is very low.
The share of men is not statistically significant because the p-value is equal to 0.72 and is greater to the 0.05 alpha level. The null hypothesis is accepted. It is the same for the total population with a p-value of 0.6.
Table 8. The OLS regression between the shortest distances to bus stop and gender Shortest walking distance to bus stop
(Population) Coef. P>t
Share Men -1.18 0.72
Total population -0.03 0.60
Cons 286.65 0.06
Source:Stata, own table
6.3.3. Age
This multiple regression considers the influence of the working age and older people. The children share is excluded to the analysis because it occurs multicollinearity with elderly share. The coefficient of the workforce (-0.84) and older (-0.19) are negative, this means that the distance to bus stop reduce when they raise. However, the difference between these two groups is weak and equal to 0,65m (0.84-0.19). Older and the workforce are not statistically significant because their p-values are larger than the 0.05 alpha level. So, they accept the null hypothesis. However, the Cons of the model is statistically significant.
Table 9. The OLS regression between the shortest distances to bus stop and population age Shortest walking distance to bus stop
(Population) Coef. P>t
Share Older Age (≥ 65) -0,19 0,53
Share Workforce Age (16 - 64) -0.84 0,66
Total population (Number) -0.02 -0.75
Cons 319.29 0.03
Source:Stata, own table
6.3.4. The housing
The OLS regression reports that the Apartments and detached houses have the same influence on the shortest distance to bus stops (Table 10). They have a coefficient of 3.52m. However, there is a great difference between chain houses and the other. The coefficient is for 182,52m. So, a gap of 179 meters.
31 The result analysis
Apartments and detached houses are not statistically significant because the p-value (0.96) is higher than the 0.05 alpha level and the null hypothesis is accepted. Chain houses are statistically significant because the p-values (0,007) is lower than 0.05. Table 10. The OLS regression between the shortest distances to bus stop and housing
Shortest walking distance to bus stop
(Housing) Coef. P>t
Apartments Referenced
Detached houses 3,52 0,96
Chain houses 182,52 0,007
Cons 117.86 0.026
32
6.4. Research question 4: Is the topography influences access to bus stops?
Figures 18 shows that Umeå urban area’s topography is not flat because of hill patterns in Berghem and Marieberg neighborhoods. The bus lane shows a convex shape indicating that it is a climb. The observation of the slope indicates that the residents must walk an inclination between 0 and 10 degrees which corresponds to a grade between 0 and 17.63%. Thus, Berghem and Marieberg population consume more energy to reach the bus stop than the other residents of the urban area. Berghem Hill contains 4 bus stops with gaps of less than 400m. This makes the accessibility more advantageous and bus stops more attractive. On the other hand, Marieberg hill has only one bus stop. The nearest bus stops are at the bottom of the hill with distances of more than 400m. This makes its accessibility more difficult for transit users. This setting makes the bus stop less attractive.
Figure 18. The hill pattern observation in Berghem and Marieberg neighborhoods
Source:Arcscene, own table