Hannah Guthrie Senior Thesis May 4th, 2020
Introduction
Success of a dance production lies in a dancer’s ability to be otherworldly, show complicated physical movement effortlessly, and to take the audience on a journey. Beyond the physical requirements and demands of dance, other factors of a performance environment can help or hinder a dancer’s ability to perform at their physical best. The success of movement in the dance vocabulary; turning, jumping, and even simple balance actions can be susceptible to the introduction of theatrical elements not utilized in the dance studio space. Brighter, more drastic lighting can affect visibility, forcing the dancer to rely on their instinctual muscle habits and proprioception for success.
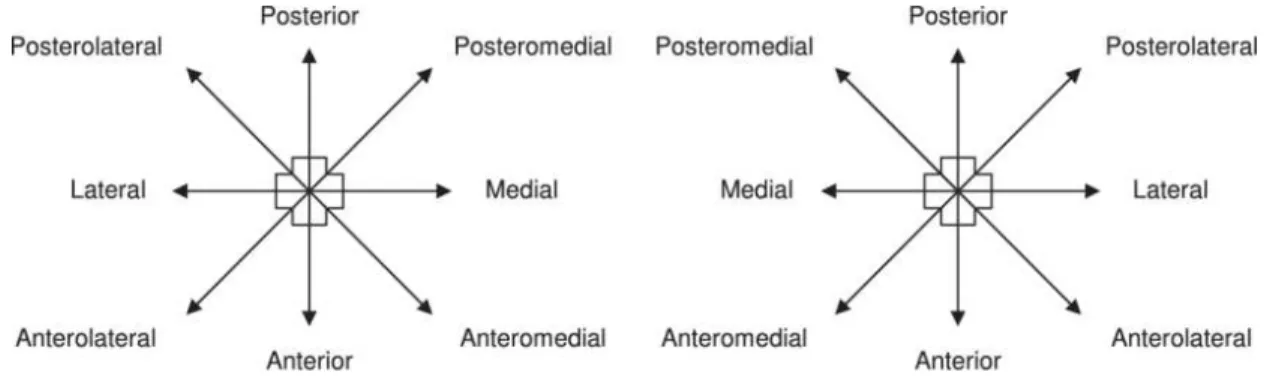
In Fall 2019, Dr. Margaret Wilson, head of the University of Wyoming Theatre and Dance Department, collected balance data on cast members of the fall production to explore balance under different conditions in the studio and theatre. The dancers each went through an exercise series known as the Star Excursion Balance Test (SEBT) on a force plate, a tool that measures how far an individual’s balance sways away from their center. In a study conducted by Doctor Philip Gribble, looking at the implementation of the SEBT, it was found that : “The Star Excursion Balance Test is a reliable measure and a valid dynamic test to predict risk of lower extremity injury and to identify dynamic balance deficits in patients with lower extremity conditions” (Gribble, 2012). In the Star Excursion Balance Test, the participant stands on a one leg, and reaches out the opposite leg in eight directions, shown in Figure 1. The dancers performed the SEBT in ambient/typical studio lighting, as well as under theatre/stage lighting.
Figure 1. Pathways of the Star Excursion Balance Test
An individual’s goal is to be able to reach as far as possible in the eight directions of the test, while the goals of the SEBT is to identify individuals who may be at risk for a lower extremity injury (most commonly the ankle, foot, or knee) through decreased range, and to assess symmetry of the body. The force-plate measures balance instability as sway, and the data collected by Dr. Wilson couples the notion that a dancer with a high reported measurement for sway and decreased range of reach in the SEBT is at risk for injury.
Population
The seven dancers who participated in the exploratory study are all students in the University of Wyoming’s Dance Program, and were cast members in the Fall 2019 production, “Wonderland: Alice’s Adventures in 3-Dimensional Space”. At the start of the study, none of the participants reported an existing injury.
In classical statistics, a sample of this size (7) isn’t considered substantial enough to assume normality for analysis. However, Bootstrapping, is an analysis tool that circumvents the issue of small sample size, and thus was used to continue analysis for this data set.
The bootstrapping method simulates repeating a study a large number of times, thus generating an estimate of the distribution of the statistic in consideration. This estimation allows for a bootstrap confidence interval to be constructed. For the data collected by Dr. Wilson, the bootstrapping method was utilized to estimate the average sway in the medial-lateral, and anterior-posterior directions from the SEBT.
Relevance for Analysis
In a pooled meta-analysis from 19 studies concerning the musculoskeletal injury prevalence in ballet dancers, it was found that “In a total of 7332 injuries reported in 2617 ballet dancers, the period prevalence of musculoskeletal injury was 280% (95% CI: (217%, 343%))”, and that the most common reported musculoskeletal injury conditions were: “hamstring strain, tendinopathy of muscles contributing to ankle motion, and generalized low back pain” (Smith, 2016). Furthermore, it’s imperative for dancers to perform in a space as safe as possible, given the existing susceptibility to injury. It’s important to both address the position or intensity of the theatre lighting appropriately, and to establish proprioceptive habits in dance training that attempts to make the transition in awareness of balance in a theatre setting as equitable as possible to the studio setting. In a pilot study conducted by Hutt and Redding that also utilized the SEBT, it was found that “Visual conditions for a dancer vary greatly between theatrical performance environments and dance studios, and this variability may be detrimental to their dynamic balance performance, particularly under stage lighting. In order to maintain balance control, dancers reportedly rely heavily on visual input, yet those who rely more on proprioceptive strategies for balancing have been found to be more stable” (Hutt, 2014).
Given the high physical demands of dance, and conclusions from studies like the former, it’s imperative that statistical analysis be a tool for examining the high proportion of dancers that incur injuries, and that any indication of weakness or insufficient ability should be addressed and analyzed to be avoid future injury. A dancer’s ability to balance is integral to every aspect of movement they perform, and if a dancer either shows abnormal sway, or is consistently swaying largely, the dancer’s training should be adjusted in order to avoid injury. Statistics for dance related data is incredibly helpful in determining and limiting these injury risk factors, and at the very least, encourages exploration of why dance activity data needs to be collected, monitored, and analyzed to support the health of the dance community.
Question of Interest
Does theatre lighting affect the sway of a dancer differently than ambient lighting? Hypotheses
From studies discussed previously reflecting on the lack of visual aid, and the increased demand for proprioceptive awareness for stability in typical theatre performance environments, it is hypothesized that the average sway under theatre lighting will be greater than the average sway under ambient lighting.
The consideration of incremental versus relative change is important for this scenario. A dancer who is typically more stable will consistently record lower measurements for sway, while a dancer who is more “wobbly” will typically consistently record higher measurements for sway. For the explorative purposes of this analysis, both incremental change and relative change conclusions are provided.
Data Collection
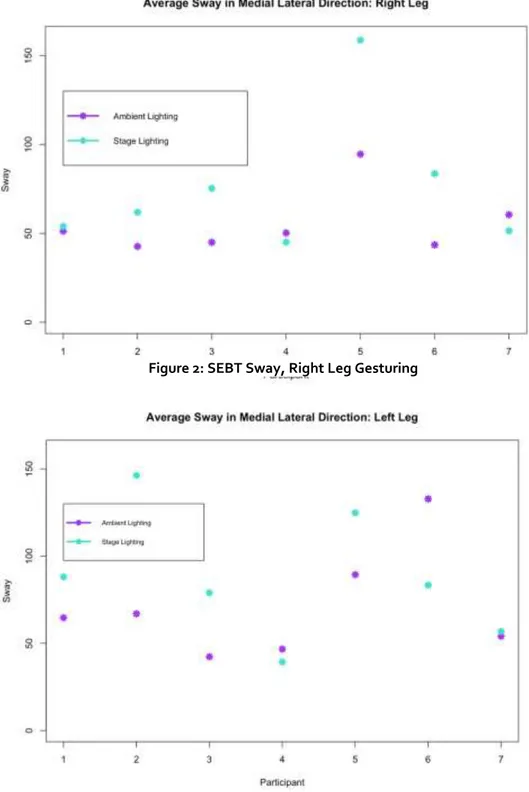
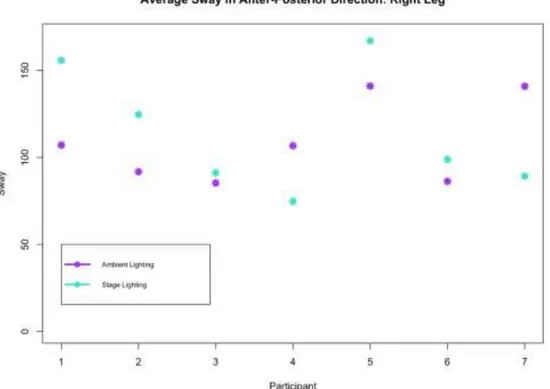
Dancers completed the SEBT for each leg under theatre and ambient lighting on two separate occasions during the Fall 2019 production “Alice's Adventures in 3-Dimensional Space”. Participant four completed their second visit in a boot, due to possible a stress reaction on their left foot. The measurements recorded by the force-plate were compiled into an Excel spreadsheet. The average of these two recorded measurements for each participant are shown in the plots depicted in Figures 2-5. Plots stating “right leg” indicate that the right leg was gesturing, and plots stating “left leg” indicate that the left leg was gesturing, in the SEBT.
Figure 3: SEBT Sway, Left Leg Gesturing Figure 2: SEBT Sway, Right Leg Gesturing
Figure 4: SEBT Sway, Right Leg Gesturing
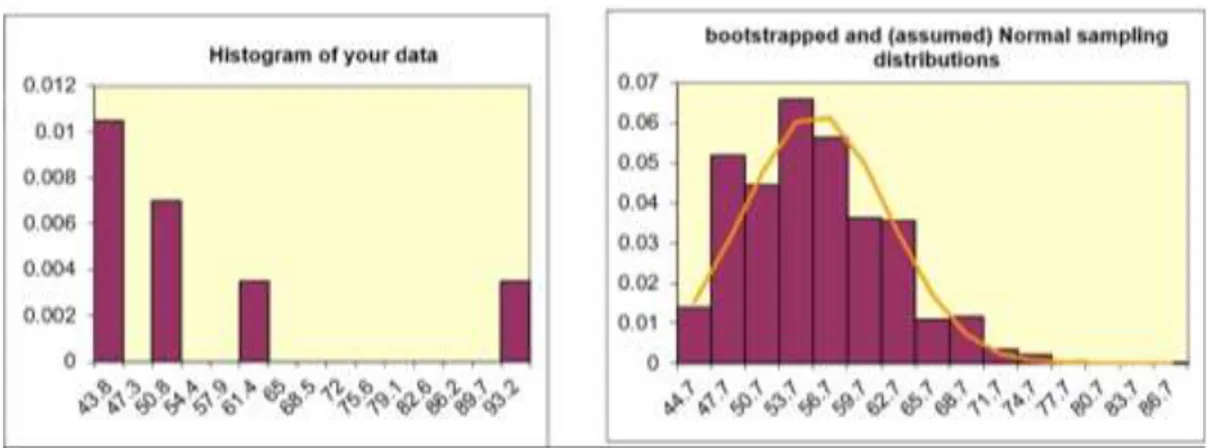
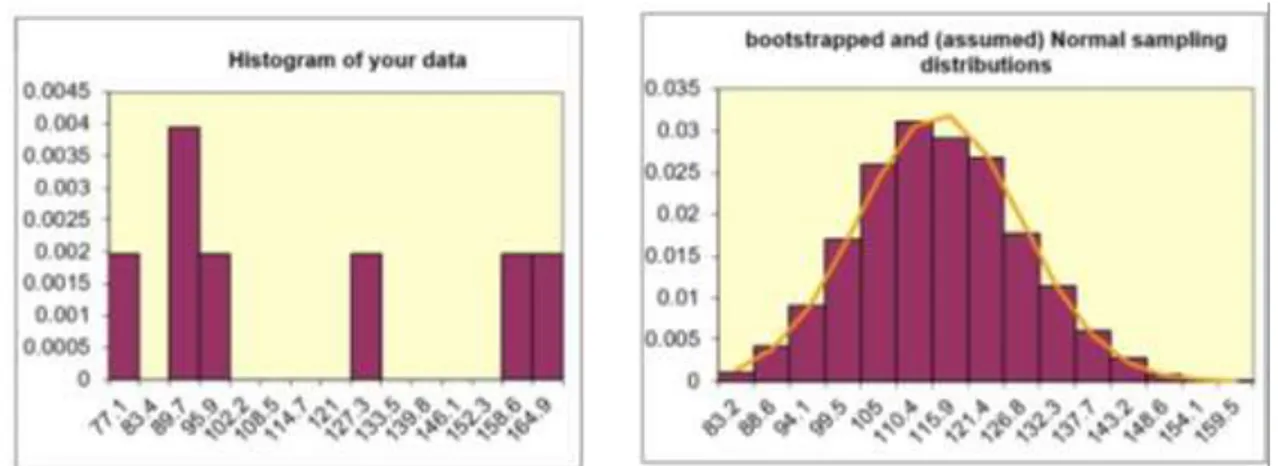
The recorded measurements for each participant shown in Figures 2-5 were then analyzed using a bootstrapping tool. Figure 6 shows a histogram of the averages from each participant, as well as the bootstrapped distribution of the average sway in the medial-lateral direction with the right leg gesturing, in ambient lighting.
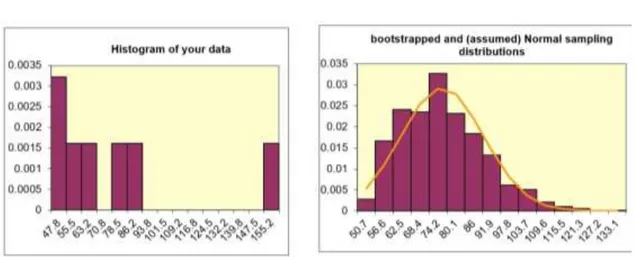
Figure 6: Histogram, Bootstrapped Distribution of Medial-Lateral Average Sway with Right Leg Gesturing, Ambient Lighting
The histogram for the average sway in the medial-lateral direction with the right leg gesturing in ambient lighting, has a greater frequency of lower reported sway measurements. This is further indicated with positive skew in the bootstrapped distribution shown in Figure 6.
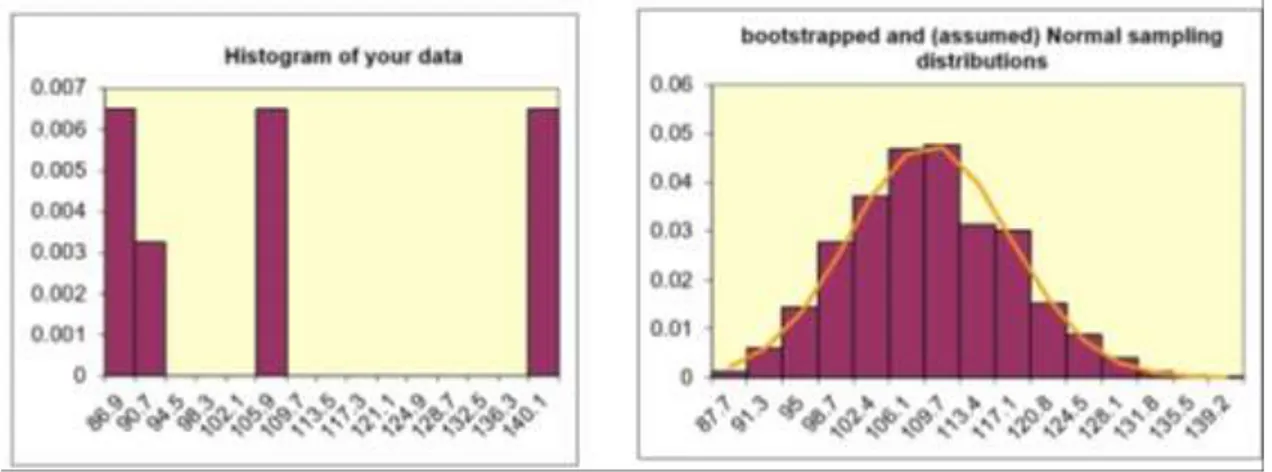
Figure 7: Histogram, Bootstrapped Distribution of Medial-Lateral Average Sway with Left Leg Gesturing, Ambient Lighting
The bootstrapped distribution for the average medial-lateral sway with the left leg gesturing in ambient lighting shown in Figure 7 follows a normal distribution closely, with slight positive skew. For other comments on the bootstrapped distribution of averages, see Appendix figures 10-15.
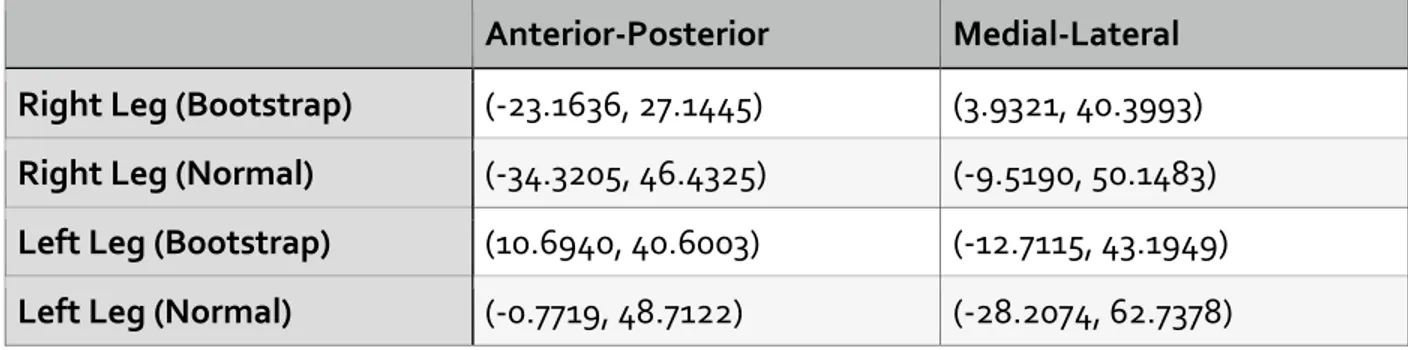
Statistical Hypotheses for Incremental Change H0: μ2 - μ1 = 0
HA: μ2 - μ1 ≠ 0
Anterior-Posterior Medial-Lateral Right Leg (Bootstrap) (-23.1636, 27.1445) (3.9321, 40.3993) Right Leg (Normal) (-34.3205, 46.4325) (-9.5190, 50.1483) Left Leg (Bootstrap) (10.6940, 40.6003) (-12.7115, 43.1949) Left Leg (Normal) (-0.7719, 48.7122) (-28.2074, 62.7378)
Figure 8: 95% Confidence Intervals for Mean of Differences
Only the bootstrapped confidence intervals, for anterior-posterior sway in the left leg, and the medial-lateral sway with the right leg show enough evidence that theatre lightning has a significant effect on a dancer’s sway. On average, a dancer had a force plate sway measurement between 10.69 and 40.60 units higher under theatre lighting than the force plate sway measurement under ambient lighting in the anterior-posterior direction. In the medial-lateral direction, a dancer had a force-plate measurement between 3.93 and 40.39 units higher under theatre lighting than under ambient lighting. Because the null value of zero is not included in these confidence intervals, there is sufficient evidence to reject the null hypothesis that theatre lighting has equal effect on sway as ambient lighting, and thus can infer that dancers experience greater sway in the anterior-posterior direction when gesturing with the left leg, and greater sway in the medial-lateral direction gesturing with the right leg under theatre lighting conditions.
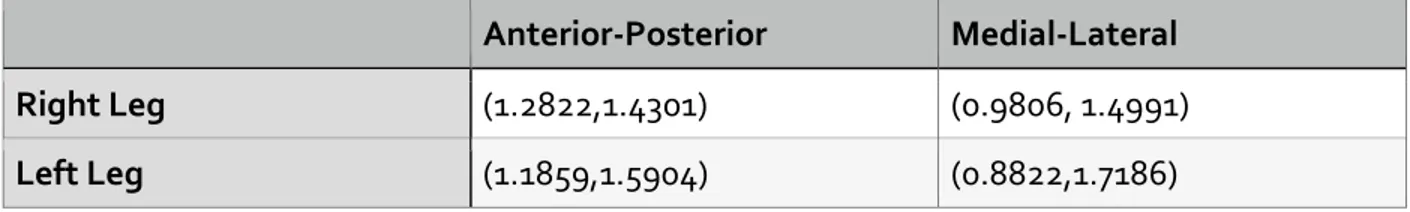
Statistical Hypotheses for Relative Change H0: μ2 / μ1 = 1 HA: μ2 / μ1 ≠ 1 Anterior-Posterior Medial-Lateral Right Leg (1.2822,1.4301) (0.9806, 1.4991) Left Leg (1.1859,1.5904) (0.8822,1.7186)
Figure 9: 95% Confidence Intervals for Ratio of Means
For the right leg executing the SEBT, the sway of a dancer in theatre lighting in the medial lateral direction is between 1.94% less and 50% more than the sway observed under ambient, lighting on average. For the left leg executing the SEBT, the sway of the dancer in the medial lateral direction in theatre lighting is between 11.78% less and 71.86% more than the sway observed under ambient lighting, on average. From the results of these confidence intervals, there is not sufficient evidence to suggest that theatre lighting has impact on the sway of a dancer, as the null hypothesis ratio (1.00) is included in this interval.
For the right leg executing the SEBT, the sway of a dancer in theatre lighting in the anterior-posterior direction is between 28.22% and 43.01% more than the sway observed under ambient, lighting on average. For the left leg executing the SEBT, the sway of the dancer in the anterior-posterior direction in theatre lighting is between 18.59% and 59.04% more than the sway observed under ambient lighting, on average. From the results of these confidence intervals, there is enough evidence to reject the null hypothesis, and to conclude that theatre lighting impacts the sway of a dancer in the anterior-posterior direction.
Conclusions
Three out of the four confidence intervals in each direction for incremental change, and two out of the four confidence intervals for relative change did not indicate sufficient evidence for theatre lighting having an effect on the sway of a dancer, and only two confidence intervals for incremental change indicated sufficient evidence that theatre lighting has an effect on sway. This result can be interpreted ambiguously. It’s desirable for dancers to be able to maintain their proprioception and manage their balance on stage and under theater lighting; it’s the scenario that matters most in a dancer’s career and is the penultimate showcase of their abilities. Thus, failing to reject that theatre lighting and ambient lighting have equal effect is a favorable conclusion- it’s a true mark of a professional dancer to be able to minimize and be aware enough of their muscular habits so the transition from studio to stage is seamless and autonomous. However, this result also inhibits the ability to establish the force plate and the SEBT test as a significant test for risk of injury, but this conclusion is also related to the issue of small sample size. Although the bootstrap analysis is useful and valid for this scenario, collecting similar data on more participants in the future would only solidify and give more insight to conclusions about average sway. Balance data is also susceptible to high variability, and by nature could be introducing some contamination to the data.
The confidence intervals for relative change in sway in the anterior-posterior direction did not include the null value (a 1 to 1 ratio), and thus indicates that a hypothesis test would have yielded a significant p-value, and thus show that perhaps dancers lack the proprioceptive awareness in the anterior-posterior directions, have greater instability in these directions, and that theatre lighting effects average sway more significantly in these directions. If going forward
with this study or recreating this study, perhaps more focus should be given to exploring the actions and sway in the anterior-posterior direction as a primary indicator of instability and risk of injury.
Appendix
Figure 10: Histogram and Bootstrapped Distribution for Average Sway in the Medial Lateral Direction: Right leg Gesturing in Theatre Lighting
The bootstrapped distribution shown in Figure 10 shows some positive skew.
Figure 11: Histogram and Bootstrapped Distribution for Average Sway in the Medial Lateral Direction: Left leg Gesturing in Theatre Lighting
Figure 12: Histogram and Bootstrapped Distribution for Average Sway in the Anterior-Posterior Direction: Right Leg Gesturing in Ambient Lighting
The bootstrapped distribution in Figure 12 follows a normal distribution closely, but the histogram of the data doesn’t show normality.
Figure 13: Histogram and Bootstrapped Distribution for Average Sway in the Anterior-Posterior Direction: Left Leg Gesturing in Ambient Lighting
The bootstrapped distribution in Figure 13 follows a normal distribution quite closely, while the histogram of the data shows more frequency at high and low reported sway values.
Figure 14: Histogram and Bootstrapped Distribution for Average Sway in the Anterior-Posterior Direction: Right Leg Gesturing in Theatre Lighting
The bootstrapped distribution in Figure 14 follows a normal distribution quite closely, while the histogram of the data shows more frequency at lower reported sway values.
Figure 15: Histogram and Bootstrapped Distribution for Average Sway in the Anterior-Posterior Direction: Left Leg Gesturing in Theatre Lighting
The bootstrapped distribution shown in Figure 15 shows negative skew, and the histogram shows greater frequency of higher reported sway values.
Works Cited (APA)
Gribble, P. A., Hertel, J., & Plisky, P. (2012). Using the star excursion balance test to assess dynamic postural-control deficits and outcomes in lower extremity injury: A literature and systematic review. Journal of Athletic Training, 47(3), 339-357. doi:10.4085/1062-6050-47.3.08 Hutt, K., & Redding, E. (2014). The effect of an eyes-closed dance-specific training program on dynamic balance in elite pre-professional ballet dancers a randomized controlled pilot study. Journal of Dance Medicine & Science, 18(1), 3.
Smith, T. O., Davies, L., de Medici, A., Hakim, A., Haddad, F., & Macgregor, A. (2016). Prevalence and profile of musculoskeletal injuries in ballet dancers: A systematic review and meta-analysis. Physical Therapy in Sport, 19, 50-56. doi:10.1016/j.ptsp.2015.12.007
Statistical Analysis Tools Used:
Dr. Ken Gerow’s Bootstrapping Tool and Confidence Interval for Paired Data Tool using Microsoft Excel R, for plots (Code Below)
dancedata=read.csv(file.choose(),header=TRUE)
plot(dancedata$ML.Sway.R.A~dancedata$Participant,ylab="Sway",xlab="Participant", main="Average Sway in Medial Lateral Direction: Right
Leg",col="purple",pch=8,lwd=3,ylim=c(0,160))
points(dancedata$ML.Sway.R.T,col="turquoise",pch=8,lwd=3) legend(x=1.,y=130,c("Ambient Lighting","Stage
Lighting"),pch=8,col=c("purple","turquoise"),cex=.90,lwd=3)
plot(dancedata$ML.Sway.L.A~dancedata$Participant,ylab="Sway",xlab="Participant",
main="Average Sway in Medial Lateral Direction: Left Leg",col="purple",pch=8,lwd=3,ylim=c(0,160)) points(dancedata$ML.Sway.L.T,col="turquoise",pch=8,lwd=3)
legend(x=1.,y=130,c("Ambient Lighting","Stage
Lighting"),pch=8,col=c("purple","turquoise"),cex=.70,lwd=3)
plot(dancedata$AP.Sway.R.A~dancedata$Participant,ylab="Sway",xlab="Participant", main="Average Sway in Anter-Posterior Direction: Right
Leg",col="purple",pch=8,lwd=3,ylim=c(0,170))
points(dancedata$AP.Sway.R.T,col="turquoise",pch=8,lwd=3) legend(x=1.,y=50,c("Ambient Lighting","Stage
Lighting"),pch=8,col=c("purple","turquoise"),cex=.70,lwd=3)
plot(dancedata$AP.Sway.L.A~dancedata$Participant,ylab="Sway",xlab="Participant", main="Average Sway in Anter-Posterior Direction: Left
Leg",col="purple",pch=8,lwd=3,ylim=c(0,170))
points(dancedata$AP.Sway.L.T,col="turquoise",pch=8,lwd=3) legend(x=1.,y=50,c("Ambient Lighting","Stage