LTHs 7:e Pedagogiska Inspirationskonferens, 30 augusti 2012
How illustrations influence performance and eye
movement behaviour when solving problems in
vector calculus
Marcus Nystr¨om and Magnus ¨
Ogren
Abstract—Mathematical formulas in vector calculus often have direct visual representations, which in form of illustrations are used extensively during teaching and when assessing students’ levels of understanding. However, there is very little, if any, empirical evidence of how the illustrations are utilized during problem solving and whether they are beneficial to comprehen-sion. In this paper we collect eye movements and performance scores (true or false answers) from students while solving eight problems in vector calculus; 20 students solve illustrated prob-lems whereas 16 students solve the same probprob-lems, but without the illustrations. Results show no overall performance benefit for illustrated problems even though they are clearly visually attended. Surprisingly, we found a significant effect of whether the answer to the problem was true of false; students were more likely to answer that the question was true given an illustrated problem. We interpret this finding as if the illustrations persuade the students that the answer is true, irrespective of whether or not it in fact is. These results may question the tacit consensus among teachers of vector calculus that illustrations are generally beneficial for comprehending a problem.
Index Terms—Problem solving, vector calculus, eye tracking, illustrations.
I. INTRODUCTION
P
RINTED textbooks are today becoming replaced bycomputerized media that can include both text, images, sound, and animations. In the wake of this transition, there is an increasing amount of research investigating how such multimedia presentation affect students’ learning and compre-hension. An influential framework on learning is the multi-media principle, which states that students learn better from pictures and words than from picture alone [1]. While this principle has been extensively used in educational psychology using standard texts and pictures, there is no evidence of whether these principles generalize to situations where text is presented along with equations and illustrations of complex mathematical form.
Researchers in educational psychology and multimedia learning have recently started to use eye tracking to gain insight into how students distribute their visual attention when inspecting learning materials or solving problems [2]. Eye movements provide information of where people look, for how long they look there, and how different parts of the problem are visually integrated. Prototypical eye movements such as fixations, where the eye is relatively still, and saccades, which Marcus Nystr¨om is with the Humanities Laboratory at Lund University. Magnus ¨Ogren is with the Department of Mathematics, Technical University of Denmark.
are rapid eye movements that move the eye between fixation, are known to correlate with ongoing cognitive processes in the brain [3], [4]. Therefore, eye movements provide detailed information about how the students process a problem and their ways toward finding a solution to it.
As an example of how eye tracking has been used to reveal problem solving strategies, experts were in [5] found to look at an imaginary radius of a circle required to solve a geometrical problem, whereas novices did not. In another study, participants looked at locations where a mechanical problem was previously shown in order to solve a new, related problem [6]. This was taken as evidence that eye movements to empty spaces were used to recall what was previously shown and use information from working memory to solve a new problem. In mathematical problem solving, previous work has shown that eye movements can reveal expert and novice strategies; experts read the question carefully before attending to the rest of the problem and, when inspecting an equation with four possible interpretations, performed pairwise comparisons of the equation and the correct alternative [7].
In this study, we investigate the effect of illustrations on problem comprehension in vector calculus and use eye track-ing to measure how students visually process the problems.
II. METHODS
Eye movements, speech, and true or false answers were collected from 36 students (Mage = 21.5, SDage = 3.0). The students were randomly assigned to one of two group: one (N = 20) solved eight illustrated problem and the other (N = 16) solved the same problems but without illustrations. They were students from Lund Institute of Technology (LTH) two weeks into a course in vector calculus. Each problem comprised an input text describing the problem (top/centre left), a question about the problem (bottom left) and, for one of the groups, a related illustration (centre right). The problems were shown in random order to the students. Figure 1 shows one of the problems.
When arriving to the experiment, the students were intro-duced to the equipment, and shown one example problem not included in the experiment. They were asked to solve the problems while concurrently verbalizing their thoughts. Eye movements were recorded at 250 Hz with the RED250 system and iView X (v. 2.7.13) from SensoMotoric Instru-ments (Berlin, Germany). A problem could be inspected for a maximum of two minutes, but the students were asked to
LTHs 7:e Pedagogiska Inspirationskonferens, 30 augusti 2012
Fig. 1. One of the eight problem superimposed with eye movement data from one student. In the non-illustrated condition, the students solved the same problem but without have access to the illustration. Lines and circles represent saccades and fixations and illustrate where the student looked while solving the problems. The diameter of a circle is proportional to the fixation duration.
respond with a mouse click as soon as they knew the answer. The response triggered the appearance of a new stimulus where the students answered whether they thought the answer was true or false.
III. RESULTS
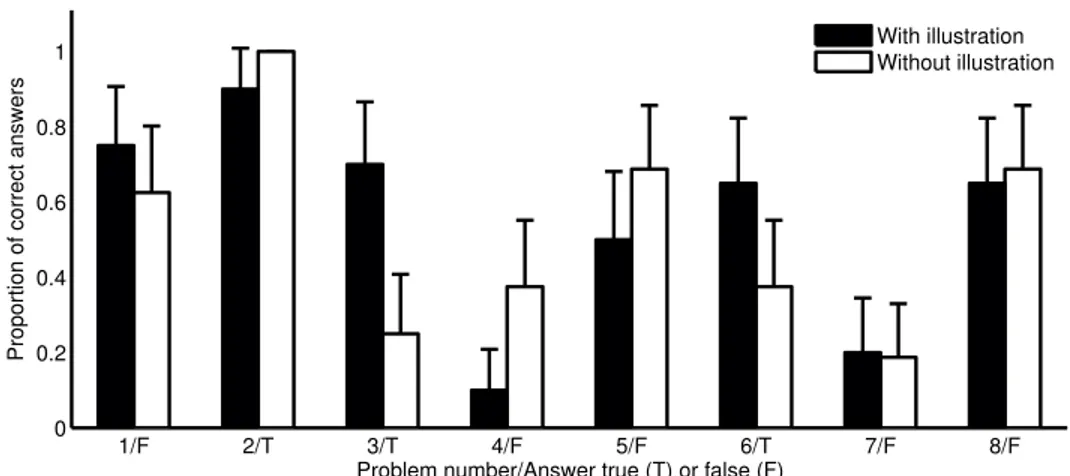
Figure 2 shows the proportion of correct answers for il-lustrated and non-ilil-lustrated problems. There seems to be no general benefit of including an illustration, but the proportion of correct answers appear to be influenced by whether the answer to a question is true (T) or false (F), in particular when an illustration is present. Running a linear mixed effect model in R [8] with proportion of correct answers as an outcome vari-able, illustration (with/without) and correct answer (true/false) as predictors, and student (1–36) and problem (1–8) as random factors reveals that there is a significant effect only of whether the answer is true or false (p < 0.05). More interestingly, there is an interaction between the predictors (p < 0.01). This interaction is visualized in Figure 3, and confirms that the proportion of correct answer increases when the illustration is present and the answer is true.
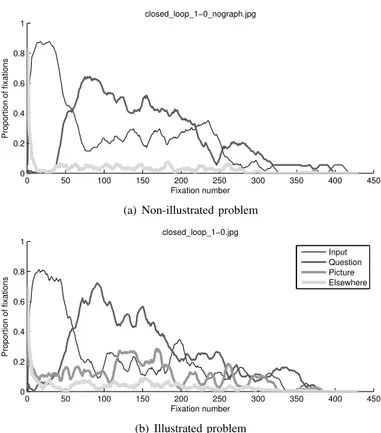
Given the small overall impact the illustrations had on performance, it is tempting to believe that the students used the information from the illustrations sparingly. However, while the input and the question attracted the majority of students’ visual attention (on average 22 and 21%), the illustrations were always inspected (11%). Figure 4 shows where the students were fixating over the time course of problem solving for one representative problem. Initially, the input text was read, and after about 50 fixation (about 15 seconds) the majority of students had continued to the question. When an illustration is present (Figure 4(b)), it attracts a fairly constant proportion of fixations over time, and is at every time instant inspected by about 5–20% of the viewers.
IV. DISCUSSION AND CONCLUSIONS
We investigated how illustrations influence comprehension and visual behaviour when students solve problem in vector calculus. Even though we found no comprehension benefit of utilizing illustrations, the illustrated problems had a larger
1 2 0.4 0.45 0.5 0.55 0.6 0.65 0.7 0.75
Condition (with illustration = 1)
Proportion of correct answers
Answer true = 0 Answer true = 1
Fig. 3. A plot visualizing the interaction between the presentation condition and whether the answer is true or false. The plot shows that an illustrated problem is beneficial only when the answer to the question is true.
0 50 100 150 200 250 300 350 400 450 0 0.2 0.4 0.6 0.8 1 Fixation number Proportion of fixations closed_loop_1−0_nograph.jpg
(a) Non-illustrated problem
0 50 100 150 200 250 300 350 400 450 0 0.2 0.4 0.6 0.8 1 Fixation number Proportion of fixations closed_loop_1−0.jpg Input Question Picture Elsewhere (b) Illustrated problem
Fig. 4. Proportion of fixations in AOIs over time for problem P1. The students start reading the input text, and then proceeds to the question. The picture is inspected a fairly constant proportion over time.
LTHs 7:e Pedagogiska Inspirationskonferens, 30 augusti 2012 1/F 2/T 3/T 4/F 5/F 6/T 7/F 8/F 0 0.2 0.4 0.6 0.8 1
Problem number/Answer true (T) or false (F)
Proportion of correct answers
With illustration Without illustration
Fig. 2. The proportion of correct answers per problem.
number of correct answers only when the answer was true. We interpret this finding as if the illustrations persuasively influence the students to believe that a statement is true regardless of whether or not it in fact is. Similar effects have been reported from previous research in brain imaging where articles accompanied by brain images received higher ratings of scientific reasoning than the same articles without images [9]. The reason for the higher credibility of brain images was explained by that they provide a concrete representation of the abstract cognitive processes required to interpret findings from cognitive neuroscience. It can be hypothesized that the illustrations of complex concepts in vector calculus serve the same purpose by offloading the cognitive system by externalizing mental representations of vector fields to physical images.
The eye movement data revealed how the illustrations captured students’ attention over the time course of problem solving. The illustrations were indeed visually attended, ap-parently enough to influence the students’ answers. Future research is however required to answer more in detail the relationship between how students look at text, equations, and illustrations and how problems are identified and solved.
ACKNOWLEDGMENTS
The authors want to thank Sveriges l¨aromedelsf¨orfattares f¨orbund (SLFF) for sponsoring this research. Halszka Jarodzka is acknowledged for valuable comments and ideas to the experimental design.
REFERENCES
[1] R. Mayer, “Multimedia learning,” Psychology of Learning and Motiva-tion, vol. 41, pp. 85–139, 2002.
[2] T. Van Gog and K. Scheiter, “Eye tracking as a tool to study and enhance multimedia learning,” Learning and Instruction, vol. 20, no. 2, pp. 95–99, 2010.
[3] K. Rayner, “Eye movements in reading and information processing: 20 years of research,” Psychological Bulletin, vol. 124, no. 3, pp. 372–422, 1998.
[4] K. Holmqvist, M. Nystr¨om, R. Andersson, R. Dewhurst, H. Jarodzka, and J. van de Weijer, Eye tracking: A comprehensive guide to methods and measures. Oxford: Oxford University Press, 2011.
[5] J. Epelboim and P. Suppes, “A model of eye movements and visual working memory during problem solving in geometry,” Vision Research, vol. 41, no. 12, pp. 1561–1574, 2001.
[6] D. Yoon and N. H. Narayanan, “Mental imagery in problem solving: An eye tracking study,” in Proceedings of the 2004 Symposium on Eye-Tracking Research & Applications. New York: ACM, 2004, pp. 77–84. [7] C. Andr`a, F. Arzarello, F. Ferrara, K. Holmqvist, P. Lindstrom, O. Robutti, and C. Sabena, “How students read mathematical representations: An eye tracking study,” in Proceedings of the 33rd Conference of the International Group for the Psychology of Mathematics Education, vol. 2, 2009, pp. 49–56.
[8] D. Bates and M. Maechler, lme4: Linear mixed-effects models using S4 classes, 2010, r package version 0.999375-42. [Online]. Available: http://CRAN.R-project.org/package=lme4
[9] D. P. McCabe and A. D. Caster, “Seeing is believing: The effect of brain images on judgments of scientic reasoning,” Cognition, vol. 107, pp. 343– 352, 2008.
Marcus Nystr¨om develops eye-tracking methods and analysis tools for eye movement data at the Humanities Laboratory at Lund University. He has worked in a wide spectrum of basic and applied eye movement research from perceptual video compression to educational psychology. He has co-authored the book Eye Tracking: A comprehensive guide to methods and measures (2011), Oxford University Press.
Magnus ¨Ogren is teaching at the Technical University of Denmark where he conducts research in applied mathematics and computational physics.

