Abstract of Thesis Adjustment of Girls In Homemaking Classes To Family Life by Mary Essig
L I -·
~:. C) I •, I p yCOLO'?A:JO l. : ~ .
cor
LEGt"r:~ :- r'",' J ., ~ C''1t ~ (}
'-~-1·0~R·20·02·0~1
I I I I 1111111
s
U184DD 907386437rt.
7~-Av
,; '1~'lCV'
1 1 .. ttl-11'" f Ot''"' OJ: $0 1 b - e't (\'t
ho
1 1 n 1:. ~Ju
tm
ntto
t.hQnom
111
t1
v-nl
n1 ~t<~u·r
"l
;>tr·l et.n
l.tlr
11.e. tun tbo··~e r
o not.
Of'-
a11fro
h~ tanetpol, t 0 0 h..
... b '~"• t 0-lf
•
fJow t4
0 i l l ~ 116e
1<t lu:ma~ '111m
?
•
H l l u d tt.r
tw
i 11e
lcfil
lr
a
t:'lio
,ot 1r
not.
·cr
out-st4lr
()'
lly . , )o not
rk'J••
r
th
pllo
tt
0uoatl
r
lf'J.B
o
em 'r
lOt'! lltftd t b~O llihO t1othare
do.
t.rk?
11 lted
\0rox-1 ntn
t.n
la
. ELtn
·urt,
. alf ,..
moth r
lOf'
·er
}lf
hre
t 1n~tS
•
$ t. tel
1 o Y• t'tt.UI~!Q ~ ofr
tly
•
J
e
or.
tel
nd
,
ttonn
lr .• tm
·
1tli
fo
tn
$ but.p
rm.m
1 aamtnl&~()rea•6
~obetrl a aoal
wt~e
e
n1 th n on b ~r.· 4 tr1
•
-6.
~ly
rel tt n
p
un!~!'1.1 h
tlo
tbe
or eo
~ l , ppr(;fola ! .,,t
11
0 ?.pr
v 'lou
a.
Tilr
r
..
or
1 •
lt
n"':y
t
n ural
o~ltl
? r lh
t
ot
•
1y
cnt
t
Ut '4.
-
H»'W do be
ju tmenw to family 11
fe
of
atr1
•~oue
rl!~rearing
u.
elr o.'t11¢lr n
alone oDIS
r
ll ti o~.t~ ld thbomo
compar&
.1
i
1
om
tu1S. UO do 6 tt
)te.r
Of trU.'J\hbl~El bG I?Ot'ktull
\l
c
.ltfi:14
·
~.o o
$compare Itt
noclal
.1uo
nttt
ttaa
th b •L I :' ,
COL07t' DO I f
THESIS
ADJUSTMENTS OF GIRLS IN HOMEMAKING CLASSES TO FAMILY LIFE
Submitted by MARY ESSIG
In partial fulfillment of the requirements for the Degree of Master of Science Colorado .Agricultural and .Mechanical College
Fort Collins, Colorado
July, 1945
Co. L 0,. r~:"" , - ... .... ·J ;· \. l" .. .C f,:. I r , .-~ .... __ I ._ J: G E
COLORADO AGRICULTURAL AND MECHANICAL COLLEGE
---Augus_t ___ 2_ ________ 194 ..
5----I HEREBY RECOMMEND THAT THE THES5----IS PREPARED UNDER MY SUPERVISION BY _______________ Ma.r_y ___ E_~_~_i_g ---ENTITLED ________ AD_JU.S.TMENT.S ___ QF ___ GJ:RLS .... IN .. HOMEMAKING ___________________________ _
_____________________________ ClAS.SES ___ T_Q ___ FAMILY ___ LIT.E _______________________________________________________________ _
BE ACCEPTED AS FULFILLING THIS PART OF THE REQUIREMENTS FOR THE DEGREE OF MASTER OF _________ .Scienc-e---
-MAJORING IN ---Home ... Ec.ono.mi.cs----Ed.u~-t-i-o~
---1
----- ---
·
-·---CREDITS.---4i---· ....
&~£~
In Charge of Thesis APPROVED __
2$z,~
----
):r~~
-
~
---. Head of Department
Examination Satisfactory ,Committee on Final Examination
~
...
£
_
'}rdiL,~4 L~-~
__
_
:.n_~
___
_
_
G.e£~-
--
---1{~2
u~
&>#~
--
-
-~~---#...~-_
__
_
___
\1
_
~~---
---Dean of the Graduate School
Permission to publish this thesis or any part of it must be obtained from the Dean of the Graduate School.
ACKNOWLEDGEMENTS
The writer wishes to express her sincere appre-ciation to the following persons for their interest and guidance in the developing and writing of this study: Dr. Maude Williamson, Professor of Home Economics
Educa-tion, Dr. David H. Morgan and Dr. Everett B. Sackett, Supervisors of Research in Home Economics Education, and Miss Irene Coons, Reference Librarian.
The writer is extremely grateful to Dr. Leland
H. S~ott for his permission to use his ~ ~ scale
and to the 10 vocational home economics teachers of Missouri for their help in securing the data.
CONTENTS Chapter Page I INTRODUCTION •
.
.
.
.
.
• • 8 9 10 10 11 The Problem.
.
.
.
. . .
. . .
Problem Analysis • • • • • • • • • • • Delimitations.
. .
.
.
.
.
.
. .
.
.
II REVIE OF LITERATURE.
. . .
. . .
.
.
Current Attitudes Toward Juvenile
Delinquency • • • • . • • • • • • • • 11 Measuring Adjustments to Family
Life . . • . • . . . . Studies of Children of Working
Mothers • • • , • • III METHODS AND MATERIALS
. . .
• • •.
.
~election of Scale • • • • • • • • • • • Construction of Questionnaire • • • • • • 13 18 23 23 25 Selection of 'Sample • • • • • • • • • • • 25 IV ANALYSIS OF DATA • •.
. .
.
.
.
. .
.
• • Statistical Procedure • •.
. . .
.
• • • Description of Sample. .
.
.
. . .
.
Difference in Adjustment of the
27 27
29
Two Groups • • • • • • • • • • • • • • 35
Comparison of Rural and City G~rls • • • 39
Comparison of Two Groups on Various
Items of ~ ~ Scale • . • • . • • 41
---
---
----
--Chapter
v
DISCUSSION. .
. .
.
.
.
.
Implications for Home Making Education • • • • • • • . Recommendations for Further
Page
.
. .
.
.
.
64. . .
.
.
.
71 Study • • • • • • • • • • • • . . • • 73 VI :SUMMARY.
.
.
. .
.
.
APPENDIX •.
. .
.
.
.
.
BIBLIOJRAPHY • • •.
.
.
. .
.
.
.
.
.
. .
.
.
.
. .
• • • •.
. .
• • • 75 79 97Table
1.
LIST OF TABLES
DISTRIBUTION OF GIRLS INCLUDED IN THIS
SAMPLE ACCORDING TO THE 'SCHOOL COMMUNITY AS CLASSIFIED BY THE 1940 CENSUS • • • • • •
2. AGES OF GIRLS INCLUDED IN THIS STUDY CLASSIFIED ACCORDING TO EXPERIMENTAL
3. 4. 5.
6.
GROUP AND CONTROL GROUP • • • •
. .
.
.
l'HJMBER OF YEARS EMPLOYED MOTHERS OF GIRLS OF THIS SAMPLE HAD WORKED • • • • • • •
TYPES OF EMPLOYMENT OF MOTHERS OF GIRLS
IN THIS STUDY • • • • • • • • • • • •
.
.
.
TIME OF DAY EMPLOYED MOTHERS OF GIRLS IN THIS STUDY WORKED ACCORDING TO DAY,
NIGHT, OR BOTH AT DIFFERENT TIMES • • • l'."'UMBER OF MOTHERS OF SAMPLE AT HOME WHEN GIRL ARRIVED ACCORDING TO EXPERIMENTAL
GROUP AND CONTROL GROUP. • • • • • • • • •
•
7. MEAN, MEDIAN, AND MODIFIED RANGE OF SCORES OF EXPERIMENTAL GROUP AND CONTROL GROUP
Page 30 31 32 33 34 35 ACCORDING TO COMMUNITIES • • • • , • • • • • 36 8. 9. 10.
FREQUENCY DISTRIBUTION OF SCORE MADE BY GIRLS OF SAMPLE ON THE HOME LIFE SCALE ACCORDING TO EXPERIMENTAL GR(ij'!)AND
CONTROL GROUP • • • • • • • • • • • • • MEANS AND STANDARD DEVIATIONS OF GIRLS ON HOME LIFE SCALE ACCORDING TO
EXPERI-MEN~AN:DiCONTROL GROUPS • • • • • • • •
SIGNIFICANCE OF THE DIFFERENCES OF THE MEAN AND THE STANDARD DEVIATION OF URBAN AND RURAL GIRLS OF THE SAMPLE ACCORDING TO EXPERIMENTAL AND CONTROL GROUPS • • •
.
.
37.
.
39---~---·---~
Table
11. SIGNIFICANCE OF THE DIFFERENCE OF THE MEAN AND STANDARD DEVIATION OF EXPERI-MENTAL AND CONTROL GROUPS ACCORDING TO TYPE OF COMMUNITY • . . • • . . • • . . 12. RANK OF NUMBERS OF POSITIVE RESPONSES OF
GIRLS OF SAMPLE TO ITEMS ON FAMILY AD-JUSTMENT ACCORDING TO EXPERIMENTAL GROUP
Page
.
.
40 AND CONTROL GROUP . . . • • . • • . • • • • 4213. SIGNIFICANCE OF DIFFERENCE BETWEEN
EXPERI-MENTAL GROUP AND CONTROL GROUP IN THEIR POSITIVE RESPONSES TO ITEMS ON THE HOME
Chapter I INTRODUCTION
Today, economic changes have altered ways of living in many homes. Some homemakers have had to take over the job of breadwinner, others have felt it their patriotic duty to help in this period of manpower short-age, and still others have been unable to withstand the lure of high wages for satisfying the material wants of
themselves or their family. Those mothers who are
work-ing have less time for homemakwork-ing.
The fact that working mothers have less time to give to homemaking is commonly cited as one of the causes of "increased juvenile delinquency.• According to a report of the Children's Bureau of the United
States Department of Labor, 1943, (10:6) statistics show that there is no alarming tendency toward increased
juvenile crime although, in some communities, juvenile delinquency has increased and generally the rate of
in-crease is greater for girls than for boys (10:6). This report continued as follows:
The child who is unhappy in his family relationship is likely to seek satisfaction away from home. And if he lives in a com-munity in which antisocial attitudes prevail,
-:---···
-~-in which other children -~-in the neighborhood seem to be getting a lot of fun out of for-bidden activities, in which a pattern of delinquent behavior is traditional, he is more susceptible to the attractions of
delin-quency than another child under the same com-munity influence who has found more strength and satisfaction in his home. (10:12).
Zachary in an article on juvenile delinquency stated that since fathers are departing for war services and mothers for work, many children are left temporarily
or partially orphaned to roam the streets unsupervised ( 18 !45).
Keliher in an article "Expect This From Child-ran--When Mothers Work" enumerated the nervous symptoms of children and then concluded.
Of all the possible causes, the most im-portant is that mothers are working. . • • The surprising thing is that we don't see worse
signs of maladjustment in many children (4:336). Keliher thus voiced the opinion of many.
Because of the prevalence of the opinion that increased juvenile delinquency tendencies are caused by more mothers working and because maladjustment to the home and family is one of the first steps toward
juven-ile delinquency, a study to determine whether adolescent girls whose mothers work are more poorly adjusted to family life than those whose mothers do not seems worth-while.
Problem
educa-tion of the differences in adjustment to family life be-tween the girls in home economics classes whose mothers work outside the home and those whose mothers do not work outside the homer
Problem analysis.--1. How well adjusted to the~
families are home economics girls whose mothers work out side the home full time?
2. How well adjusted to their families are hom economics girls whose mothers do not work outside the home?
3. How do girls whose mothers work compare in their adjustment to the family with those whose mothers do not work?
4. What are the implications to home economics education of the differences between the home economics girls whose mothers work and those vvhose mothers do not work?
Delimitations.-- The sample in this study will be limited to approximately 300 ninth and tenth grade girls in home economics classes in Missouri, one-half with mothers giving full time (40 hours or more per week) to work outside the home for pay and the other half with mothers giving full time to homemaking.
Only homes in which both parents reside will be considered in this study.
-:---~-
~--·~,---Chapter II
REVIEW OF LITERATURE
As a preliminary step in the study of the ef-ects of mothers working outside the home on the adjust-ment of their daughters to family life, some
investiga-tion of the literature denoting the current attitude toward maladjustment of children and juvenile delin-quency was considered necessary. ·studies dealing with devices used in measuring adjustment to family life, as well as the several studies dealing directly with children ~hose mothers are engaged in gainful employ-ment were also reviewed.
Current attitudes toward juvenile delinquency.
Caroline B. Zachary in an article, "Emotional Problems of the Adolescent and Juvenile Delinquency,• published in the winter of 1942-43, declared that the delinquency of juveniles
• • • is a sign something is wrong--radically wrong with their homes, the daily environment where they have come into being and which, like the earth and sunlight of the plant, has fostered their growth. Fathers are departing for war service and mothers for work leaving many children--temporarily or partially or-phaned--to roam the streets unsupervised.
A report of the Children's Bureau in 1943, entitled "Understanding Juvenile Delinquency" stated that there is "no alarming increased 'juvenile crime' as the newspapers perennially claim" (10:6). The fol-lowing statements are quoted from this report.
All that the available figures indi-cate, however, is that in some communities
juvenile delinquency has increased and gen-erally the rate of increase is greater for girls than for boys (10:6).
In order that a child may grow up into a mature well adjusted adult, able to partici-pate in our society without too much emotion-al strain, he must have, particularly in his
early childhood, the kind of family that will help him to satisfy certain fundamental needs.
(10:10).
These needs were indicated as the need for love and affection, security with other human beings, growth and achievement, and status as an individual apart
from his family.
The child Who is unhappy in his family relationship is likely to seek satisfactions away from home. And if he lives in a com-munity in which antisocial attitudes pre-vail, in which other children in the neigh-borhood seem to be getting a lot of fun out of forbidden activities 1n which a pattern of delinquent behavior is traditional he is more susceptible to the attractions of delin-quency than another child under the same com-munity influences who has found more strength and satisfa9tion in his home (10:12).
In wa~time the well being and security
of children are threatened not only by the general atmosphere of tension but by the act-ual dislocations and disin~egration of the family life that accompany war. • • • Large
numbers of children are left without adequate supervision while their mothers are at work (10:19 ).
Healthy, happy, secure children--child-ren who feel comfortable with themselves, their playmates, their parents and other
adul·ts--do not as a rule become delinquent.
The most fundamental way to prevent delin-quency is to help children be healthy, happy and secure (10:21).
In 1944, Beals in an investigation of wartime problems of children in Chicago public schools disclosed that one of the principal causes of problem behavior
is lack of parental supervision because of the employment of parents in war production
plants. In many oases the father works in
day time and the mother works at night or
their employment is reversed, with the
re-sult that children are utterly without super-vision. Many of them run the streets at all hours of the day and night (1:296).
He also declared that girls "get themselves in
worse difficulties than boys. • • • In many cases there
is little or no family supervision, with the result that girls wander from the paths of rectitude" (1:296).
Measuring Adjustments !£Family ~
In studying the effects of the work of mothers outside the home on adjustments of daughters to family life, it is first necessary to determine ways of mea-suring adjustments to family life.
Symonds (9) prepared an adjustment question-naire in 1934, in which there were two forms, one with questions in yes-no form and the other in multiple
---~~~--~m---,~-·~ . ·- - " " 1
choice. It was designed to measure adjustment from the
statements of the pupils regarding their likes and
dis-likes. Section VI which dealt with home life contained
19 items. The reliability of this section was .62.
Rose Stagner of People's Junior College, Chic-ago, and Neal Draught (7) of University of Wisconsin re-ported a study, in 1935, of the attitudes of college
stu-dents toward their parents. One hundred and twenty
statements expressing various degrees of affection and antagonism were keyed on an 11 point scale by 50 judges. This scale was used for both father and mother and was
given to 120 young men and 120 young women. The values
of the scale for fathers and for mothers were not the same because ''it appears a statement made about one's father is more favorable than the statement made about one's mother" (7:170).
These college students were also asked to give themselves a graphic self rating on affection, confidence
and authority. The validity of the scale was also check
ed by autobiographies written by the students. Numerous
questions were aske·d about both parents, and mean a
ttl-tude scores were computed for those giving positive and negative answers. A low score in these scales meant a favorable attitude. A comparison of the scores made by these students on this scale with those which they made on the Bernreuter Personality Inventory showed that those
;---
--·-
---making high scores toward each parent scored high on self-sufficiency. The authors concluded,This fact, taken in connection with the positive correlation of the two attitude
scales, leads us to infer that self-sufficient children are likely to take a less favorable attitude toward both parents than children lacking in this characteristic (7:175).
In 1936, Clarabelle Freidheim (3) completed a study of attitudes of high-school girls enrolled in home economics classes
to discover their attitudes on certain personal social and economic problems, to determine
whether their attitudes in the opinion of a group of experts, tended to be those of well adjusted individuals, and to find out what
factors affected their attitudes (3:74).
Twenty-one attitudes were checked in the above mentioned study by a group of college graduates and by a number of experts with the intent of making a five-point
scale. After recommended changes a questionnaire was made from this check list, and the reports of 664 girls were studied. Of particular interest were the findings regarding attitudes toward family recreation, parental authority, family loyalty, entertaining at home and con-sideration of the rights of others. Nine-tenths of the girls approved family recreation. Forty-three per cen~
did what they were told without arguing and 40 per cent felt they should accept the judgment of parents without argument. Nearly three-fourths of the girls ranked high in family loyalty. Nearly 95 per cent felt that they would rather entertain at home thari any place else
al-·---=-~---~~--·
..
though there was less difference in the levels of the scale for consideration of the rights of others.Kibler (5) made a study, in 1941, to discover the attitude of high-school boys and girls toward five major issues in family relationships, division and use of family income, use of leisure time, division of home re-sponsibility, use of common property in the home, and philosophy of home life. The investigator prepared a testing device of 52 pairs of statements presenting the opinions of pupils toward these five major issues, each pair of statements presenting opposing views, one desir-able and one undesirdesir-able.
The opposing opinions were used to measure consistency of the pupils responses and there-fore the reliability of the test • • • • The validity of the test was established by giving it to a group of well known high school girls and then comparing their responses to the state-ment with their known behavior tendencies (5:32).
The test was given to 300 eleventh-grade boys and girls. The responses of the pupils were 80 per cent desirable, 10 per cent undesirable, and 10 per cent un-certain. Attitudes were found to be more desirable con-earning the division of the responsibilities in the home
than concerning the other four issues and were least de-sirable concerning the use of money and the use of lei-sure time.
A group of 490 young persons was given 64 ques-tions pertaining to home life by Leland Stott (8) in 1940
---
---,---From their responses, he formulated a scale for measuring
their adjustment to home environment. In the analysis of
this scale, he found a variation which ranged from mutual affection, companionability, a sense of fairness, helpful ness, and a feeling of sympathy between adolescent and parent at one end of the scale to the feeling that parenw were unfair and dictatorial and that little affection or congeniality lay between the adolescent and his parent at
the other end of the scale. The Spearman-Brown
(split-half) reliability coefficient of the scale was found to be
.91. Further investigation indicated that the scale was
not valid for measuring home environment, but that the
variable involved was more personal b~cause there was a
correlation of only ~.22 with a standard error of .13
be-tween scores of 51 pairs of siblings.
Correlations were then computed between scores
of this scale and scores of the California Test of Person
-~~---Second Series. The correlations for the family variables, "total adjustment," and "social
adjust-ent," were ~.62 each. The correlation for "family
re-component of "social adjustment," was ~.65.
After this coefficient was corrected for attentuation, it
was 4.81. The correlation for "self-adjustment" was ~.50
Since there was a fairly high reliability and an insigni~
icant sibling correlation, Dr. Stott concluded (8:149) It is a measure of the personal adjustment
---~---.
of the individual adolescent to his parents and family situation. It might be regarded as a measure of the adequacy of the adolescent-parent relationship from the standpoint of the adolescent. It might further be regarded as a measure of par-ental success or failure so far as that particular child is concerned (8:149).
Studies 2e_ Children of Working Mothers
The studies made on children of working mothers are few. In 1922, Helen Russell Wright (11) made a study
called "Children of Wage Earning Mothers." She used the records of the United Charities to secure part of the in-formation about the children, and the rest of the infer-mation was gained by personal interviews with their
mothers. The sample was composed of 2,066 children of 842
wage-earning mothers in Chicago. These children were un-der 14 years of age. Since the author was chiefly con-cerned with the physical handicaps of the children, the findings are not of much value in this study. However, when speaking of delinquent children she said
A study of the homes of this group of wage-earning mothers seems on the whole to indicate that most of them were surprisingly successful in training and disciplining the children so that they did not get into serious mischief
(11:75).
• • • • • • • • • • • •
.
. . . .
.
.
.
. .
.
A small study like the present inquiry is obviously too limited in scope to warrant any general conclusion with regard to social ad-vantages • • • • Among the older children, cases of behavior problems were found, sometimes a clear connection with the employment of the mothers being indicated. In less tangible but possibly more important ways the children suf-fered from the fact that their Mothers were un-der the strain of carrying a double load (11:76).-
-
- - - -
- - - -
·
- - -
·-r
Ideas and attitude of children toward condi-tions caused by the employment of the mother outside of the home was reported by Mathews (6) in 1931. For this study statements concerning attitudes regarding the place of the mother in the home and home life in general were secured from. 781 elementary high school, and university pupils. From these statements a "Home Blank11 question-naire of 100 items was constructed. Five hundred and eighty-six children from the fifth to the ninth grades answered these questions by "yes" or "no" and then labeled the answers "glad" or "sorry". A hundred of these children were from homes where mothers worked full time away from home. These 100 were paired with 100
children whose mothers did not work, on the bases of age, sex, grade, school, community, and occupation of the
father. "The reliability of the Home Blank was checked by several methods" and "the reliability coefficient
(self-reliability using the Brown formula) for facts was .77::!'- .03; for attitudes, .69~ .0311 • (6:119).
The responses were studied in the following four ways.
1. Condition score obtained from "yes" re-sponses for conditions existing in the home.
2. Attitude score obtained from "yes-glad" and "no-sorry" responses.
---·---~--~---·
·-analysis of the agreement of the home conditions indicated on the blanks with adult social standards.
4. Socially approved attitude score from the extent to which the pupils were in agreement with social-ly desirable attitudes.
5. Happiness score from the "glad• responses which indicated the child's happiness because, of or in spite of, his conditions.
An analysis of the condition score revealed th~ 29 out of the 100 items showed a statistical difference between the two groups in respect to home conditions. The disadvantage fell on the side of the children of the
worker.
A greater similarity was found to exist between the two groups in respect to attitude score than socially ~proved condition score. These attitude scores represent·
ed the extent to which the children approved the home con-ditions. The chief differences between the groups in respect to attitudes wer·e on these nine items:
1. Are your clothes nice 't
2. Do your folks usually send your laundry out·t 3. Do you sometimes have to make your own
jbreakfast·t
4. Does your mother go off to work in the day ~imei
your playr
neighborsr
home·r
(6 :125)
5 •. Does your mother of ten interrupt you in
6. Does your mother sometimes visit the
7. Is your mother usually home after schoole
8~- Does your mother do all the cooking at
9. Does your mother do most of the housework t
More unfavorable attitudes were found among the
children of the workers than among the others. Although 40 per cent of the children of workers showed approval
toward out-of-home employment of mothers, 89 per cent
approved of the mother staying at home most of the time (6 ::134).
According to the socially approved condition
score the children of the non-workers lived under home
conditions more favorable from the standpoint ·of adult
standards that did the children of the worker. Their
attitudes -also were slightly more in agreement with these
standards. The variability of scores for the worker
group was some what larger than that for the non-worker
group (6:i28,9). The extent of agreement with adult
tandards therefore varied more among children of working others than among the other children. (6:129).
Although the difference was found to be small the children of workers were significantly less happy
~han those of non-workers according to the happiness
~core.
In conclusion Mathews said
On the whole the findings of this study are very wholesome. Statistically speaking figures
. show significant differences between the homes of workers and non-workers for both conditions and attitudes, with a slight accumulation of d.isadvantage to the worker group. But the most impressive thought to be gained from a study of these figures is that the differences are small. It is beyond the province of this study to prove why and where these attitudes come into being, but it is a fact that the worker's child is not embittered by his condition (6:135,6).
Chapter III
METHODS AND MATERIALS
This study of the implications to homemaking education of the differences in the adjustment to fam-ily life between the girls in home economics classes whose mothers work outside the home and those whose mothers do not work was made by means of an adjustment
scale, ~Life, and a short questionnaire, both given to 500 ninth and tenth grade home economics girls in ll communities in Missouri.
Selection Q!Scale
A
number of published scales on the adjust-ment of individuals were examined and a scale by Dr. Leland :Stott. formerly of the University of Nebraska called ~ ~. a refinement of his Family ~ scale was selected as being the most valid for use in this study.said:
Concerning his Family Life scale, Dr • . Stott
It indicates the extent to which the in-teraction between himself (the adolescent) and his family, ffrom his standpoint involve
•con-fidence, mutual trust, affection and compan-ionability' and hence is satisfying and con-structive ~o him personally. • • • The variable
ranges from mutual affection, companionability, a sense of fairness, helpfulness and a feeling
of sympathy between adolescent and parent at one extreme of the scale to a feeling that the par-ents are unfair· and die ta torial, that they are not worthy of confidence and that little
affec-tion or congeniality is present in the relaaffec-tion- relation-ship, at the other extreme. . • • • . . . •
.
.
.
.
. .
.
.
.
.
.
. .
.
.
. .
.
.
. . .
.
.
.
In order to further the nature of the variable, correlations were computed between it and the scores on the California Test of Personality-Second .Series. The family-life variable was
found to be related to "total adjustment" and to "social adjustment" each to the extent of -1.62. The correlation with ''family relations•, a component of •social adjustment~ was ~.65,
and when this coefficient was corrected for attenuation due to the unreliability of the scales it became +.81. The correlation with •self-adjustment" was 4.50.
These correlations, in connection with the fairly high reliability and insignificant sibling correlation of the family-life scores, were interpreted to mean that our scale is also a measure of adjustment. It is a measure of personal adjustment of the individual adol-escent to his parents and family situation.
(8 :148-9}
In a letter
1/
to the writer Dr. Stott said, The Home Life scale ~ is the same as the one used in the study to which you referred, ex-cept that it is somewhat more refined. It in-cludes only those items that were found to be most closely related to the attitude measured. The reliability, as well as the validity of the scale was improved. With both high school and college students the reliability coefficients based on the present eighty items were about.94.
1t
See Appendix A for copy of Letter---~==-~~---~
Construction of Questionnaire.
The short questionnaire ~ previously mentioned which accompanied the scale was designed to secure in-formation about the community, the home of the girl, and the work of the mother. The questionnaire was considered by a class of homemaking teachers in research at Colo-rado Agricultural and Mechanical College for suggestions and criticisms before the final form was constructed.
Selection £[Sample.
An
effort was made to obtain reports of girls from various types of communities in which mothers work-ed outside the home. To do this, 10 home economicsteachers in Missouri were asked to cooperate in securing the information. Those asked to assist were either
teachers whom the writer knew or who had been recommend-ed by the state supervisor of home economics as teachers who had the confidence and good will of the girls in their community.
Because it was believed that the answers of the girls would be more honest if no names appeared on either the scale or the questionnaire, the scales and the questionnaires were numbered from one to 500 inclu-sively. The persons who administered these forms gave the girl a scale with the same number as that on her questionnaire.
The questionnaire and scale from each girl were clipped together and sorted according to those of girls whose mothers worked full time for pay and those whose mothers did not work outside the home. One hundred and
sixty-three forms from girls whose mothers worked inter-mittently and from girls who came from broken homes as well as the forms improperly filled out were discarded. Since there were 151 complete records for girls whose mothers worked, the first 151 records from the girls whose mothers did not work were scored as they came without selection.
After the 302 forms, 151 from girls of mothers who worked, the group hereafter called the ~experimen
tal group," and 151 from girls whose mothers did not work, "the control group", were scored, they were ar-ranged in separate groups according to communities with the scores in descending order, and tables were con-structed of the most important data sought.
Chapter IV ANALYSIS OF DATA
The data for this study on the family adjust-ment of daughters of employed mothers were collected
dur-ing 1944 and 1945 from questionnair$s and Home Life
-scales which were given by 11 vocational home economics teachers in Missouri to 302 ninth and tenth grade girls, 151 of whose mothers worked outside the home and 151 of whose mothers did not work outside the home.
The data have been organized under the
follow-ing headings~ description of the sample and the findings
on the difference in the adjustments of the two groups of girls.
Statisical procedures
To ascertain the significant difference in the adjustment between the control group, girls whose mothers did not work, and the experimental group, girls whose mothers were employed, the differences were analyzed in terms of the obtained means, the obtained standard
deviations, and the obtained per.centages. The standard error of the difference is a statistic commonly used to determine the variability of obtained differences when
infinite numbers are used. The ratio of the statistic to its standard error is called the critical ratio and will be indicated in this study by
i•
The statistical procedures used for obtaining the standard error of the difference between the two statistics were as follows:
r
(T-:,
+
Standard Deviation v
Percentages
In interpreting the critical ratio the follow-ing limits were applied:
3 or above - Very significant
2 to 3 - significant less than 2- not significant
In interpreting these limits, a critical ratio of 3 means that the chances are 99.9 in 100 that the true differ-ence is greater than zero and that there is only one-tenth or less of one chance in 100 that the difference may be attributed to pure chance. A critical ratio of from
&
to 3 means that there are from 98 to 99.9 chances in 100 that the true difference is greater than zero and that there are from one-tenth of one chance to two~---ces in 100 that the difference may be attributed to pure chance.
The statistical terms used in the tables and in the analysis are as follows:
S.D. Diff.
s.E.
D Standard deviation Difference Standard error of DifferenceA minus sign before the per cent in the column in a table indicates that the girls whose mothers were employed, the experimental group, scored higher than did the girls whose mothers were not employed.
Description
E.!
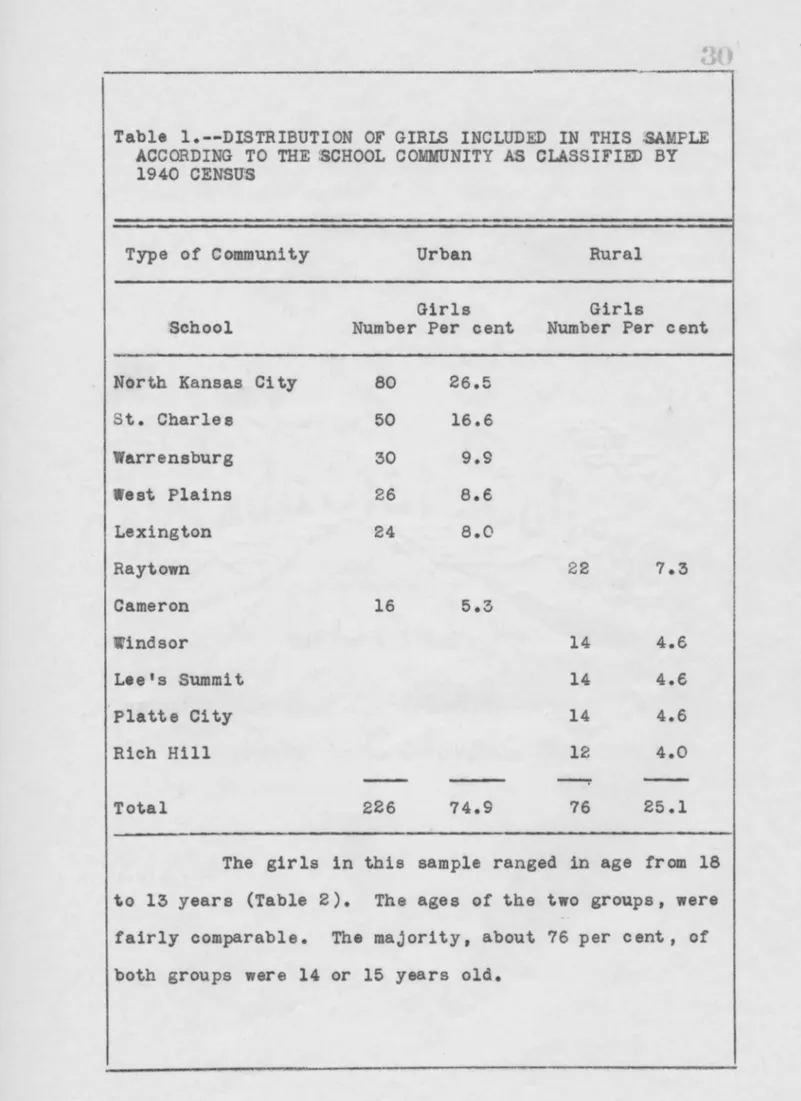
sampleA description of the sample of this study was gained !rom the responses to the questionnaires filled out by the 302 ninth and tenth grade girls of normal homes, 151 of whose mothers were employed and 151 of whose mothers were not employed. The girls came from 11 communities, an equal number of each group from each com-munity. According to the classification of the commun-ities in the 1940 census, three-fourths of the girls were from urban communities (Table 1). Of these three-fourths,
more than one-third came from North Kansas City which is a part of Greater Kansas City. One-fourth of the total number of girls came from small town communities class-ified as rural.
Table 1.--DISTRIBUTION OF GIRLS INCLUDED IN THIS ;SAMPLE ACCORDING TO THE SCHOOL COMMUNITY A'S CLASSIFIED BY 1940 CENSUS
Type of Community Urban Rural
Girls Girls
'School Number Per cent Number Per cent North Kansas City 80 26.5
St. Charles 50 16.6 Warrensburg 30 9.9 West Plains 26 8.6 Lexington 24
e.o
Raytown 22 7.3 Cameron 16 5.3 Windsor 14 4.6 Lee's Summit 14 4.6 Platte City 14 4.6 Rich Hill 12 4.0-
-
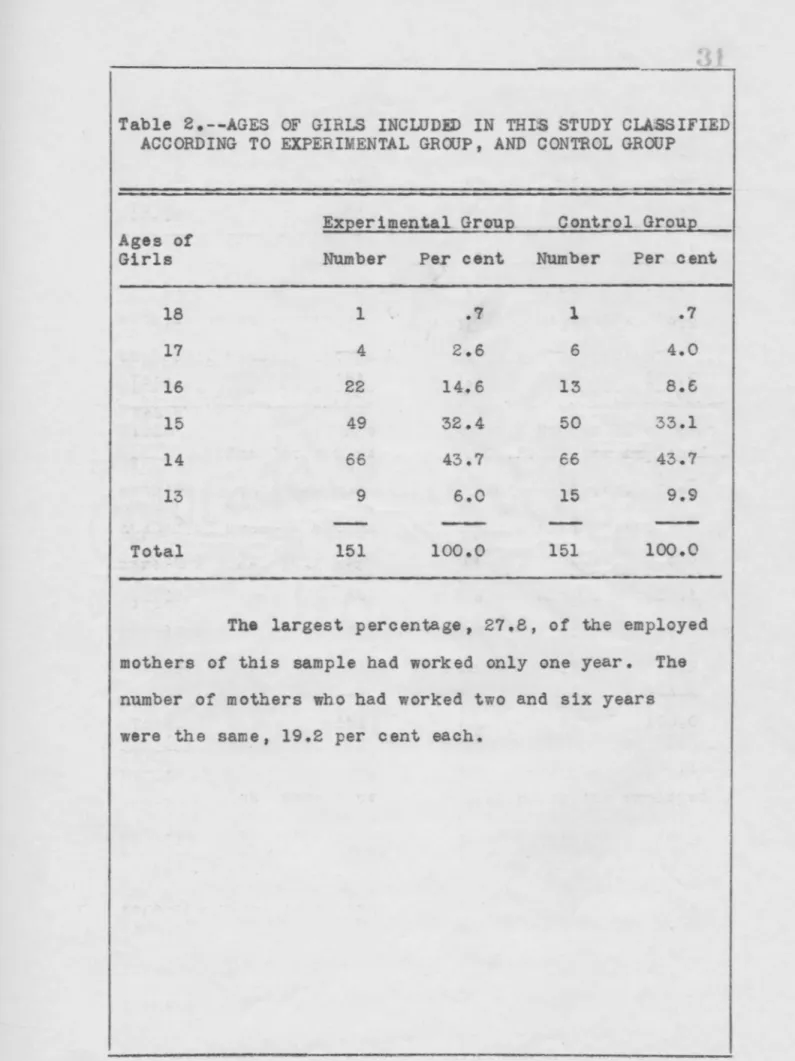
-Total 226 74.9 76 25.1The girls in this sample ranged in age from 18 to 13 years (Table 2). The ages of the two groups, were fairly comparable. The majority, about 76 per cent, of both groups were 14 or 15 years old.
Table 2.--AGES OF GIRLS INCLUDED IN THI$ STUDY CLA$SIFIED ACCORDING TO EXPERIMENTAL GROUP, AND CONTROL GROUP
ExEerimental GrouE Control GrouE Ages of
Girls Number Pe.r cent Number Per c.ent
18 1 .7 1 .7 17 4 2.6 6 4.0 16 22 14.6 13 8.6 15 49 32.4 50 33.1 14 66 43.7 66 43.7 13 9 6.0 15 9.9 Total 151 100.0 151 100.0
The largest percentage, 27.8, of the employed mothers of this sample had worked only one year. The number of mothers who had worked two and six years were the same, 19.2 per cent each.
,---=---~---Table 3 .--NUMBER OF YEARS EMPLOYED MOTHERS OF GIRLS OF
THIS 'SAMPLE HAD WORKED .
Number of Number of Per cent of
years mothers mothers
6 or more 29 19.2 5 12 8.0 4 15 10.0 3 24 15.8 2 29 19.2 1 42 27.8
-Total 151 100.0---
·-
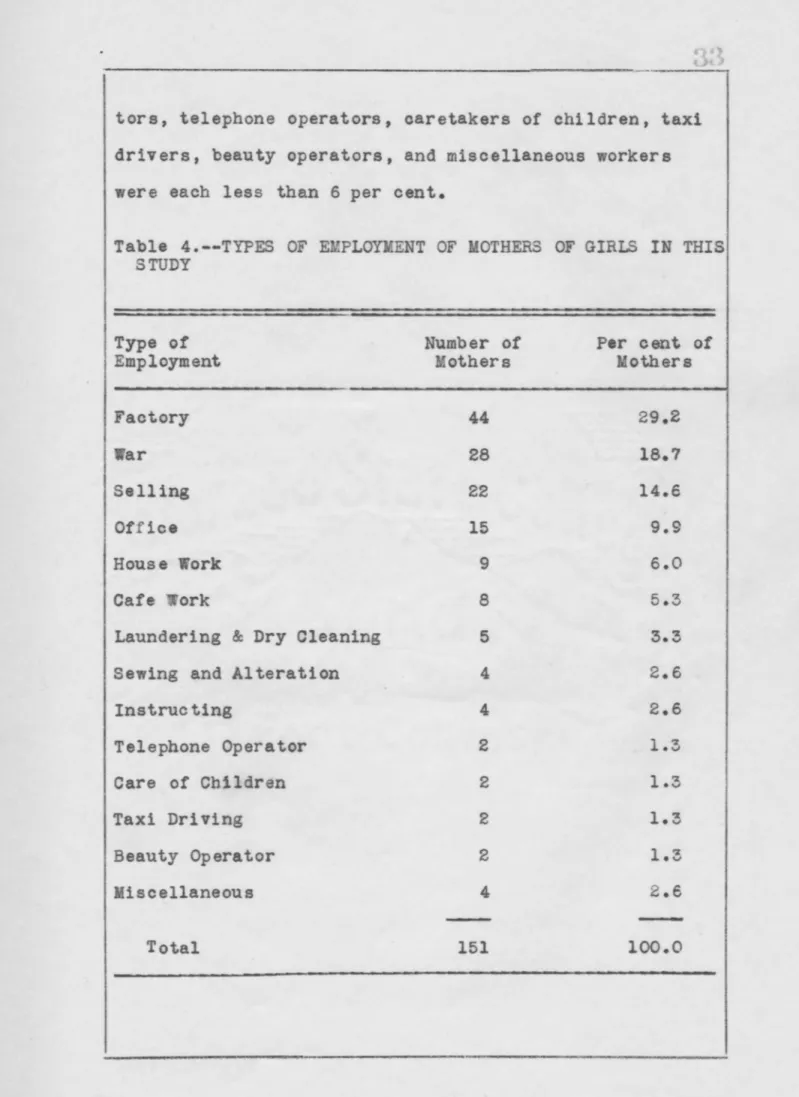
---The employment of the mothers as listed by the girls was classified under 14 different types. Four oc-cupations which were listed only once and which were not similar, were classified under miscellaneous (Table 5). Of the 151 working mothers the largest number were fac-tory workers, 29.1 per cent, and war workers, 18.7 per cent. There was no way of distinguishing whether any of the factory workers were really doing war work or not, or whether part of the war workers were doing factory work. The two groups combined composed a little less than one half of all the working mothers of the sample.
~alespeople and office workers came next in order of number. The other types, domestic employees, cafe work-ers, laundresses and dry cleanwork-ers, seamstresses, instruo·
:---·~
tors, telephone operators, caretakers of children, taxi drivers, beauty operators, and miscellaneous workers were each less than 6 per cent.
Table 4.--TYPES OF EMPLOYMENT OF MOTHERS OF GIRLS IN THIS STUDY
Type o! Number of Per cent of
Employment Mothers Mothers
Factory 44 29.2 War 28 18.7 Selling 22 14.6 Office 15 9.9 House Work 9 6.0 Cafe Work 8 5.3
Laundering &: Dry Cleaning 5 3.3
Sewing and Alteration 4 2.6
Instructing 4 2.6 Telephone Operator 2 1.3 Care of Children 2 1.3 Taxi Driving 2 1.3 Beauty Operator 2 1.3 Miscellaneous 4 2.6 Total 151 100.0
- "
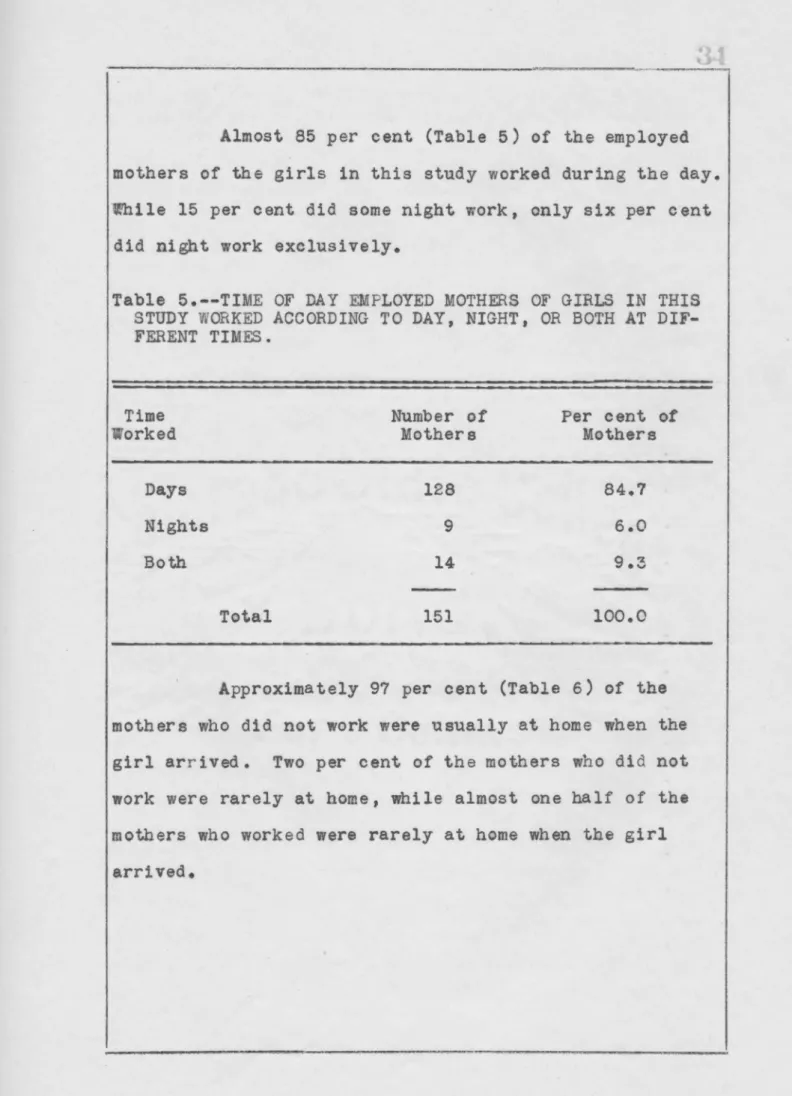
Almost 85 per cent (Table 5) of the employed mothers of the girls in this study worked during the day. U'hile 15 per cent did some night work, only six per cent
did night work exclusively.
Table 5.--TIME OF DAY EMPLOYED MOTHERS OF GIRLS IN THIS STUDY WORKED ACCORDING TO DAY, NIGHT, OR BOTH AT DIF-FERENT TIMES.
Time Number of Per cent of
Worked Mothers Mothers
Days 128 84.7
Nights 9 6.0
Both 14 9.3
Tot.al 151 100.0
Approximately 97 per cent (Table 6) of the mothers who did not work were usually at home when the girl arrived. Two per cent of the mothers who did not work were rarely at home, while almost one half of the mothers who worked were rarely at home when the girl arrived.
Table 6.--NUMBER OF MafHERS OF SAMPLE AT HOME WHEN GIRL ARRIVED ACCORDING TO EXPERIMENTAL GROUP AND CONTROL GRa.JP
Mother at Home Experimental Group Control Group When Girl
Arrives Number Per cent Number Per cent Frequently 55 36.4 146 96.7 Occasionally 25 16.6 2 1.3
Rarely 71 47.0 3 2.0
Total 151 100.0 151 100.,0
Differences in adjustment of the two groups.
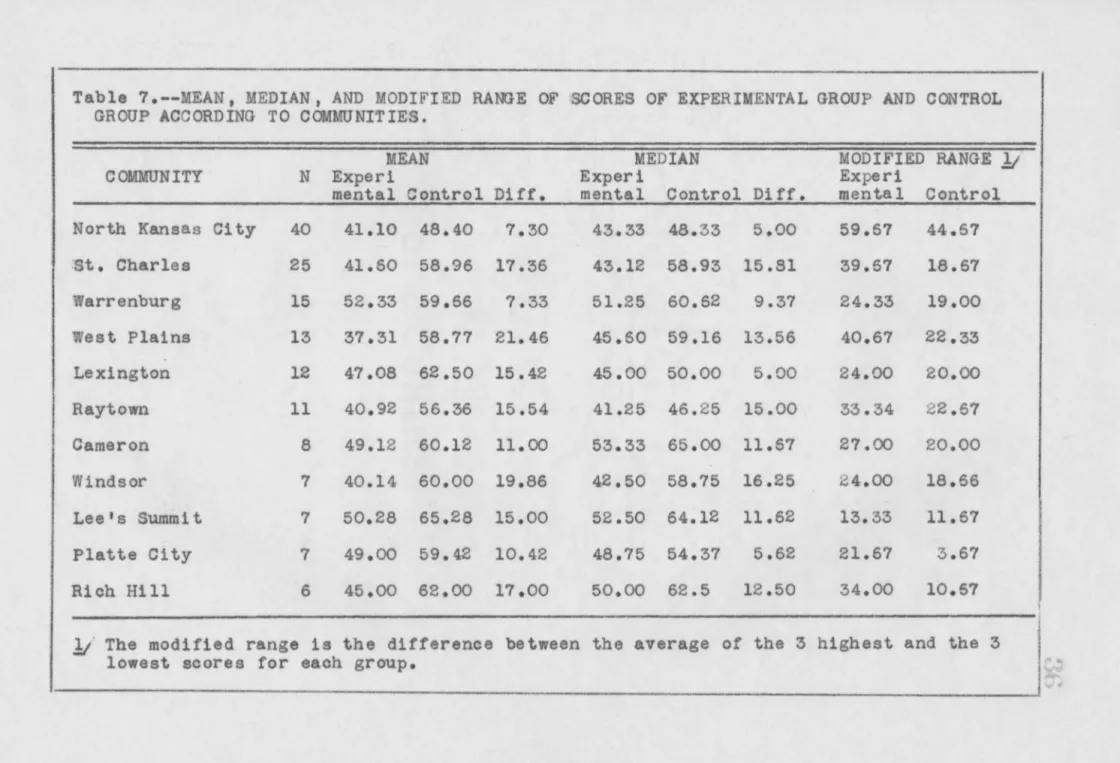
-The 11 school communities varied in the mean of average score on the family adjustment scale for each group. In each case, however, the control group scored higher than did the experimental group (Table 7). The difference of the means between the experimental and the control groups ranged from 21.46 points in the case of West Plains to only 7.10 points in the case of North
Kansas City. The median w~s higher in each of the sch~ for the control groups. The modified range, the differ-ence between the average of the three highest and the three lowest scores, was greater for the experimental group than for the control group for all the communities. Despite the small numbers from some of the school munities, these figures indicate that in all of the com-munities, the girls whose mothers did not work seemed better adjusted.
Table 7.--MEAN, MEDIAN, AND MODIFIED RANGE OF ·SCORES OF EXPERIMENTAL GROUP AND CONTROL GROUP ACCORDING TO COMMUNITIES.
MEAN MEDIAN MODIFIED RANGE
.!/
COMMUNITY N Experi Experi Ex peri
mental Control Diff. mental Control Diff. mental Control
North Kansas City 40 41.10 48.40 7.30 43.33 48.33 5.00 59.57 44.57
:st. Charles 25 41.60 58.96 17.36 43.12 58.93 15.81 39.67 18.67 Warren burg 15 52.33 59.66 7.33 51.25 60.62 9.37 24.33 19.00 West Plains 13 37.31 58.77 21.46 45.60 59.16 13.56 40.67 22.33 Lexington 12 47 .o8 62.50 15.42 45.00 50.00 5.00 24.00 20.00 Raytown 11 40.92 56.36 15.54 41.25 46.25 15.00 33.34 22.67 Cameron 8 49.12 60.12 11.00 53.33 65.00 11.57 27
.oo
20.00 Windsor 7 40.14 60.00 19.86 42.50 58.75 16.25 24.00 18.66 Lee's Summit 7 50.28 65.28 15.00 52.50 64.12 11.62 13.33 11.67 Platte City 7 49.00 59.42 10.42 48.75 54.37 5.62 21.67 3.67 Rich Hill 6 45.00 62.00 17.00 50.00 62.5 12.50 34.00 10.67l/
The modified range is the difference between the average of the 3 highest and the 3lowest scores for each group. ~.;
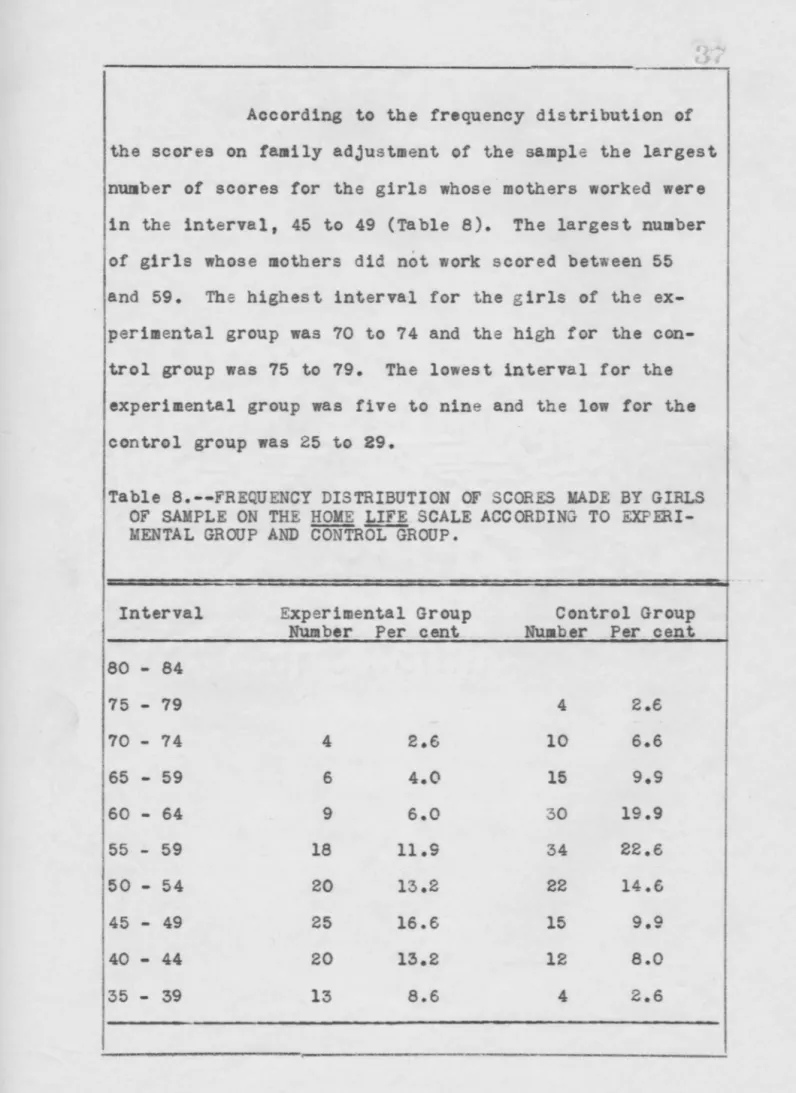
According to the frequency distribution of the scores on family adjustment of the sample the largest number of scores for the girls whose mothers worked were in the interval, 45 to 49 {Table 8). The largest number of girls whose mothers did not work scored between 55 and 59. The highest interval for the girls of the ex-perimental group was 70 to 74 and the high for the con-trol group was 75 to 79. The lowest interval for the experimental group was five to nine and the low for the control group was 25 to 29.
Table e.--FREQUENCY DISTRIBUTION OF SCORES MADE BY GIRLS OF SAMPLE ON THE HOME LIFE SCALE ACCORDING TO EXPERI-MENTAL GROUP AND Cc5NifROi:GROUP.
Interval Experimental Group Control Group Number Per cent Nu~ber Per cent 80 - 84 75 - 79 4 2.6 70 - 74 4 2.6 10 6.6 65 - 59 6 4.0 15 9.9 60 - 64 9 6.0 30 19.9 55 - 59 18 11.9 34 22.6 50 - 54 20 13.2 22 14.6 45 - 49 25 16.6 15 9.9 40 - 44 20 13.2 12 8.0 35 - 39 13 8.6 4 2.6 ~---~
Table a.--FREQUENCY DISTRIBUTION OF SCORES MADE BY GIRLS OF SAMPLE ON THE HOME LIFE SCALE ACCORDING TO EXPERI-MENTAL GROUP AND CONTRO:LiGROUP. (Continued).
Interval Experimental Group Control Group
Number Per cent Nura_ber Per cent
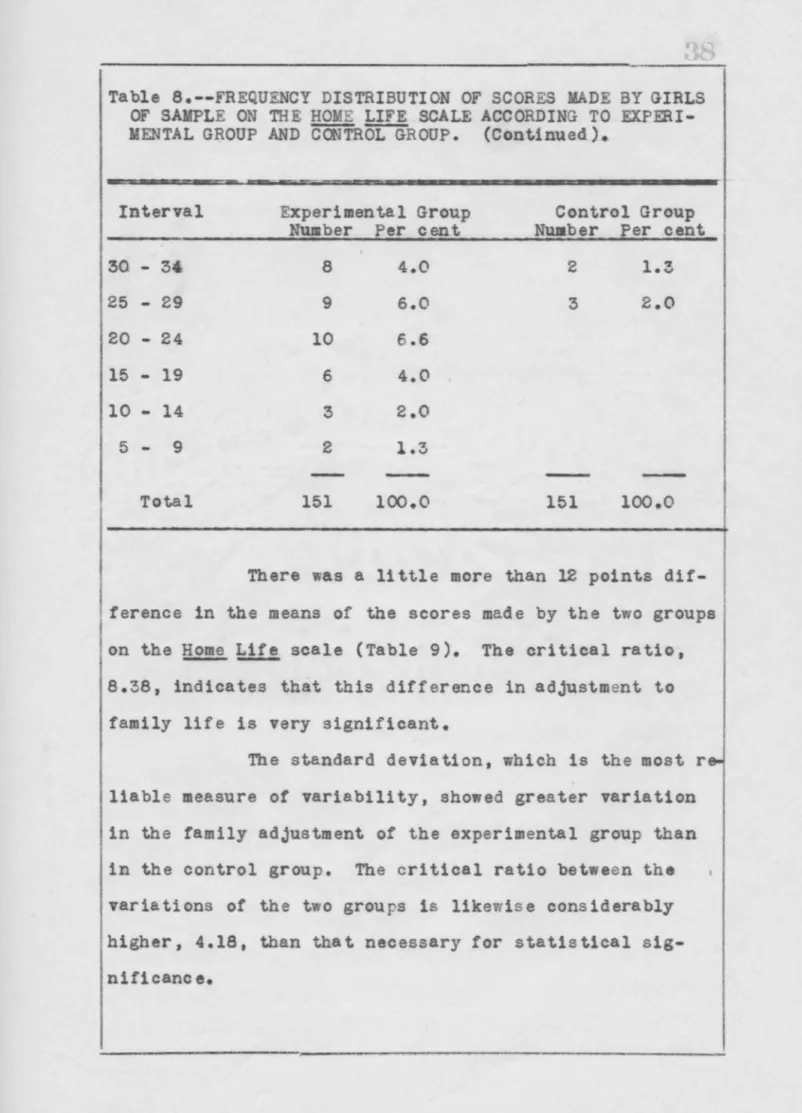
30 - 3~ 8 4.0 2 1.3 25 - 29 9 6.0 3 2.0 20 - 24 10 6.6 15 - 19 6 4.0 10 - 14 3 2.0 5 - 9 2 1.3 Total 151 100.0 151 100.0
There was a little more than 12 points dif-ference in the means of the scores made by the two groups
on the~~ scale (Table 9). The critical ratio,
8.38, indicates that this difference in adjustment to family life is very significant.
The standard deviation, which is the most r liable measure of variability, showed greater variation in the family adjustment of the experimental group than in the control group. The critical ratio between the variations of the two groups is likewise considerably higher, 4.18, than that necessary for statistical sig-nificance •
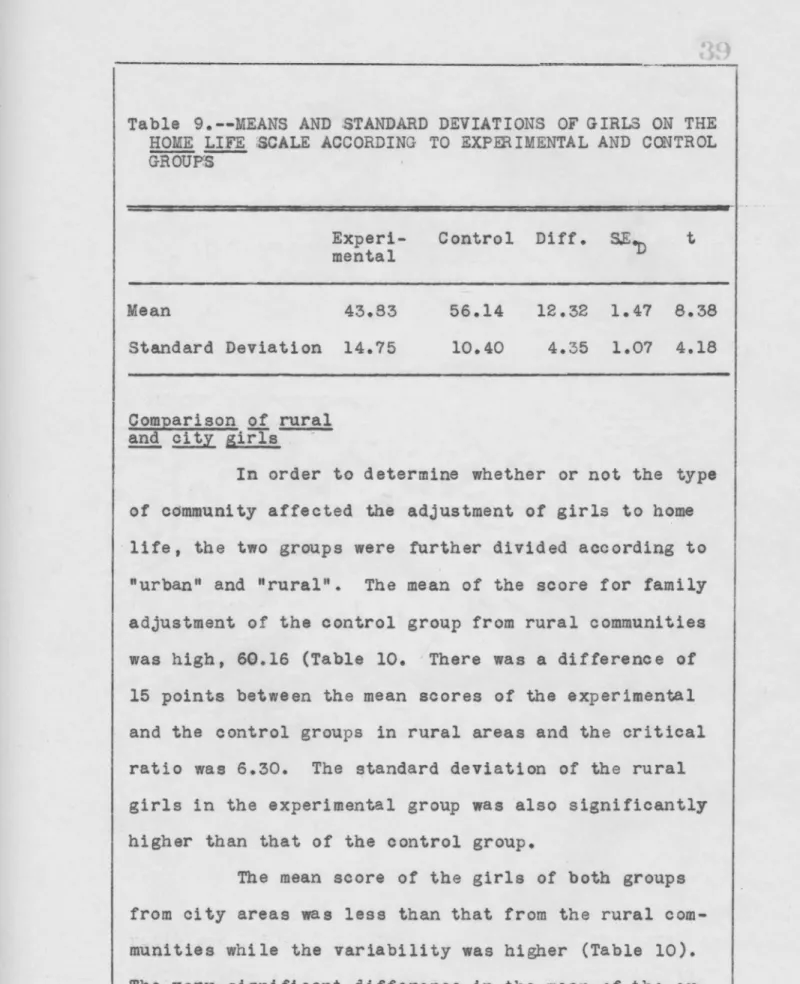
---Table 9.--MEANS AND .STANDARD DEVIATIONS OF GIRLS ON THE HOME ~ ;sCALE ACCORDING TO EXPERIMENTAL AND CONTROL GROUP$ Experi-mental Mean 43.83 Standard Deviation 14.75 Comparison of rural and city girls
-Control Diff.
s.E-n
t56.14 10.40
12.32 1.47 8.38 4.35 1.07 4.18
In order to determine whether or not the type of community affected the adjustment of girls to home life, the two groups were further divided according to "urban" and "rural". The mean of the score for family adjustment of the control group from rural communities was high, 60.16 (Table 10. There was a difference of 15 points between the mean scores of the experimental and the control groups in rural areas and the critical ratio was 6.30. The standard deviation of the rural girls in the experimental group was also significantly higher than that of the control group.
The mean score of the girls of both groups from city areas was less than that from the rural com-munities while the variability was higher (Table 10). The very significant difference in the mean of the ex-perimental and control groups of the city girls was
Table 10.--SIGNIFICANCE OF THE DIFFERENCES OF THE M~N AND THE STANDARD DEVIATION OF URBAN AND RURAL GIRLS OF THE SAMPLE ACCORDING TO EXPERIMENTAL AND CONTROL GROUPS.
URBAN RURAL
Experi Experi
mental Co~trol Diff. S.E. t mental CoHtrol Diff. S.E. t (N ... ll3) (N -113) D (N-38) (K -38) D
Means 43.51 54.?9 ' 11.28 1.74 6.48 44.90 60.16 15.26 2.42 6.30
Standard
Deviation 15.05 10 .. 70 4.35 1.22 3.56 13.60 8.25 5.35 1.82 2.94
I
Table 11.--SIGNIFICANCE OF THE DIFFERENCE OF THE MEAN AND STANDARD DEVIATION OF THE EXPERIMENTAL AND THE CONTROL GROUPS ACCORDING TO TYPE OF COMMUNITY ..
EXPERIMENTAL CONTROL
Urban Rural Diff. S.E. t Urban Rural Diff.
s.E.
tN-113 N-38 D N-113 N-38 D
Means 43.51 44.90 1.39 2.62 .35 54.79 60.16 5.37 1.67 3.22
'Standard
shown by a critical ratio of 6.48 and in the standard deviation by a critical ratio of 3.56.
Further grouping of the rural and urban girls according to the control and experimental groups showed
that the rural girls were higher in the mean score made on the family adjustment seale. There was no significant difference, however, between either the mean or the stan-dard deviation of the rural and urban girls of the ex-perimental group. There was a very significant
differ-ence in the urban and rural girls in the control group in their mean score as shown
qy
the critical ratio of 3.22 in favor of the rural girls, but the standard deviations showed no significant difference.Comparison of
!!£
groups ~ various items of ~Life SealeTo study further the responses of the items of the Home ~ scale they were ranked according to the largest number of favorable responses of each group. There was a tendency for the groups to be· fairly con-sistent in the ranking (Table 12) of their answers to 62 out of the 80 items on the scale, showing that the various items on the scale had the same relative impor-tance for each group although the percentage of favor-able responses was considerably higher in the control group than in the experimental group. The ranking ac-cording to the favorable responses showed that "Do you
Table 12.--RANK OF NUMBER OF POSITIVE RESPONSES OF GIRLS OF SAMPLE TO ITEMS ON FAMILY ADJUSTMENT ACCORDING TO EXPERIMENTAL GROUP AND CONTROL GROUP.
Positive Responses Positive Responses
Item E~perimental Groups Control Group
Num Per Rank Num Per Rank
ber cent ber cent
30. Do you feel that your father
likes you? 121 80.1 7 147 97.4 1
44. Is your mother at home when
you get home from school? 60 39.7 63.5 145 96.0 2
29: Do you feel that your mother
likes you? 137 90.7 1 144 95.3 3.5
7
/
Is your mother a good sport? 128 84.8 3 144 95.3 3.575. Do you think that either of your parents hold grudges
against you? 107 70.9 17.5 143 94.7 5
73. Do you get disgusted with the
way your mother acts in public? 122 80.8 6 141 93.4 6.5
72. Do you get disgusted v~ith the
way your father acts in public? 105 60.5 29.5 141 93.4 6.5
-Table 12.--RANK OF NUMBER OF POSITIVE RESPONSES OF GIRLS OF SAMPLE TO ITEMS ON FAMILY ADJUSTMENT ACCORDING TO EXPERIMENTAL GROUP AND CONTROL GROUP. (Continued).
Positive Responses Positive Responses
I
Experimental Group Control GroupItem Num Per Rank Num Per Rank
ber cent ber cent
j -·
---~~--~~~---~---~~---1. Is meal time a happy time in your family?
39. Do your parents trust you to be-have when you are away from home?
80.v When you are in trouble, can you depend upon your parents being
loyal to you?
6. Is your father a good sport? 25 • .1 Do you think your mother gives
pretty sound advice?
27. Do you try out what your parents advise?
32. Do either of your parents read your personal mail without your permission? 130 119 125 115 118 80 112 86.1 78.8 82.8 76.1 78.1 53.0 74.2 2 140 140 '4 137 10 137 9 136 41 130 14 130 92.7 92.7 90.7 90.7 90.1 68.2 86.1 8.5 8.5 10.5 10.5 12 13 15
Table 12.--RANK OF NUMBER OF POSITIVE RESPONSES OF GIRLS OF SAMPLE TO ITEMS ON FAMILY ADJUSTMENT ACCORDING TO EXPERIMENTAL GROUP AND CONTROL GROUP (Continued).
Positive Responses Positive Responses
Item Experimental Group Control Group
Num Per Rank Num Per Rank
ber cent ber cent
~---
-
-15. Do you leave the place without telling anyone where you are
going·t 112 74.2 14 130 86.1 15
20. Does your mother like to listen to what you tell her
when you get home from school( 103 68.2 23 130 86.1 15
36. Is your father too busy to pay
any attention to the farnily·t 102 67.5 24.5 130 86.1 15
26. Do you think your father gives
pretty sound advice't 106 70.2 19 129 85.4 17
42/ Do the members of your family openly express by work or action,
their affection for one anothert 124 82.1 5 128 84.8 19.5
46. Do your parents allow you to
"act your aget" 109 72.1 16 128 84.8 19.5
68. Do your parents like to have
Table 12.--RANK OF NUMBER OF POSITIVE RESPONSES OF GIRLS OF SAMPLE TO ITEMS ON FAMILY ADJUSTMENT ACCORDING TO EXPERIMENTAL GR<lJP AND CONTROL GROUP (Continued)
~
-~
Positive Responses Positive Responses
Item Experimental Group Control Group
Num
Per Rank Num Per Rankber cent
---
ber centI
78. Does your father nag and scold·t 83 55.0 37 128 84.8 19.5
63. Do other parents seem to like their children better than yours
like you t 113 74.8 11.5 127 84.1 22.5
i
70. Do you think your parents areI
stingy in not giving you morel
' 3. Are birthdays specialspending moneyt .days in 112 74.2 14 127 84.1 22.5your family t 113 74.8 11.5 124 82.1 24.5
62. Are your friends uncomfortable
around your parents¥ 105 69.5 20.5 124 82.1 24.5
67. Do either of your parents do things that make them appear
foolish·t 104 68.S 22 122 80.8 26
79. Do you celebrate the birthdays
Table 12.--RANK OF NUMBER OF POSITIVE RESPONSES OF GIRLS OF SAMPLE TO ITEMS ON FAMILY ADJUSTMENT ACCORDING TO EXPERIMENTAL GROUP AND CONTROL GROUP (Continued).
17. 54.
1
69.I
153.1
45.
1
12,
ItemDo you like to do extra little things to please the members of your tam i ly?
Do they help you to overcome your mistakes?
Does your family have good times together at home? Do your parents make fun of your mistakes?
Do you seem to get scolded for every little thing?
Do you "talk back" to your
father? ·
77. Does your mother nag and scold? 56. When yoru parents refuse to
allow you to do something do they s1 ve you a reason?
Positive Responses Experimental Group
Num Per Rank
ber cent 102 24.5 101 66.9 26.5 94 62.3 30 101 66.9 26.5 81 53.6 86 57.0 35 81 53.6 39.5 88 58.3 Positive Responses Control Group
Num Per Rank
ber cent 121 80.1 28.5 121 80.1 28.5 121 80.1 28.5 118 78.1 31.5 118 78.1 31.5 117 77.5 117 77.5 33.5 114 '> 64.4.) "" 35
Table 12.--RANK OF NUMBER OF POSITIVE RESPONSES OF GIRLS OF SAMPLE TO ITEMS ON FAMILY ADMUSTMENT ACCORDING TO EXPERIMENTAL GROUP AND CONTROL GROUP (Continued)
-
---·
Positive Responses Posl.ti v e Responses
Item Experimental Group Control Group
Null Per Rank Num Per Rank
ber cent ber cent
59. Does your family enjoy working
together·r 85 56.3 36 113 74.8 36
37. Do you think your family picks
on yQu·r 78 51.7 43.5 112 74.2 37
48. Do other young people seem to have more fun with their
famil-ies than you do with yours! 78 51.7 43.5 111 73.5 38.5
I 47 e Where your affairs are concern-ed, do you think "What my folks
don't know won't hurt themr" 66 43.7 46 111 73.5 38.5
65. Do your parents change their plans
to suit yours t 96 63.6 29 110 72.8 40.0
61. Do either of your parents
dis-approve of your friendsc 87 57.6 34 109 72.2 41.0 .
1
43. Does your mother attend the school programs and other school
Table 12.--RANK OF NUMBER OF POSITIVE RESPONSES OF GIRLS OF SAMPLE TO ITEMS ON FAMILY ADJUSTMENT ACCORDING TO EXPERIMENTAL GROUP AND CONTROL GROUP (Cantinued)
-:ttem
60. Are there times when some member of your family "won't speak" to another member?
34. Do you feel rebellious around your tam ily?
33. Do you let your parents in on your "big moments?"
9. Does your family talk over futur.e plans together?
58. Does every member in your family have "his say" in what the family does as a group?
19. Would you be more proud of your mother if she would change some
of her ways?
40. Does your father complain?
Positive Responses Experimental Group
Num Per Rank
ber cent 88 78 71 91 77 74 75 58.3 51.7 47
.o
60.3 51.0 49.0 49.7 32.5 43.5 53.5 31 47 50 49 Positive Responses Control GroupNum Per Rank
ber cent 106 106 104 104 103 103 101 70.2 70.2 6"8.9 68.9 68.2 68.2 66.9 43.5 43.5 45 46 48 48 50
I
Table 12.--RANK OF NUMBER OF POSITIVE RESPONSES OF GIRLS OF SAMPLE TO ITEMS ON FAMILYI
ADJUSTMENT ACCCRDING TO EXPERIMENTAL GROUP AND CONTROL GROUP (Continued)Positive Responses Positive Responses
Item Experimental Group Control Group
Num Per Rank Num Per Rank
ber cent ber cent
5. Is your family breakfast a
gloomy affair? 70 46.4 5.55 100 66.2 51
49. Would your parents make fun of you if you told them about your
pet peeves? 77 51.0 47 99 65.6 52
18. Would you be more proud of your father if he would change some
of his ways? 62 41.1 61 98 64.9 53
11. Do your parents ever admit they
have been wrong? 72 47.7 51.1 97 64.2 54
22. Does your mother resent it when
you disagree with her? 60 39.7 63.5 94 64.3 55
13. Do you "talk back" to your mother? 72 47.7 51.1 89 58.9 57.5
76. Do you like to spend long winter i
evenings with your family group? 63 41.7 60 89 58.9 57.5 I
Table 12 .--RANK OF NUMBER OF PCSITIVE RESPONSES OF GIRLS OF SAMPLF. TO ITEMS ON FAMILY ADJUSTMENT ACCORDING TO EXPERIMENTAL GRCUP AND CONTROL GROUP {Continued).
Item
Positive Responses Experimental Group
Num Per Rank
ber cent
51. Are you told to keep still when
you try to argue with your rather? 44
52. Are you told to keep still when you
try to argue with your mother? 45
24. Do you think "Oh what is the usel
after you have tried to explain
you conduct to your parents? 44
&.
Does it seem as if your familytreats you like a child? 51
41. Do your parents and you talk over
your future? 70
4. Does your father attend the school
programs and other school
«ti•it-ies in which you take part? 41
35.1 29.1_ 29.8 29.1 33.8 46.4 27.2 69 75.5 74.0 75.5 71 55.5 77.5 Positive Responses Control Group
Num Per Rank
ber cent 77 51.0 65.5 77 51.0 65.5 76 50.3 67.5 76 40.3 67.5 75 49.7 69 74 49.0 70 72 47.7 71
Table 12.--RANK OF NUMBER OF POSITIVE RESPONSES OF GIRLS OF SAMPLE TO ITEMS ON FAMILY ADJUSTMENT ACCORDING TO EXPERIMENTAL GROUP AND CONTROL GROUP (Continued)
Positive Responses Positive Responses
Item Experimental Group Control Group
Num Per Rank Num Per Rank
ber cent ber cent
50. Does your family go on little
hol-idays trips and picnics together? 48 31.6 72 68 45.0 72
14. Does your parents stay home be
cause they have so much work to do? 53 35.1 69 66 43.7 73 2. Do the members of your family
enjoy hobbies? 59 39.1 65 65 43.0 74.5
'28. Do you turn down chances to go out
I
with others in order to keep your appointment to do something with1
16.
your family? Do you hesitate to talk frankly 57 37.7 66.5 65 43.0 74.5 with your rather about personalTable 12.--RANK OF NUMBER OF POSITIVE RESPONSES OF GIRLS OF SAMPLE TO ITEMS ON FAMILY ADJUSTMENT ACCORDING TO EXPERIMENTAL GROUP AND CONTROL GROUP (Continued)
Item
66. Do you have more fun away from home than at home?
74. Do you go to shows, parties, or entertainments together as a family group?
64. Do you disagree with your mother?
55. Do your parents overlook your mistakes?
Positive Responses Experimental Group
Num Per Rank
ber cent 37 24.5 80 46 30.5 78 39 25.8 79 41 27.2 77.5 Positive Responses Control Group
Num Per Rank
ber cent.
60 39.7 77
58 38.4 78.5
58 38.4 78.5