l/TItetttZ
353A
19.90
Optimisation of the low beam
pattern of illumination.
Some experimenta/ results rela ted to the
illumination above the cut - off
Gabriel Helmers, Magnus Fernlun d and
Una Ytterbom
Statens va'g- och trafikinstitut lVT!) 0 581 0 1 Linképing
l/TIran"
353A
1.990
Optimisation of the low beam
pattern af illumination.
Some experimenta/ results re/a ted to the
illumination above the cut - off
Gabriel Helmers, Magnus Fernlund and
Uno Ytterb0m
(db
Vag- 06/)
Statens va'g- och trafikinstitut (v71; - 581 0 1 Linkb'ping
t Swedish Road and Traffic Research Institute 0 8-58 1 0 1 Linkb'ping Sweden
PREFACE
The research work presented in this report was sponsored by the Swedish Road Safety Office. Mr L. Fremling initiated the project as the question of low beam harmonisation had been on the agenda of the meetings in ECE/GRE.
The work on the report was sponsored by the Swedish Road and
Traffic Research Institute.
The Air Force base F13M has kindly put one of their taxi-ways at our disposal for the full scale experiments. Hella KG and Robo AB contributed with headlights for the experimental vehicles. Saab Car Division measured and documented the beam patterns of the headlights.
The authors are fully responsible for the report. Our colleague Mr S-O. Lundkvist contributed valuable information, viewpoints and criticisms of the draft. Mrs Christina Ruthger edited the report and corrected the English.
To all those, who have been involved, we direct our gratitude.
Linkoping, February, 1990. Gabriel Helmers
Magnus Fernlund Uno Ytterbom
CONTENTS Page ABSTRACT I SUMMARY II 1 BACKGROUND 1 2 PROBLEM 3 3 METHOD 3 4 EXPERIMENT l 7 4.1 Experimental varibles 7 4.2 Constant parameters 10 4.3 Experimental design 10 4.4 Subjects 10 4.5 Results 11 5 EXPERIMENT 2 15 5.1 Experimental variables 15 5.2 Constant parameters 17 5.3 Experimental design 17 5.4 Subjects 18 5.5 Results 18
6 CONCLUSIONS AND DISCUSSION 23
REFERENCES 25
APPENDICES 1-4
OPTIMISATION OF THE LOW BEAM PATTERN OF ILLUMINATION.
SOME EXPERIMENTAL RESULTS RELATED TO THE ILLUMINATION ABOVE THE
CUT-OFF.
by Gabriel Helmers, Magnus Fernlund and Uno Ytterbom
Swedish Road and Traffic Research Institute (VTI)
8-581 01 LINKCPING Sweden
ABSTRACT
Visibility distances to targets on the road have been measured in simulated full-scale opposing situations between two passenger cars on low beams. The level of low beam illumination above the cut-off was varied in four levels from half the normal
to four times the normal illumination of European (ECE) low beams.
The results show that the optimum (absolute) level of
illumination above the cut-off is related to the reflection properties of the visual targets. The most important parameter seems to be the relation between the level of illumination just above and just below the cut-off.
II
OPTIMISATION OF THE LOW BEAM.PATTERN OF ILLUMINATION.
SOME EXPERIMENTAL RESULTS RELATED TO THE ILLUMINATION ABOVE THE CUT-OFF.
by Gabriel Helmers, Magnus Fernlund and Uno Ytterbom
Swedish Road and Traffic Research Institute (VTI)
8-581 01 LINKOPING Sweden
SUMMARY
Visibility distances to targets on the road have been measured
in low beam illumination.
An experimental situation was arranged in the following way: An experimental vehicle with three subjects approached a stationary vehicle. The stationary vehicle simulated an opposing vehicle travelling in the opposite lane of a two-lane road. The roadway was level and straight and closed to traffic.
The only task of the subjects was todetect visual targets along the road and immediately after detection press a noiseless switch held in the hand. Visual targets were placed in the driv-ing lane at a lateral distance of about 0.7 m to the right of the experimental car when passing.
In the experiments these two vehicles had identical low beam lighting. The low beams were correctly aimed.
The basic low beam pattern was varied in three levels: 1) A normal ECE low beam, 2) the same low beam with a light flux re-duced to 50 per cent by a decrease in the voltage, 3) a poly-ellipsoid ECE low beam headlight. The latter headlight had a level of illwmination above cut-off comparable to that of the normal ECE low beam reduced to 50 per cent of its normal value.
III
In a couple of full-scale experiments the low beam intensity of light above the cut-off was varied in three levels: 1, 2 and 4 times the original or basic level of illumination by adding a homogeneous illumination above as well as below the cut-off. This additional light was supplied by a slide projector mounted between the headlights of each vehicle.
The results show that a homogeneous additional level of illu-mination above as well as below the cut-off reduces the visib-ility distances to non-reflectorised targets for each type of low beam headlights used in the experiments.
On the other hand, the variation in beam patterns shows that the relation between the level of illumination just above and below the cut-off seems to be of prime importance, rather than the
absolute level of illumination above the cut-off.
This result was valid for visual targets with mainly diffuse reflection properties ranging from black to light grey targets. Concerning retroreflectors, on the other hand, the absolute intensity of light above the cut-off was the most significant factor for the visibility distance.
1 BACKGROUND
During the last few years there has been a growing aspiration to reach a world-wide harmonisation of the beam pattern of low beam headlights. For a few years, this issue has also been on the agenda of international organisations and their working groups,
such as ECE/WP29/GRE, GTB and CIE/TC 4 10.
The prevailing situation necessitates increased knowledge of optimised low beam patterns in order to reach a satisfactory compromise on harmonisation. Research efforts are being made in the USA, in Japan and in some European countries in order to contribute to a better understanding of the underlying problems, thus creating a basis for future decisions on this issue.
Recent efforts in the USA and in Japan are directed towards spe-cifications of the illumination of realistic visual targets on the road in different directions in front of the vehicle (1),
(2), (3), (4). Independent research work has also been reported
from the USA and from Holland, in which desirable patterns of illumination of the low beam are proposed (5), (6).
The main consequence of the Dutch (6) work on the beam.pattern
would be a sharper (mainly horizontal) gradient of light or cut-off than that of the European low beam of today. On the other
hand, the consequences of the work done in the USA (5) would be
a gradient of light much in agreement with the more diffuse
American cut-off.
So there is very little agreement where the cut-off is concerned and an urgent need for better knowledge in order to create the common understanding which is necessary for a successful
harmo-nisation.
On the other hand, very little general knowledge is acquired by making simple comparisons of visibility distances measured from
headlights with different low beam patterns. The main reason is that low beam patterns differ in complex ways.
One possible way to overcome this difficulty is to add a well defined intensity of light into the area of interest of a spe-cific low beam pattern and then measure the effects on visib-ility introduced by this additional light. Another possible way is to evaluate different low beam patterns by computer simul-ations (7). The main advantage of the latter method is the simplicity with which the road geometry can be varied. On the other hand, the main difficulty is that the results from the
simulations must be validated in real situations.
Today there are two main sets of specifications for the low
beam, the American (SAE) and the European (ECE) regulations. The
main difference between the two sets is that the beam pattern of the European type has a sharper cut-off and weaker intensities of light above the cut-off than the American type of low beam. The sharp ECE cut-off is accepted by the SAE regulation, but the stronger level of illumination allowed above the horizon by the SAE is not accepted by the ECE regulation.
In the 19803 there has actually been a trend towards a sharper cut-off of the US produced low beam headlights. No such trend can be observed concerning the ECE headlights, even if modern production engineering facilitates the manufacture of a head-light with an even sharper cut-off of the ECE low beam. Con-sequently, there is already a general trend towards greater similarity between the beam patterns of the two regulations. What problems must then be solved in order to optimise the low beam pattern?
One problem is to optimise the cut-off or the vertical gradient of light around the cut-off. A second problem is to reduce the large variation in the aiming of the low beam (or the variation in the position of the cut-off in relation to a horizontal plane
through the headlights of vehicles in traffic). A third problem
is to optimise the horizontal design of the cut-off. A fourth problem is to find the optimal level of illumination above the cut-off. Certain results related to the latter problem are pre-sented in.this study.
In the debate on the European (ECE) and the American (SAE) beam
patterns it has been argued (from the European side) that the maximum level of illumination above the cut-off, specified in the ECE regulation, is an "optimum compromise" between two in-compatible demands: to minimise glare of opposing drivers and to maximise illumination of visual targets in the road scene.
2 PROBLEM
The aim of this study is to answer the following question:
- How is the visibility distance to roadside obstacles related to the level of illumination abgye the cut-off of an ECE low beam, in a situation where two vehicles with approximately identical beam patterns are approaching each other on a straight and level road.
3 METHOD
Visibility distances to targets positioned to the right in the driving lane were studied in 2 experiments. A vehicle with 3 subjects approached a stationary opposing vehicle on a straight
and level two-lane road without traffic.
The targets were positioned along the road at 4 fixed distances in front of the stationary vehicle. (For a reflectorised target 3 fixed distances were used).
The vehicles had identical beam patterns in each experimental run or approach. The beam patterns were varied between runs by adding homogeneous intensities of light or levels of
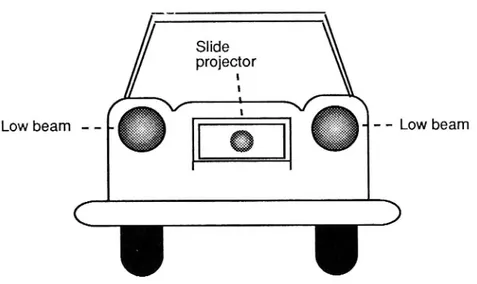
tion above as well as below the cut-off (Experiments 1 and 2) and also by changing the type of headlights and the voltage over the filaments (Experiment 2). The last type of change was made by means of a slide projector mounted on a firm stand at the same height, just between the headlights, in the median plane of
the cars. Shde projector I I | I
Low beam
- Low beam
Figure 1 Light sources of the experimental and the stationary vehicles
The level of illumination above the cut-off for each type of headlights was then changed in a number of steps by using slides of homogeneous neutral density. The change in the low beam patterns was kept under a high degree of control by adding the same level of illumination in the directions above as well as below the cut-off.
The experimental vehicle with 3 subjects was approached the sta-tionary vehicle in the opposite lane at a constant speed of 50
km/h.
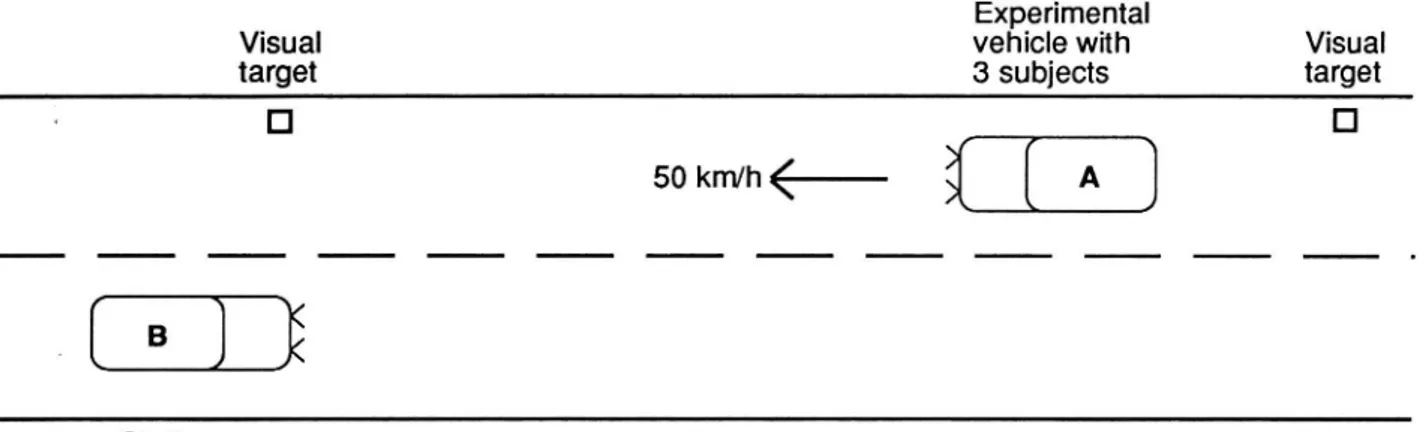
The visual targets were plane surfaces in the shape of a square with the sides 0.4 m. They were covered by woollen cloth with diffuse light reflection properties. These targets were placed
in an upright position. The layout of the experimental situation is shown in Figure 2.
Experimental
Visual vehicle with Visual target 3 subjects target
E] E]
50km/h<-
{ [ A ]
[8]]?
Stationary
vehicle
Figure 2 The opposing situation in the experiments
The subjects sole task was to press a noiseless switch held in the hand immediately after detection of each target. These responses were controlled by taking away one of the targets in a few runs. Thus the subjects could not be assured that the same number of targets would occur in every run.
Three "types" of headlights (H) were used in the experiments. They were denoted:
NORM Two conventional or nogmal ECE low beam headlights. HALF The two headlights above under-powered to half their
original level of illumination.
POLY Two ECE pglyellipsoid headlights.
With the notations below we can designate the system of head-lights and slide projector as: Beam Condition, BC = (H,Ea). As an example, the beam condition ECE normal headlights under-powered by 50 per cent and the illumination of 2 lux above
cut-off is denoted BC=(HALF,2).
NOtations
In the text below the following notations are used:
SL
CILa.
Visibility distance. Distance between target and experimental vehicle at the moment of detection of the target. Unit metres.
Luminance factor measured according to CIE 1931,
Standard Observer. Geometry of measurements 45°/0°.
Unit -.
Specific Luminance of the road surface in vehicle lighting measured at a simulated distance of 50 metres in front of the vehicle. Unit SL=(mcd/m2)/lux.
CIL-value (Coefficient of Luminance Intensity)
measured at the observation angle a minutes of a degree. Unit mcd/lux.
Illumination above the ECE low beam cut-off for the two low beam headlights of a vehicle. Measured at a distance of 25 metres in front of each headlight.
Unit lux.
Illumination below the ECE
two low beam headlights of
low beam cut off for the a vehicle. Measured at a distance of 25 metres in front of each headlight. Unit lux.
Target position. Distance along the road between a stationary opposing vehicle and the targets. Unit metres.
Type of headlights.
4 EXPERIMENT 1
The first experiment was of a somewhat explorative character. The main question this experiment was designed to answer was whether there is an interaction between the "brightness", or more correctly, the lwminance factor of the targets and the
level of illumination above the low beam cut-off.
In the case of no important interaction, just one luminance factor can be chosen for the targets in Experiment 2 without losing too much information or the possibility of generalising the results over the target luminance factors in Experiment 1.
4.1 Experimental variables
The mean luminance factor (p) for pedestrian clothing has been
proved to be about 0.07 (8). Much of the variation in the road environment can also be expected to lie within the range between the black and the light grey targets chosen for Experi-ment 1.(8)
Target conditions: The luminance factor (p) of the targets was
varied in 3 levels:
p = 0.18 (light grey targets) p = 0.07 (dark grey targets) p = 0.03 (black targets)
A fourth target condition was the black target equipped witha pedestrian retroreflector. This retroreflector was of the type often used in Sweden: a flat surface equipped with 3M High Intensity reflective material with an effective retroreflective
area of about 26 * 50 mm. (CIle, = 330 mcd/lux and CIL 20, =
230 mcd/lux).
Low beam conditions: The level of illumination above cut-off was varied in 3 steps. The basic condition was two correctly aimed ECE low beams (NORM) on each vehicle. In this condition the level of illumination above cut-off and in the direction towards an opposing driver (Ea) was 2 lux at a distance of 25 m. Consequently, this beam condition was designated (NORM,2).
The slide projector was then used to create two additional beam conditions. By using a neutral density filter, the level of illumination above as well as below cut-off was increased by 2
lux (at 25 m). This beam condition was thus designated (NORM,4).
By using the slide projector without any filter the level of
illumination above and below cut-off was increased by 6 lux (at 25 m). This beam condition was designated (NORM,8).
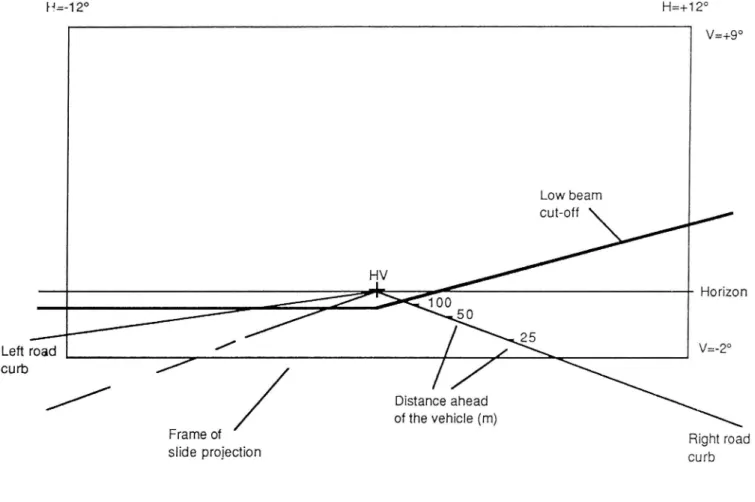
The exact values of illumination above cut-off in the direction
towards an opposing driver are shown in Appendix 1, table A. The optical axes of the slide projector coincided with the median plane of the vehicle. The illumination of the road by the headlights and the slide projector is shown in Figure 3.
14:42°
H=+12°
V=+9° Low beam cut-off / HV L Horizoni...
/
25
__ 0
Left road / / V" 2 curb / / / / Distance ahead of the vehicle (m)Frame of Right road slide projection curb
Figure 3 Illumination of the road scene. The frame shows the border of the projected light from the slide
pro-jector
Note that the consequence of adding constant levels of illumi-nation above as well as below the cut-off simultaneously decreases the relation between the levels of illumination above and below the cut-off: Ea/Eb.
Target positions: In each trial the longitudinal positions of
the targets were 0, 120, 240 and 340 metres in front of the
sta-tionary vehicle. For the target with the retroreflector, the distance of 340 metres was excluded due to excessive visibility distances in relation to the test track.
The first detected target in each run (the target at the farthest distance from the stationary vehicle) was regarded as the starting point for the subjects to concentrate on detecting
10
the remaining targets. The visibility distances to the first detected target in each run were thus excluded from the results.
4.2 Constant parameters
The targets were positioned on the right side of the driving lane. The lateral distance to the experimental vehicle at the moment of passing was about .7 metres. The lateral distance on the road between the experimental and the stationary vehicle was labout 2.0 metres.
Weather and road surface conditions: The atmosphere was clear and the road surface was dry during the experiment. The road surface had a median "brightness" compared to Swedish roads in general (SL=15 (mcd/m2)/lux).
4.3 Experimental design
The experimental design was factorial: all target levels (4) were combined with (3) beam conditions or levels of illumination
above cut-off, which made (4)*(3) = 12 experimental conditions.
The beam conditions were rotated according to the ABBA principle for each of the four targets. All experimental conditions were reproduced 4 times.
4.4 Subjects
The experiment was carried out during one night with three subjects seated in the experimental vehicle. The subjects were aged 22, 24 and 48. The two young subjects were students at the University of Linkoping, while the middle-aged subject was an employee at the Institute. The subjects were accepted after reporting their experienced vision as "normal".
11
4.5 Results
in illumination above the cut-off caused by the in the direction towards shorter The increase
slide projector mainly acts
visibility distances due to increased glare from the opposing
vehicle. The increase of the level of illumination below the in the opposite direction due to increased target in visibility distances caused by the cut-off -acts
luminances. Differences
combined use of the low beams and the projector should therefore be interpreted as an effect of a homogeneous level of
illumina-tion added above as well as below the cut-off.
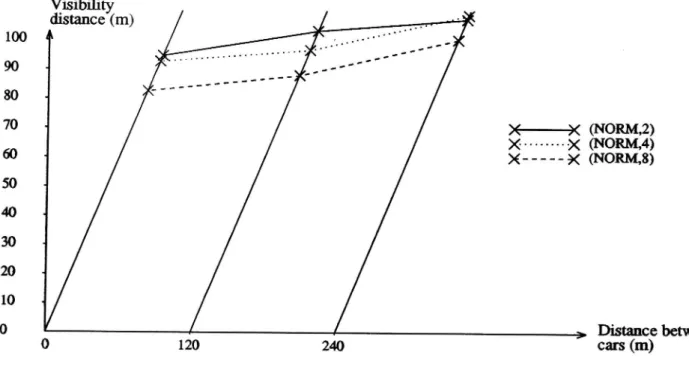
The visibility distances for the group of subjects are shown in Figures 4 - 7 and in Table 1 below. There is one figure for each of the four target conditions.
V nb y distance (m) .c.n o...-n ,- .-. v ' ' - ' 1 I I on. -aI ' '. . . a u c r ' ' " II ' "" v" -- u. -- -_ ' '-XE - -9<<TKHUKQ) >< ... 3K a ) X---)< (NORM,8) 120 Z&) can;0n)
Figure 4 Visibility distances to the light grey targets
VTI REPORT 353A
12 Visibility distance (m) 100 A 90 80 . . . .. . . - - ' 7O . I _ _ _ _ . e ' ' v. )6 ;< (NORA/1,2) _ , . . - - ' " )<Hn.ugx a u A)
5°
*
><---x (NORM,8)
50 4o 30 20 10 0 . . > Distance between 0 120 240 cars (m)Figgge 5 Visibility distances to the dark grey targets
Vm nhQr distance (m) 100 A 90 80
7°
x x (N0RM,2)
)< ... {X amgkmbg 60 . X---X (NORM,8) 50 '- . O __,4o
... '
30 20 10 0 . . ;> [ swmmetxxweeno
120
240
cars (m)
Figgge 6 Visibility distances to the black targets
300 270 240 210 180 150 120 30 13 V n q/ distance (m) A
>e
x (NORM,2)
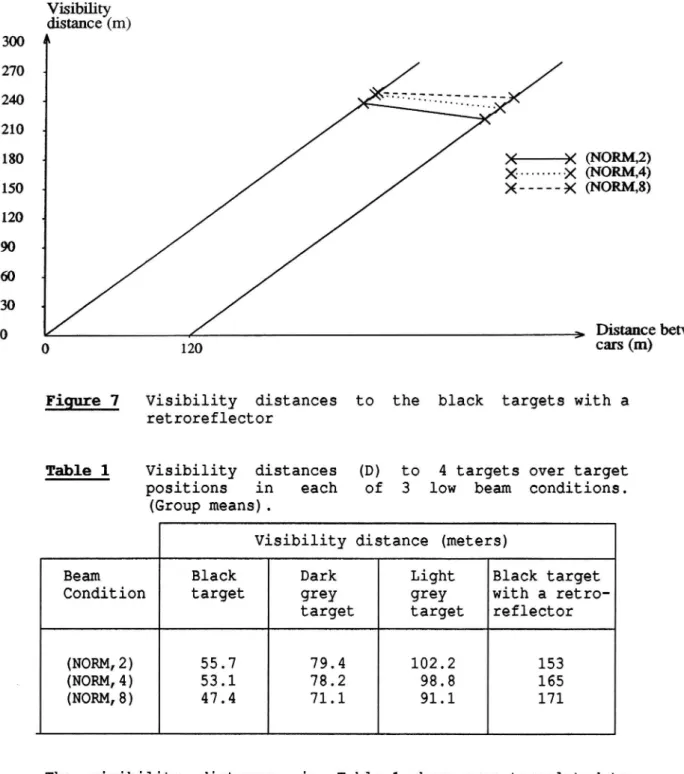
x. . . .X (NORM,4) X- -- -- x (NORM,8) I > Distance between 0 120 cars(nn)Figuge 7 Visibility distances to the black targets with a retroreflector
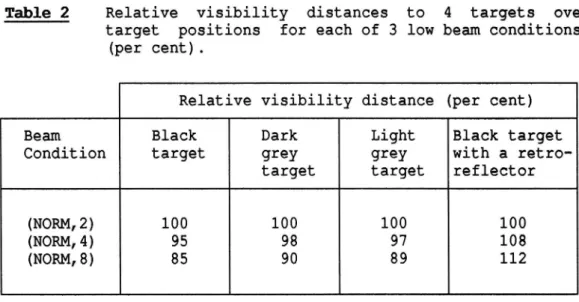
Table 1 Visibility distances (D) to 4 targets over target positions in each of 3 low beam conditions.
(Group means).
Visibility distance (meters)
Beam Black Dark Light Black target Condition target grey grey with a
retro-target target reflector
(NORM,2) 55.7 79.4 102.2 153
(NORM,4) 53.1 78.2 98.8 165
(NORM,8) 47.4 71. 91.1 171
The visibility distances
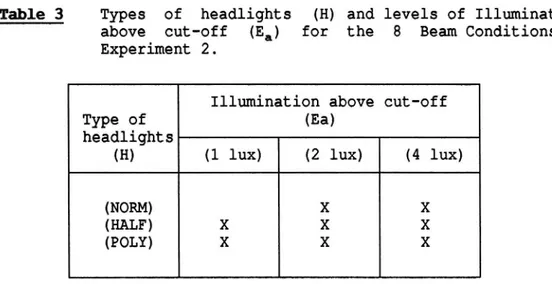
mean relative visibility distances
in Table 1 above were translated to
for each target shown in Table 2 below. The mean visibility distance for each target in the beam condition (NORM, 2) was appointed the value 100. Table 2 thus shows the changes in visibility distances for the remain-ing beam conditions in per cent of the basic condition.
l4
Table 2 Relative visibility distances to 4 targets over target positions for each of 3 low beam conditions.
(per cent).
Relative visibility distance (per cent) Beam Black Dark Light Black target Condition target grey grey with a
retro-target target reflector
(NORM,2) 100 100 100 100
(NORM,4) 95 98 97 108
(NORM,8) 85 9O 89 112
According to Tables 1 2 and Figures 4 - 6, there is a small but reliable reduction of the visibility distances over target positions to the black, the dark grey and the light grey targets when the level of illumination above the cut-off is increased by a factor of 2, (headlight condition (NORM,4)). This reduction is further pronounced when the level of illumination above the
cut-off is increased by a factor of 4, (headlight condition
(NORM,8)).
On the other hand, Tables 1 - 2 and Figure 7 show, that there is an increase in visibility distances to a black target with a retroreflector when the level of illumination above the cut-off is increased by a factor of 2 as well as by a factor of 4. In these headlight conditions the targets were discovered at long distances which means that they were exclusively illuminated by the light above the low beam cut-off at the moment of detection. These results show that there is a strong interaction between
types of targets (reflectorised vs. non-reflectorised targets)
and levels of illumination above cut-off. But is there also an interaction between the non-reflectorised targets and the levels of illumination above cut-off? An analysis of variance was carried out to answer this question. (See Appendix 3.)
The results of this analysis of variance show significant main effects for the level of Illumination above cut-off (E3), the
15
Luminance factor of the target (p) and the Position of the target (P), but there is no interaction between the Luminance
factor (p) and the level of Illumination above cut-off (Ea). The
consequence of this result is that one of the non-reflectorised targets can be chosen for Experiment 2 without losing much
information.
Concerning the total variance of the visibility distance data, 71 per cent is related to the variation of the target Luminance
factor (p), 7 per cent is related to the variation of the Posi-tion of the target (P) and finally 4 per cent is related to the variation of Illumination above cut-off (Ea).
5 EXPERIMENT 2
As a result of Experiment 1, the dark grey target was chosen for use in Experiment 2. (Luminance factor p = 0.07).
The choice of just one target in Experiment 2, permitted further variation of the beam conditions. The main reason for choosing several levels of the beam conditions is a desire to be able to generalise the results over types of low beam headlights.
5.1 Experimental variables
The results of Experiment 1 showed a general decrease in the visibility distances with an increase in the level of illumina-tion above the low beam cut-off where non-reflectorised targets were concerned. Consequently, it would not be very interesting to repeat the strongest level of illumination above cut-off (NORM,8) in Experiment 2 but to investigate the effect of a level of illumination above cut-off, which is lower than that of
a normal ECE low beam (NORM,2).
16
Three independent or experimental variables were chosen for Experiment 2:
Type of headlights (H)
- Illumination above cut-off (Ea)
- Target position (P)
Type of headlights: The headlight variable (H) was varied in 3 levels. The first level was the original ECE low beam headlights used in Experiment 1, operated with full voltage and designated (NORM). The second level was the same headlights under-powered to 50 per cent of their initial intensity, designated (HALF). The third level was ECE polyellipsoid low beam headlights with a
very sharp cut-off, designated (POLY).
By introducing a small reduction of voltage over the filaments the latter type of headlights (POLY) had approximately half the level of illumination above the cut-off, while the level of illumination just below the cut-off and in the direction towards the targets on the curb still was about 2 times stronger com-pared to the ordinary ECE low beam headlights (NORM). (See Appendix 1, Table A). The latter headlights under-powered to 50 per cent of their initial intensity (HALF) consequently had half the initial level of intensity above as well as below the cut-off.
By adding homogeneous intensities of light above as well as below the cut-off by the aid of the slide projector, 3 levels of Illumination above cut-off (Ea) were created.
Illumination above cut-off: The following levels of illumination above the cut-off were chosen for experiment 2: l lux (1/2 the
normal level), 2 lux (the normal level) and 4 lux (2 times the
normal level of illumination) for two conventional ECE low beam headlights.
17
Beam conditions: The combination of Type of headlights (3
levels) and Illumination above cut-off (3 levels) makes 8 Beam
Conditions according to Table 3 below.
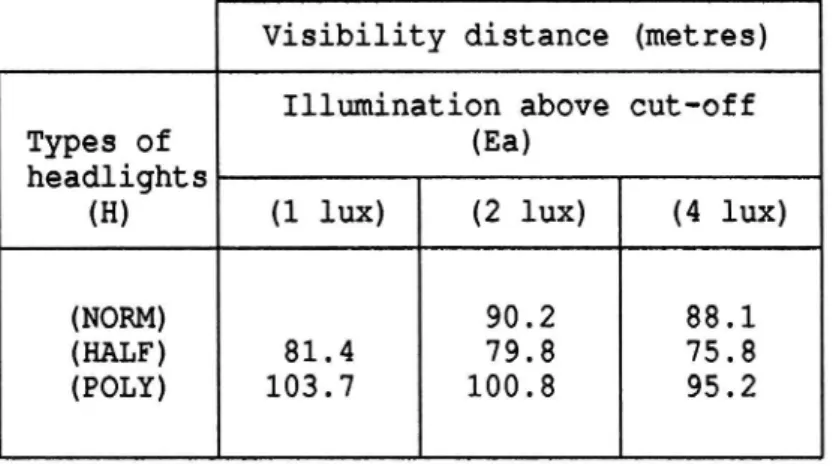
Table 3 Types of headlights (H) and levels of Illumination
above cut-off (Ea) for the 8 Beam Conditions in
Experiment 2.
Illumination above cut-off
Type of (Ea)
headlights
(H) (1 lux) (2 lux) (4 lux)
(NORM) X X
(HALF) X X X
(POLY) X X X
Target positions: The longitudinal distances to the targets in front of the stationary vehicle were 0, 140, 300 and 400 metres. The first detected target in each run (the target at the 400-metre distance from the stationary vehicle) was regarded as the starting point for the subjects to concentrate on detecting the remaining targets.
5.2 Constant parameters
The lateral distances between the targets and the vehicles, as
well as weather and road surface conditions, were identical to those of Experiment 1.
5.3 Experimental design
According to Table 3 above, there were 3 Types of headlights (H)
and 3 levels of Illumination above cut off (Ea). Ideally, there would be (3*3=) 9 combinations, but the headlight condition
18
(NORM) had a minimum level of illumination of 2 lux above
cut-off. So there are only 8 possible combinations or Beam
condi-tions.
All the (8) Beam conditions were randomised in each of 4 blocks
or replications for each group of subjects. The subjects were seated in the experimental car. The experiment was repeated 3 times (nights), each night with a new group of 3 subjects. Con-sequently, 9 subjects were engaged in the experiment.
As a consequence of the missing cell in Table 3 above, Experi-ment 2 had a factorial design which permitted two analyses of variance with (2)*(3) and (3)*(2) levels, respectively. (See
Table 3).
5.4 Subjects
The subjects were students at the University of Linkoping. Their ages were between 24 and 29. They were not subjected to any examination of vision. All of them had experienced their vision as "normal", with glasses if needed.
5.5 Results
The visibility distances to the dark grey targets for the group.
of 9 subjects are shown in Figures 8 - 11. There is one figure
for each Type of headlights and one Figure (Figure 11) where the visibility distances for all the three Types of headlights are shown. (See also Appendix 2).
100 80
8
8
20 10 100 80 70 50 30 20 10 VE nhqz distance (m) \ 19 )( -X (NORMJ) x. ... .x (NORMA) l> Distance betweeno
140
360
cars (In)
Figgge 8 Visibility distances to the dark grey targets for the normal low beam (NORM)
Visibility distance (m) A
""""' "
>< 9< (HALFJ)
>< ... .;( GLALFQ) X - - - X (HALFA) J . . > Distance between 0 140 300 can (111)FiggEe 9 Visibility distances to the dark grey targets for the under-powered normal low beam (HALF)
100 80 70 50 20 10 20 10 20
VE nhqr distance (In) _ . . . ..
4
LI".'.".'I.".".'.".:::
X__.9< (POLY,1) x. . . ..X (POLY,2) x--- -x (POLY,4) 1 v ' % Distance between 0 140 300 cm3(nnFiggre 10 Visibility distances to the dark grey targets for the poly-ellipsoide headlight (POLY)
Vm n qr distance (m)
A}
A____A (POLY,1)
A . . . A (POLY,2)A---A (POLY,4)
X____x (NORMJ) X. ... .x (NORMA) H (HALFJ) E] ... HE] (HALRZ).3- - - _ - g (HALFA)
I 1 > Distance between 0 140 300 <uus(n0relation between the low beams shown in Figures
Figgge 11 The 8-10
21
The visibility distances for the (dark grey) targets are shown over target positions in Table 4 below. In Table 5 the relative visibility distances for the 3 Types of headlights are shown for each level of Illumination above cut-off (Ea).
Table 4 Visibility distances to the dark grey targets over target positions for 8 Beam Conditions (BC = (H,Ea)) in Experiment 2. (Group means).
Visibility distance (metres) Illumination above cut-off
Types of (Ea)
headlights
(H) (1 lux) (2 lux) (4 lux)
(NORM) 90.2 88.1
(HALF) 81.4 79.8 75.8 (POLY) 103.7 100.8 95.2
Table 5 Relative visibility distances to the dark grey targets over target positions for each Type of headlights in Experiment 2. The level of Illumination above cut-off
(Ea=) 2 lux is regarded as a basic level (per cent).
Relative visibility distance Illumination above cut-off
Type of (Ea)
headlights
(H) (1 lux) (2 lux) (4 lux)
(NORM) 100 98
(HALF) 102 100 95
(POLY) 103 100 94
The visibility distances from Experiment 2 were analysed by two analyses of variance. See Appendix 3.
The main effects concerning Types of headlights (H) as well as
levels of Illumination above the cut-off (Ea) and Position of
targets (P) are significant. There are also a couple of signi-ficant interactions.
22
How important are the significant effects? Type of headlights (H) explains 41 and 35 per cent, Position of the targets (P) explains 4 and 6 per cent and Light above cut-off (Ea) explains 3 and 2 per cent of the total variance in the two analyses. The significant interactions are not very interesting because of their small explanation values. Less than .5 per cent of the total variance of the material is related to each of these
interactions.
The results of Experiment 1 are also repeated in Experiment 2: A homogeneous additional illumination above as well as below the cut-off (of two ECE low beam headlights) will decrease the visi-bility distance to non-reflectorised targets on the road when two vehicles in an opposing situation have approximately iden-tical beam patterns.
Experiment 2 also shows, that the results of Experiment 1 can be generalised over types of (ECE) low beam headlights and that the effect also is valid for half the normal level of illumination
above the cut-off.
On the other hand, the analyses of variance (Appendix 3) and Figure 11 show that Type of headlights has a strong influence on the visibility distances to non-reflectorised targets independ-ently of the levels of Illumination above the cut-off. The poly-ellipsoid headlights with a very sharp cut-off and strong
inten-sities of light just below the cut-off (POLY) showed
signific-antly superior visibility distances compared to the normal head-lights (NORM), while the latter type of headlights (NORM) also were significantly superior to the same headlights when under-powered (HALF). (See Appendix 4).
All these results are valid for the conditions under
considera-tion which include straight and level roads and correct low beam aiming.
23
CONCLUSIONS AND DISCUSSION
The consequences of the main results of the study are as follows:
- Pedestrians without retroreflectors are detected at farther distances when the level of illumination above the low beam
cut-off of two opposing vehicles is as low as possible (in the range 1 - 8 lux measured at a distance of 25 metres).
- The opposite is valid for pedestrians with retroreflectors: The distance of detection will be increased when the level of illumination above the low beam cut-off of two opposing vehicles is as high as possible (in the range 1 - 8 lux at a distance of 25 metres).
On the other hand, the study has also shown the importance of the level of illumination just below the low beam cut-off in the direction towards a pedestrian without a retroreflector. The higher the intensity of light below the cut-off, the longer the visibility distance.
The consequence of these results is that the absolute level of intensity above as well as below the cut-off should not be a critical parameter in the design of low beam patterns. The cri-tical parameter seems to be the relation between the levels of illumination below and above the cut off: Eb/Ea. This relation should be as large as possible.
From the harmonisation point of view, the problem is to create low beam patterns with as large a relative difference as pos-sible between the level of illumination directed towards the eyes of opposing drivers and that directed towards visual targets on the road. The absolute level of illumination above
cut-off (within the ranges used in these experiments) does not
seem to be very important. These results and Conclusions support the proposals recently made by de Brabander (9) for passing beam harmonisation based on a Belgian Standard.
24
Finally, we must keep in mind that harmonisation and optimisa-tion of the low beam pattern is just one step forward towards improved conditions of visibility in night-time driving. Good low beam patterns imply correct aiming of the headlights in order to create the best possible conditions of visibility. Har-monised and optimised low beam patterns should therefore be com-bined with qualities of the vehicle which will guarantee correct aiming of the headlights. These improvements should be intro-duced today.
Further improvements are needed for the future. One possibility would be to make the aiming system adaptive in relation to changes in the road geometry in front of the vehicle. The driv-ing lane could then be sufficiently illuminated at large dist-ances in front of the vehicle without glare to drivers in the opposite lane.
25
REFERENCES D
1. Burgett, A. (1986): "Presentation to the Small Group on Development of a World-wide Uniform Passing Beam Pattern of the Group of Rapporteurs on Light-Signaling (GRE)". Mimeo-graphed report and Appendices, NHTSA, US Department of Transportation.
Federal Register / Vol. 54, No. 88 / Tuesday, May 9, 1989 / Rules and Regulations, pp 20084 - 20091.
Ministry of Transport (1987): "Research on Headlamp Passing Beams", Tokyo, Japan.
Kitagawa, M. & Jin, M. (1989): "Research in
Japan on the Photometric Design Guidelines of Headlamp Passing Beams". Summary report to GRE (Question A/34), Japan Automobile Research Institute, Inc.
Taniguchi, M,
Olson, P.L. & Sivak, M. (1983): "Improved Low Beam
Photo-metrics", Interim Report, DOT HS-806-487, NHTSA, US Depart-ment of Transportation.
Padmos, P. & Alferdinck, J.W.A.M. (1988): "Optimale
Licht-sterkteverdeling van de Gedimed Autokoplamp", Institute for
perception TNO, Soesterberg, Holland.
Bhise, V.B. et a1 (1977): "Modeling Vision with Headlights in a Systems Context", SAE paper 770238.
Hansen,X E. & Larsen, J.S. (1979): Reflection factors for
pedestrien s clothing. Lighting Research & Technology, Vol.11, No.3, pp 154-157.
de Brabander, L. (1990): "The Belgian Standard NBN L
20-001: a step towards passing beam harmonisation". Paper to GRE informal meeting 8-9 Jan. 90. Institut Belge pour la Sécurité Routiere a.s.b.l.
APPENDIX 1
LEVEL OF ILLUMINATION ABOVE CUT OFF (Ea) .
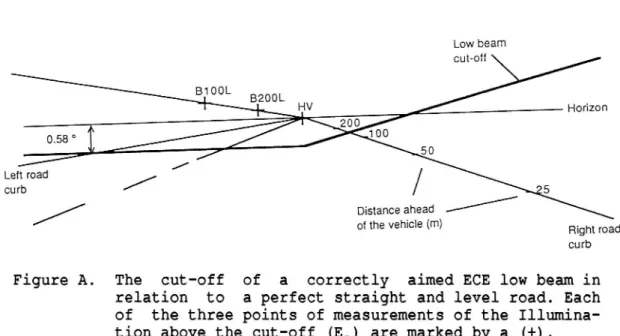
The low beam level of illumination above the cut-off (Ea) was measured in the points B100L, BZOOL and HV shown by Figure A below. B100L and BZOOL represent the position of the eyes of an opposing driver at a distance of 100 m and 200 m, respectively. HV is a point at the horizon and represents the position of the eyes of an opposing driver at long distances.
Low beam cut-01f 8100L
B2OOL . Honzon 0.58 ° 4\ / Left road curb
/ Distance ahead /of the vehicle (m)
Right road cu rb
Figure A. The cut-off of a correctly aimed ECE low beam in relation to a perfect straight and level road. Each of the three points of measurements of the
Illumina-tion above the cut-off (Ea) are marked by a (+).
Measurements of illumination (lux) were made for each individual
headlight unit (2 units per vehicle). The Illumination above
cut-off (Ea) at a distance of 25 m is defined as: EBlOOL + Enzoor + Env
APPENDIX 1
Values of E3
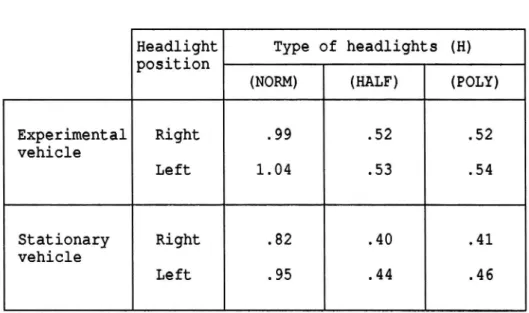
Values of E3 for each individual headlight of the three basic Beam Conditions are presented in Table A below.
Table A. Illumination above cut-off (Ea), measured in lux at a
distance of 25 m for Type of headlights in Experiment 1 and 2.
Headlight Type of headlights (H) position
(NORM) (HALF) (POLY)
Experimental Right .99 .52 .52 vehicle Left 1.04 .53 .54 Stationary Right .82 .40 .41 vehicle Left .95 .44 .46
Additional illumination above cut-off.
A slide projector mounted at the front of each vehicle was used to add homogeneous levels of illumination above as well as below the cut off.
By using a diaphragm and neutral density filters illuminations corresponding to 2 and 4 times the original intensities of light
above the cut-off were created for each vehicle.
APPENDIX 2
MEEN VISIBILITY DISTANCES FOR THREE TARGET POSITIONS IN
EXPERIMENT 2. (Group means).
The basic visibility distances data for Figures 8 - 11 are shown in Table B below.
The Target position (P) is the longitudinal distance (in metres) between each target and the stationary vehicle.
The Types of headlights (H) are NORM, HALF and POLY, described
in the main text of the report. The levels of Illumination (Ea) are 1, 2 and 4 lux, where Ea is the level of illumination above cut-off. '
Table B. Mean visibility distances (metres) to a dark grey
target for three Target positions (P) and eight Beam Conditions
(BC = H,Ea). (Group means).
Illumination above cut-off
Target Type of (Ea)
position headlights
(P) (H) (1 lux) (2 lux) (4 lux)
0 (NORM) - 86.1 84.6 (HALF) 77.5 75.4 69.9 (POLY) 99.1 96.1 89.6 140 (NORM) - 91.0 89.9 (HALF) 81.8 81.0 76.8 (POLY) 106.6 104.1 96.6 300 (NORM) - 93.4 89.7 (HALF) 85.0 82.8 80.9 (POLY) 105.5 102.3 99.4
APPENDIX 3
ANALYSIS OF VARIANCE
The design used in these analyses is the so called within-sub-ject-design. (See Keppel, G: Design & Analysis. A Researcher s
Handbook. Chapter 16-19. Second edition, 1982). The design
considers the variation within subjects as well as the variation between subjects. The F-values are formed as:
MSE
MSSxE
where MSE is the mean square of the effect and MS3xE is the mean square of the interaction between subject and effect. The tests of significance were all carried out at the risk level of p<.05. The "omega square" value (m2) was also calculated for the effect of each independent variable. w? indicates the proportion of the
total variance of the dependent variable (visibility distance)
which can be explained by the variation in each independent variable. Consequently, m2 is a measure of the strength of an effect, while the F-value only states whether an effect can be explained by chance or not, within a chosen level of risk.
In the analyses of variance below, the variables and levels of variables were:
Variable denoted levels exp . no
Detection distance D dependent variable
Type of headlight H NORM (exp 1)
NORM HALF POLY
(exp 2)
Illumination above cut-off Ea 2 4 8 lux (exp 1)
1 2 4 lux (exp 2) Target position P 0 120 240 metres (exp 1) 0 140 300 metres (exp 2) Target luminance factor p 0.03 0.07 0.18 (exp 1)
0.07
(exp 2)
APPENDIX 3
Experiment 1
One 3-factor analysis was carried out with the following
inde-pendent variables: (Target luminance factor)*(Illumination above cut-off)*(Target position); and with the following levels:
(3)*(3)*(3) respectively.
The following results were obtained:
D.F. F-value sign. wz
Target luminance factor (p): (2,4) 11.1 p<.001 .71 Illumu above cut-off (Ea): (2,4) 102,0 p<.001 .04 Target position (P): (2,4) 107.6 p<.001 .07 Interaction (p*Ea): (4,8) 0.2 .00 Interaction (p*P): (4,8) 1.4 .00 Interaction (Ea*P): (4,8) 2.8 .00 Interaction (p*Ea*P) (8,16) 1.4 .00
All main effects and no interactions were significant.
Experiment 2
Since there are no data in the first cell of Tables C and D
below, two 3-factor-ana1yses were carried out. In both analyses
the independent variables were: (Type of
headlights)*(Illumi-nation above cut-off)*(Target position).
Analysis no1.
The first analysis of variance had the following levels: (2)*(3)*(3).
APPENDIX 3
Table C. Beam Conditions (BC) in the first analysis of variance are marked with X-es without brackets.
BC = (H)*(Ea) = (2)*(3) levels.
Illumination above cut-off
Type of (Ea)
headlights
(H) (1 lux) (2 lux) (4 lux)
(NORM) , - (X) (X)
(HALF) X X X
(POLY) x x x
The following results were obtained:
D.F. F-value sign. wz
Type of headlights (H): (1,8) 592.6 p<.001 .41 Illum. above cut-off (Ea): (2,16) 20.4 p<.001 .03 Position of target (P): (2,16) 37.8 p<.001 .04 Interaction (H*Ea): (2,16) 1.6 .00
Interaction (H*P): (2,16) 2.2 .00
Interaction (Ea*P): (4,32) 3.3 p<.025 .00 Interaction (H*Ea*P): (4,32) 0 5 .00
The result of the analysis showed significant main effects for Type of headlights (H), Illumination above cut-off (Ea) and Position of target (P). There was one significant interaction, the one between Illumination above cut-off and Position of
target (Ea*P).
Type of headlights (H) explains 41 per cent, Light above cut-off (Ea) 3 per cent and Position of target (P) 4 per cent while the
significant interaction (Ea*P) explains less than .5 per cent of the total variance in the data.
APPENDIX 3
Analysis no 2.
The second analysis of variance had the following levels: (3)*(2)*(3).
Table D. Beam Conditions (BC) in the second analysis of variance are marked with X-es without brackets.
BC = (H)*(Ea) = (3)*(2) levels.
Illumination above cut-off Type of (Ea)
headlights
(H) (1 lux) (2 lux) (4 lux)
(NORM) - X X
(HALF) (X) X X
(POLY) (X) X X
The following results were obtained:
D.F. F-value sign. w?
Type of headlights (H): (2,16) 435.1 p<.001 .35
Illum. above cut-off (Ea): (1,8) 38.6 p<.001 .02
Position of target (P): (2,16) 30.2 p<.001 .06
Interaction (H*Ea): (2,16) 1.8 .00 Interaction (H*P): (4,32) 1.3 .00 Interaction (Ea*P): (2,16) 1.6 .00 Interaction (H*Ea*P): (4,32) 2 9 p<.05 .00
The main results of the first analysis were repeated in the second analysis: All main effects were significant (Type of
headlights (H), Illumination above cut-off (Ea), Position of
target (P)). The 3-factor interaction (H*Ea*P) was also
significant.
APPENDIX 3
Type of headlights (H) explained 35 per cent, Illumination above
cut-off (Ea) 2 per cent and Position of target (P) 6 per cent
while the significant 3-factor interaction (H*Ea*P) explained less than 0.5 per cent of the total variance.
The size of the omega square values (m2) for Type of headlights indicated a very strong effect of this parameter in both experiments. Tukey tests showed significant (p<.05) differences for each pair of Type of headlights in both analyses. (See Keppel p. 155).
APPENDIX 4
R?
2 CEE
7 22 SI 81 U 91 SI {7 1 BI 81 H 81 6 8 d 9 S b E 2 I A I 2-E b S 9 b- B-8 ~E l l -I I -Z I E l ~b I S I -S I d I B I -E I -B B -C.) 81 --CD 11 -B I 8.. .. 8. .. £ 9 -S f , E. .. a . X I H 2 E :5 t7 :9 :d S 9 :g 9 :1, A 8 2 =1 B b ' E I E D H L W O A [ P 3 ] S B H W H A . L H D I W 'S BN II H W B U N U D O S I A N D H U = 3 N H N B W I J 83 9" ? iL NB BE JF D 8 5 ¢ : wl / d D S N GE LL HE J B S ' I -: [ B B P J A b H E dA LB I HE I NU LL HH l I OB J. B B I S b S B B ' Z =[ 59 F3 1X CI LS " O N E 1 7 0 8 . L N B N L B H d B U N O I L U H T H A B G N U i N B N d O B A B U "I HD IB LD BI E E ' éB S b I : p O / X U N I E Z ' S B ' B B / A N D B H = N O I L H D I J I L N 3 C I I N O I S I A I U B U D B H H SAPPENDIX 4 (POLY,1) BC: .\' t3) 5.) T} 8 3 8 9 1 @ 8 8 8 1 8 52 9 2 2 89 B B S ? 8 8 5 1 8 8 8 1 9 2 3 B a b 2 5 2 2 2 El 81 21 -1 1 -B I -5 -8 . d 9. .. S . b E a. .. I X I I F a E :2 1 :8 b :8 :5 S :9 :g 9 b :8 =2 :1 AI 91 9 1 9 1 8 1 2 1 1 1 8 1 8 1. . a - E-v S 9 d- 8-5 -' B I -I I -Z I -E I -b I -S I -9 1 -d l -8 1 -E I -B B -EI -11 -B -A -S -D B B B N U N B T I J BB 'I =[ 59 PJA aa 'l zt e pj x S' SI BZ Z =p o/ xa w1 B b ' E l S S b ' b G a l -3 ' 1 1H U L S E B ' S B ' B B / A -S -D B H = B D H L T O A i N B B B H D : wl / d D S N U B L H B = 3 d A 1 8 7 n 8 5 ' O N -8 7 0 8 = N O I L H D I J I L N H U I [P 3] S B H W H A i H D I W ' S E N I W H W B U N H D O S I N H L L B H W W O B ; BB I S b -S i N B N L H H d B U N O I L H D W H A B U N B i N B N d O W E A B U 7 8 3 1 3 1 3 3 7 3 N O I S I A I U B B Q S U B S