f V'/Isartryck
170 1991
Effects on driving performance of visual field defects: A driving simulator study
Per Lovsund, Department of Injury Prevention, Chalmers University of Technology, Goteborg, Sweden
Anders Hedin, Department of Ophthalmology, Karolinska Hospital, Stockholm, Sweden
Jan Tornros, Swedish Road and Traffic Research Institute (VTI), Linkoping, Sweden
Reprint from Accid. Anal. & Prev., Vol 23, No 4, pp 331-342, 1991
an
Veg-och Trafik- Statens väg- och trafikinstitut (VT!) * 581 01 Linköping ' [IIStltlltet Swedish Road and Traffic Research Institute * S-581 01 Linköping Sweden
Accid. Anal. & Prev. Vol. 23. No. 4. pp. 331 342, 1991 0001-4575/91 $3.00+ .00 Printed in Great Britain. © 1991 Pergamon Press plc
EFFECTS ON DRIVING PERFORMANCE OF VISUAL
FIELD DEFECTS: A DRIVING SIMULATOR STUDY*
PER LÖVSUND
Department of Injury Prevention, Chalmers University of Technology, S-412 96 Goteborg, Sweden
ANDERS HEDIN
Department of Ophthalmology, Karolinska Hospital, S-104 01 Stockholm, Sweden
JAN TÖRNRos
Swedish Road and Traffic Research Institute (VTI), S-581 01 Linköping, Sweden (Received 18 March 1989; in revised form 24 September 1990)
Abstract To elucidate the possible traffic safety risks induced by visual field defects, a method was developed based on a driving simulator. The capacity to detect stimuli of different sizes appearing in 24 different positions on the screen in front of the driver was measured. Two groups of normal subjects and a number of subjects with different visual field defects were studied. In the groups of normals, the median reaction times were fairly homogenous. There was a slight difference between central and peripheral stimuli, which was somewhat larger for the older subjects. Among the subjects with field defects, the individual variations were very dominant. Very few of these showed a capacity to compensate for their deficiency. In order to gain insight into possible compensatory mechanisms of these persons, eye movement recordings were made. The results indicate that the visual search pattern may be of importance in this respect. Some comparisons with respect to detection capacity were also made with one-eyed subjects and with optically generated field restrictions (spectacles and spectacle frames).
It has long been considered essential for traffic safety that the visual fields of drivers are normal or near normal. In theory, normal fields make possible the early detection of objects in the peripheral field. Although there are cases where a visual field defect most probably has influenced an accident, it has been difficult to prove the importance in large-scale studies. The low frequency and the multifactorial causes of accidents set a demand for very large driver groups followed for several years. In several large-scale studies, it was still not possible to prove a correlation between the extent of the visual fields and accident rates (Burg 1968; Council and Allen 1974; Henderson and Burg 1974; Hills and Burg 1977; Cole 1979). In these studies, however, nonstandard perimetric techniques were used and only the horizontal meridian was tested. Another possible reason behind this lack of correlation could be a difference between performance in a static field test and that of the actual traffic situation (the functional visual field; see Verriest 1983; 1984).
In a more recent study incorporating over 17 000 volunteers, it was found, however, that subjects with bilateral visual field defects had a rate of accidents and convictions more than twice that of age- and sex-matched controls without bilateral defects (Johnson and Keltner 1983). In this study a fast but nevertheless accurate perimetric procedure was followed. Similar results have been found regarding monocular drivers by Keeney and Garvey (1981).
Drivers with visual field defects claim they learn to see in their blind areas by frequent eye and head movements. Almost without exception they deny any problems with
de-tection in the direction of the blind zone. '
The divergence of scientific data and opinions has had two consequences: i) it is extremely difficult to set a standard for the visual field of driving applicants; ii) it is difficult to make up rules for which experienced drivers should be given a waiver for their field defects. Therefore, standards differ widely between countries as does the attitude to dispensation. Of the two problems, the former is easier to describe, since
*This work was supported by the Swedish Transport Research Board and VTI.
331
the standards are found in the statutes on licenses. In Europe as well as elsewhere, there are regulations for professional drivers. When it comes to passenger car driving, there are, however, countries with no demands on the visual fields, whatsoever.
Great Britain has no standard. However, it is suggested that a binocular field less than 90° should be regarded as a defect that renders driving a hazard. In West Germany, a normal visual field of one eye or of the two eyes together is required. In Denmark, all bilateral defects must be judged by the National Health Authority. In Finland, there is no standard. In Norway, one eye must have a normal visual field. The Swedish standard corresponds to the West German. In Japan, there is no standard for the visual field of passenger car drivers. In Canada, the extent of the horizontal meridian must be binoc-ularly 120°. In the United States, there is a large difference between states. To the best of our knowledge, only 20 states have visual field standards. Without exception, they only concern the horizontal meridian, and values between 100° and 140° are given. In the other states, there is no visual field test, although such a standard has been discussed in several of them.
Some countries thus set a standard for the whole field, others for certain meridians. If a figure given for a meridian should have any meaning, one must, however, also specify test procedure; this is not always done.
The extent of a field meridian depends on the contrast and size of the test object. It is usually recommended that a round object be moved in a circular pathway from behind the testee. A large object with high contrast to the background is observed farther peripherally; differences in test procedure thus make possible large variations in the field size measured.
This brief description should make evident the large differences between the char-acter and the extent of the standards in different countries and also the importance of the test procedure.
OBJECTIVES
The aim of the present investigation was to elucidate the possible traffic safety risks induced by visual field defects of different size and location. The aim was also to get a rough measure of the in uence of optically generated field restrictions. Some compar-isons were also to be made with monocular drivers. In Sweden, these persons are per-mitted to drive a passenger car after an adaptation period of six months. Standards certainly differ between countries for these drivers as well.
A test method was developed that allowed the detection capacity in different parts of the visual field to be studied. Since this dependent variable is difficult to measure in a standardized way in real car-driving, a sophisticated driving simulator was used. In order to gain insight into the possible compensatory mechanisms in subjects with hom-onymous visual field defects, an eye movement study was performed.
Study 1: Visual field defects and other field restrictions
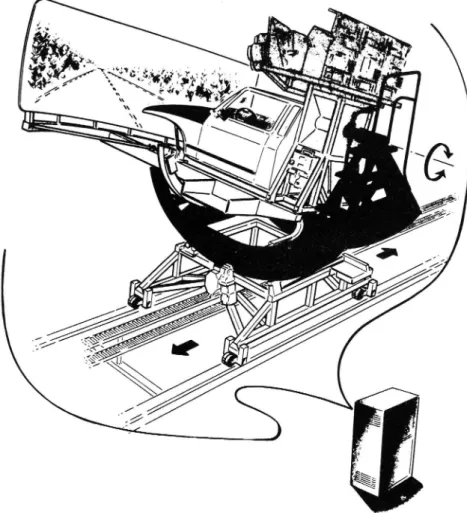
The study made use of the Swedish Road and Traffic Research Institute (VTI) driving simulator (Fig. 1). The driving compartment of the simulator consisted of a real truncated car body, complete with all controls, which were parts of a feedback system of which a digital analog'computer was the brain.
A continuously changing road pattern and landscape was randomly generated by a computer. A large television unit interpreted the signals and presented them visually on a wide-angle screen (120° horizontally, 30° vertically) in front of the driver. The computer generated an ever-changing pattern of road and landscape which included not only bends and straights but also uphill and downhill sections.
Activation of the controls by the driver caused the appropriate change in the visual scenario to occur. The computer continuously monitored the driver s performance and functioning and at the end of a test presented a detailed assessment of the parameters under study.
Effects on driving performance of visual field defects 333
Fig. 1. VTI car driving simulator with cover removed.
For further information on technical details, see Nordmark (1984) and Törnros et al. (1988).
The test subject was instructed to stay in the right lane of a two-lane road and to maintain a steady 100 km/h (60 mph) throughout the test. The driving task demanded practically constant attention on behalf of the subject.
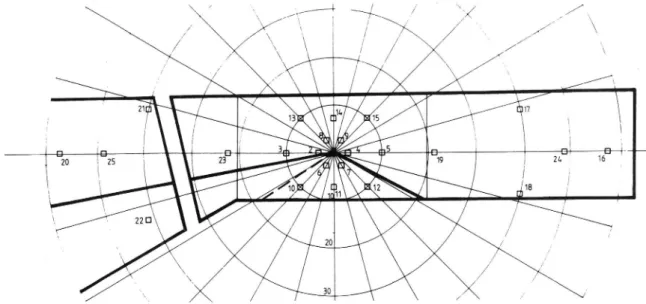
On the screen, ickering (6 Hz) black and yellow quadratic reaction-time stimuli of three different sizes were presented. The stimuli appeared randomly, one at a time, in any of 24 positions, located in areas of traffic safety and ocular pathology interest (Fig. 2). Each stimulus was presented ten times during the test. The stimulus disappeared after correct action by the subject or after 10 seconds.
The subject had to respond to a stimulus by immediate braking; the measured parameter was the latency between the appearance of the stimulus and brake pedal movement. The driving capacity was recorded as the ability to drive at the specified speed on the right side of the road.
The test was divided into four parts; each of them took about 30 minutes. In the first and fourth parts, the stimulus subtended an angle of 0.460 (medium); in the second, 0.23O (small); and in the third, 0.96O (large). By this procedure it was made certain that the test included a stimulus relevant to the real traffic situation, since the smallest stimulus was not far from the threshold for normal sighted persons.
Before the first test drive, the subject practiced the driving task for about 20 minutes. A short practice session also preceded each of the following test drives.
SUBJECTS
By this method, two groups of volunteers with normal uncorrected visual acuity and fields were tested, ten in each group, one group aged 20 30 years and the other 50 60
.
lj
l l | | | + %H-w . I .* 3. ' .., ' s19 i 1 21S 16l
,-x c: 12 [1418 ' y 140 1 11 1/ i ] T i lx , \ = 22 D / ,' / 20 / *. / l/ ' 30 /, I,Fig. 2. Location of the stimuli. The frame shows the boundaries of the windscreen and part of the left-side window. Road boundaries are marked as well.
years. Thirty-one subjects with visual field defects were studied. In all cases, the duration of the defect was at least one year. Three one-eyed subjects who had lost the other eye several years ago were also tested. The single eye was normal. Three myopic subjects and one hyperope were tested with both spectacles and contact lenses. Their refraction exceeded sphere i SD. Finally, one subject with normal visual fields was tested with and without spectacle frames. All subjects with visual field restrictions had recent mon-ocular, kinetic perimetry with the Goldmann perimeter to define the extent of the absolute and relative visual deficiencies.
RESULTS
The subjects, including those with different kinds of visual field defects, usually showed good driving capacity as measured by speed variations and departures from the right lane.
Normal fields
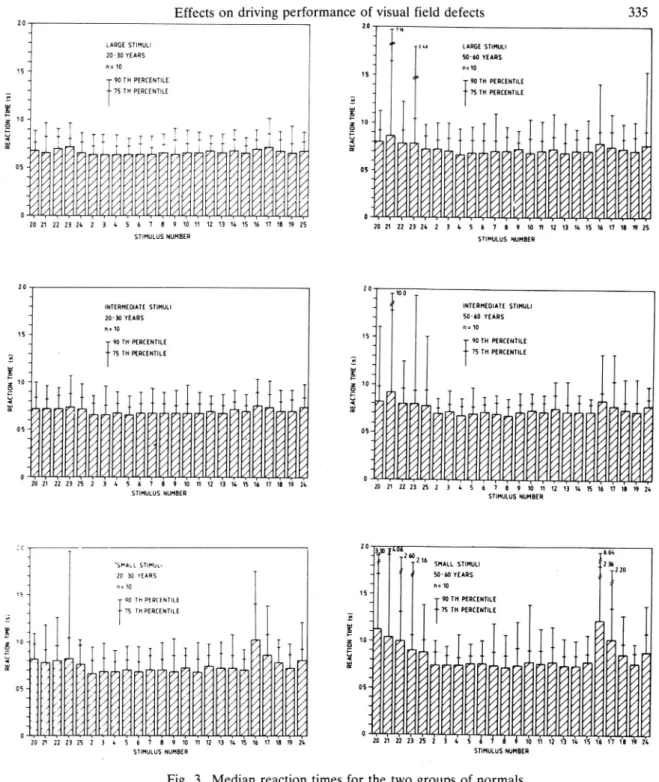
The median brake reaction times were about O.65 O.8 seconds, depending upon stimulus size, with small differences between the reaction times for central and peripheral stimuli. Those for peripheral stimuli were somewhat longer (Fig. 3). The differences were somewhat greater among the older subjects and especially pronounced for the smallest stimulus.
Visual field defects
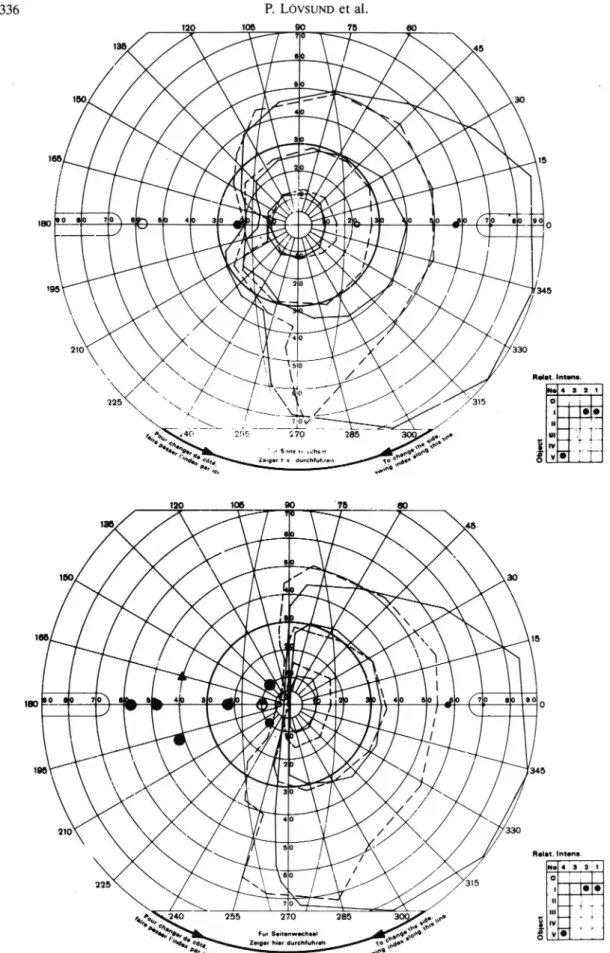
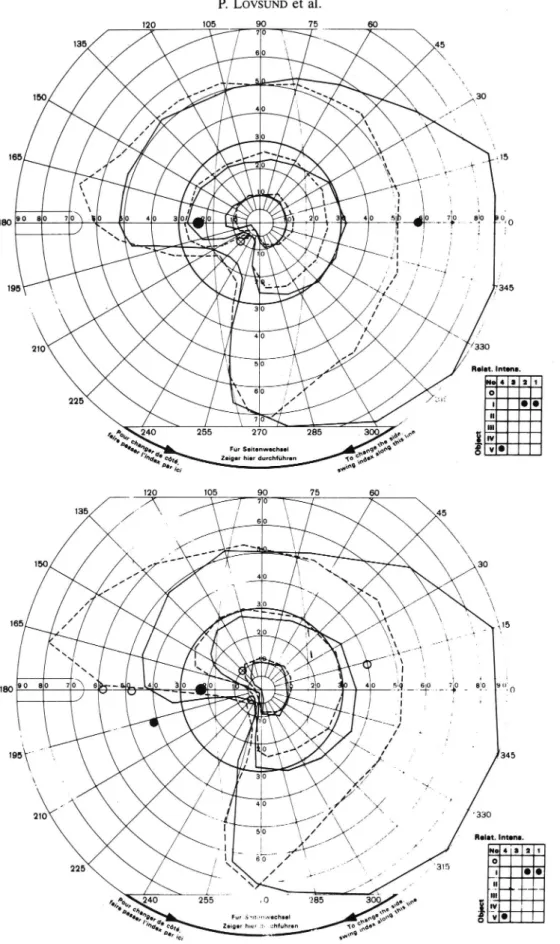
For each stimulus location and session, the median reaction time was compared with the results of the normals of corresponding age. If the value of the subject exceeded the 90th percentile of the normals, this was considered to mean an overall increment of the reaction times and was marked on the perimetric chart (circles; see Fig. 4).
From the traffic safety point of view, it could also be of importance if the reaction times of single presentations were prolonged. A fourfold increment, i.e. times exceeding three seconds, was arbitrarily considered significant. Single delays were accepted (chance lapse of attention?); thus, two or more reaction times over three seconds were considered of importance and this was marked with filled dots on the charts.
Even more significant were cases where the subject did not observe the stimulus at all during the ten seconds it was shown. Two or more such misses were recorded and marked with filled triangles on the charts. Since it was considered more significant if larger stimuli were affected, circles, dots and triangles of three sizes were used to mark the abnormal reaction times.
RE AU'I ON TI ME (s ) RE AC TI ON TI HS (s l RE M: TI ON Hf ls )
Effects on driving performance of visual field defects 335
20
NO
_. H6
_
* LARGE srmuu - = m LARGE srmuu
" 20-30 YEARS * j 50-60 YEARS 15 ~ "= 10 15 _ n=10 _ 90 TH PERCENTILE _ 90 m RERcEmiLE - %s TH PERCENTILE _ {7s m PERtEmuEE _ " _ _ .:£ _ 10 _ T T ; 1° _. 1--1 o T T T T T I T T T + 5 _ .. T I T I T .. + + U( "* - C! _. os os -1 / -1 0 T I I I T' | | 1 TTTTTTTT I l T | 1 I Q 0 7 l l l T I I I llllll 'I I l l l l v Y'T 202122232523k567891011121316151617181925 2021222326236567091011121316151617101925 srmuws NUMBER STIMULUS NUMBER
20 20
_ 1100 _
INTERMEDMTE srmuu _ i j INTERMEDIATE STIHuu
* 20-30 YEARS - 50-00 YEARS " n=10 ~ n=10 15 15 .. . _ 90 m RERcENnLE _ 90 m RERtENTlLE - %s m RERcENnLE __ _ 75 m PERCENTILE M ; _. _ E _ ... 10 g 1.0-_ .: _ _. U( h] _. a -. q _ 05 05 o ' ' 7" ' | ' " V " | ' | ' 'T' {0512122325530S'Zi5510111213151'5161710325 ° vvvvvvv ,I,,,,,,, ... .' 120 21 2223252 3 A 5 0 7 e 91011121316151617101926
snnuws NUMBER srmutus uunacn
C 20-1 T
l _mll 200 66L
_ 216
"SMALL srmm. _ SHALL srmuu in)
20 30 YEARS ~ 50-00 YEARS I n=10 _ "31° is _ 90 TH REREENmE 15 "_ 90 m PERCENmE {75 m PERCENTILE _ _ {7s m PERtENTILE ... _ _ ;|. _ 10 -< l g 10 _ / _ // 5 - / / 0 f = * / / / _ / a _ / / /
1
&
&
%
os / o.s / //;
&
%
_ / _ / / / 1 , _ / o 27° " | | ' 7 l' I I l l ' ' T I ' ' "T 2122232523as Ji1o11121'31a1s1011101925VVVVVVVVVVVVV I'Y'Y'IIVVYFT 2021222325236 567 091011121315151617181926
STIMULUS NUMBER STIHULUS NUMBER
Fig. 3. Median reaction times for the two groups of normals.
A visual evaluation of the perimetric charts served to decide whether there was an overrepresentation of prolonged reaction times in the affected visual field areas. Single abnormal points often appeared in normal field areas, but could usually be explained by interference from the rearview mirror or a windscreen post. Several deviant points within the pathological field were taken to imply that the subject did not compensate for the defect; this point was strenghtened by increments over three to ten seconds.
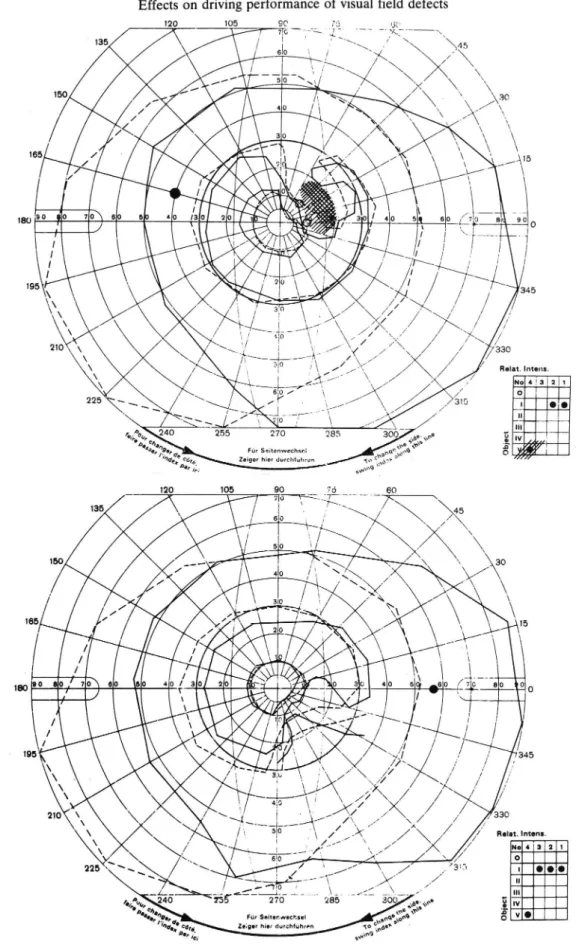
Of the 31 subjects with visual field defects, it was concluded that only four com-pensated for their field loss (Table 1). Examples of compensation and non-compensation are given in Figs. 4 and 5. All of the remaining 27 subjects showed an excess of abnormal reaction times in their deficient field areas. In all these cases, the number of abnormal points was large (greater than 8), and there were also at least two points with at least two individual reaction times longer than three seconds. Figure 6 shows the results for the remaining two subjects, who managed to compensate for their defects.
Of the three one-eyed subjects, one performed as well as the normals, whereas, another showed some deficiences on the blind side for medium-sized and small stimuli, and the third showed markedly prolonged reaction times in the periphery of the blind side for all stimulus sizes.
120 105 90 75 60 135 45 C 0 160 I I 30 3 x 166 ' 15 / 2 ] \ ( ... x \ ' > 4 \ , 180 O 0 7 0 0 5 4 3 0 _ 2 0 0 ( 7 0 O __9_0_ O 1 I / / ~\ I . /. 2 195 ° / / / ils ts / \ 210 330 Rent. imon.. 0 2 1 I, 315 ,/ '\6..' 0 ' I' S-vm w Lchs st Ze-gov r : durcMuhmn . _ o . .! få, 'In 9 120 1M 90 "75 . 00 13 45 0 ' \ wo / so ! \ \ | P | ' s \\ 15
\ N
I X I im 2° 70 o 4 3 4 50 10 a so 0 l / - / / 4 0 / 210 x / / 33° 6 0 ' , / Rom. "nom. ' / 4 3 2 1 6 O 225 x / / 3 5 x ' \ \ & 7 0 04,00, 2 70 ,'xo,.;x'xo. E Q 6." 6 a ._ ...,-:D,, For Soilonwochul .c 9 .\o 8
"Du. Zoio him dutch bhroh 10 ewa."
' foi i $'"".
Fig. 4. Results for two subjects with hemidefects, one with an acceptable compensation ability and the other with impaired detection capacity in the affected field areas.
0: increased reaction time
.: two or more reaction times longer than 3 s A: two or more reaction times missed
The size of the respective symbols refers to small, intermediate and large stimuli. Solid lines: field of right eye
Effects on driving performance of visual field defects 337 Table 1. Number of subjects with different types of field
defects and their ability to compensate for the defect ( = impaired, + = compensation)
Number Compensation
of subjects Type of field defect ability
2 Local scotoma _ + 3 Irregular defects 4 Partial quadrant + + 7 Quadrant _______ 9 Partial hemidefect 6 Hemidefect _____ +
Spectacles and contact lenses. The results for two of the three myopic subjects were quite normal both with contact lenses and with spectacles. The third myope also showed normal reaction times when wearing spectacles. When wearing lenses, however, the subject had problems detecting the small stimuli in the far periphery on both sides. For larger stimuli no such effect was evident.
The hyperopic subject showed & very marked peripheral performance decrement when wearing spectacles, irrespective of stimulus size. The result for lenses was normal. Spectacle frames. The result for this normal-sighted subject was quite normal for large stimuli. For the smallest stimulus size, detection capacity was markedly lowered in the far periphery on both sides when wearing spectacle frames.
Study 2: Eye movement study of subjects who showed a capacity to compensate for their defect
As regards the possibility that certain individuals with field defects might be capable of compensating for their defect, the suggestion was tested that this ability might be related to their visual scanning behaviour.
To this end eye movements were recorded while the subject was driving the driving simulator, using a NAC eye mark recorder (model V) (NAC Inc. 1984), which functions according to the principle of corneal reflection. It records the movements of one or both eyes simultaneously superimposed on the visual field image. In the present study, the one-eye option was used. The data output unit gives horizontal and vertical coordinates in reference to the field picture with an accuracy of 320 units over 60° horizontally and 244 units over 45° vertically.
A exible data program developed at VTI analysed the recorded data with respect to location and duration of eye fixations, which were defined as eye movements remaining within a square with sides of approx. 0.6o of visual angle (i3 units horizontally and vertically) for at least 100 ms. Values of various fixation parameters could then easily be calculated, such as central tendency or variability measures.
Subjects with "good detection capacity in their blind areas were compared with subjects with similar defects showing reduced detection capacity in their blind areas, the hypothesis being that they would differ regarding their visual search pattern.
' Two of the four subjects with bilateral defects who managed to compensate for their defects on the simulated task were selected for the study of their eye movement patterns. The choice of subjects had two reasons, (i) the greater size of the defects of these two persons and (ii) the need to find subjects with a comparable field loss but with little or no ability to compensate. The visual performance of the subjects participating in the eye movement study is shown in Fig. 4 and Fig. 5. As can be seen, the blind areas were somewhat smaller for the two subjects who showed compensation ability. In spite of that. comparisons were considered meaningful.
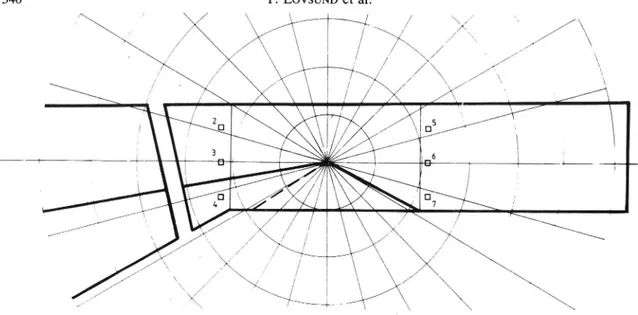
Since the NAC eye mark recorder has a horizontal field of view slightly exceeding 60°, most peripheral stimuli cannot be seen unless the subject moves his head. A new stimulus configuration was therefore set up (Fig. 7). Only the medium stimulus size was used.
338 120 105 90 75 60 7 0 135 - \ 45 6 0 '\ \ ' 40 " xx ,'/ / l \ / 30 \ / X 18090 so 70 .so o 40 301 o , 02310 3 40 I x _ .» * V å r _ v
»
X
Å
/
o ! *. 0 Q _ +o ' | J! -o W c O 195 I -'- ' x ;, / " 7'345 210 f // // ' /330f Rom. Int-no. \ 6 0 I" / _ " _ o 225 \ ,'// ;. |: Far SoitonwochnlZoigor hier durchmhron
120 105 90 75 60 _ 135 " [[Åx 7 o 45 / "X 165 / / \ X. I, \ | X ' 5 . = o x 4 -195\' =. ' ,I &, ' N. If" ,_ .345 ' 330 210 &_ _ z'l/ \ // " » /' | P- -""" / // / x I fl 5 O / / / | | / _ // , ' Rout. Imam. _ I | I T /",. l, , | ' r / éo / x' _/ \ ' 225 / \\ // _ ,» .. "315 O \ / X . O _/ /_/". ,x. ', h . %% 255 85 300 ,\o°;\'~° b c;,.. .!) . &e a / 4 Fur aannn-A'OCVNOI wg ot .. . . .~ _ '!
'hd.* pedro Zeige! I'm." _:- &, 10 906°,"
, f _» ..o-. -..o-. ,)
.. w m l
Fig. 5. As in Fig. 4 but for two subjects with partial quadrant defects.
Eye movements were recorded for ten minutes for each subject during which the reaction time performance was recorded as well. Before testing, the subjects practiced the driving task for about 15 min.
RESULTS
The reaction time performance for each of the four subjects is shown in Table 2 (arithmetic means for the different stimulus points). The subjects who had not shown
Effects on driving performance of visual field defects 339 120 105 se .-5_ . nu '_"Jx ' 135 / ' \ 610 'x l/v / .
,,
"Ela "x x' "' xX/Å \\
7 * / \\ 150 / n x x & / 165 180Far Seitcnwechsnl
Zeiger hier durchfuhren
135 Relat. Intern. 4321 xx.___! "' .
x45 "
t../fx.
_L_l.._.-|.- _..._- _ 270 ' " 0 «saw 8 b b. ( e x ECo.,, 7?» Fur Seitenwechsel vtoqeaxooQ o
Pg. ' Zeigcr hier durchhihrpn
Fig. 6. Results for two other subjects with an acceptable compensation capacity. Upper figure: Scotoma of right eye ////
Scotoma of left eye \\\\\
an ability to compensate performed, as expected, rather poorly in their affected areas. One of the compensating subjects again showed his capacity to compensate (subject C). The fourth subject, however, showed a clear performance decrement in his affected area (subject A).
Eye movements were analyzed with respect to the distribution of fixations in the horizontal plane. Table 3 shows the results for this measure. The two subjects with partial
\ J \ N _ _ _ i x D U /
V
X
X ' ' y \ \ \Fig. 7. Location of the stimuli used in the eye movement study.
quadrant defects showed marked differences with respect to their fixation patterns. The one who compensated concentrated a much greater percentage of his fixations to the affected (left) side of his visual field than his counterpart. This difference in fixation patterns could very well be at least the main reason behind the differences in reaction time performance between these two subjects.
The comparison between the two subjects with hemidefects is, of course, less rel-evant, since neither of them showed a clear ability to compensate on the task. However, the person with the worse reaction time performance in the affected area searched the area most to the left more actively. This discrepancy of results here could, however, be due to the field loss differences between the two subjects.
CONCLUSIONS AND DISCUSSION
The results of the present study show that among the subjects with visual field defects, the individual variations were very dominant and that most of them showed an impaired detection capacity for stimuli in the affected parts of the visual field. The study thus indicates that most subjects with homonymous defects cannot compensate for their deficiency.
Neither this study nor Johnson and Keltner (1983) give any clue to which field defects (if any) could be accepted without loss of safety. It is reasonable to assume, however, that defects in the central field are more important than peripheral ones, that deep scotomas are more significant than shallow, and then the horizontal meridian is the most traffic relevant. Unfortunately, the knowledge necessary will demand further studies of a very large scale.
Table 2. Reaction time performance during eye movement recording Stimulus position
Defect 2 3 4 5 6 7
Subject A:
(Hemidefect, compensating) 1.9 s 2.2 s 2.4 s .7 s .9 s .8 s
Subject B:
(Hemidefect, not compensating) 6.1 s 2.6 s 2.6 s .8 s .9 s .9 5
Subject C:
(Partial quadrant defect, compensating) .7 s .7 s .9 s .7 s .7 s .8 5
Subject D:
Effects on driving performance of visual field defects 341
Table 3. Distribution of fixations
Distribution of fixations, from left to right
Defect 0 12° 13 24° 25 36° 37 48° 49 60O Total
Subject A:
(Hemidefect, compensating) 9.0% 10.0% 79.6% 1.2% 0.4% 100.0%
SubjectB:
(Hemidefect, not compensating) 17.2% 0.4% 78.8% 3.4% 0.2% 100.0%
Subject C:
Partial quadrant defect, compensating) 26.2% 5.3% 59.2% 6.0% 3.2% 100.()%
Subject D:
(Partial quadrant defect, not compensating) 7.3% 3.5% 79.3% 8.9% 1.2% 100.0%
In any case, it is important that the defects be discovered. Some countries, like Sweden, have a fairly strict visual field standard but accept a crude method for screening applicants for a passenger car license. The reasons are that visual field defects without an evident disease or trauma are extremely rare in the dominant age group and that each applicant must sign a detailed health declaration. This declaration normally discloses to the medical staff at the license bureau which subjects need an ordinary perimetry. Congenital and/ or unknown major defects do exist, however, as was evident in one or our cases with a homonymous hemidefect. This subject passed the screening test but failed in our study.
Most young-tor-middle-aged subjects with visual field defects suffer from lesions due to cerebral vascular accidents or trauma, i.e. very obvious events. In the older age group, the dominating causes of field defects are glaucoma and diabetic retinopathy. These are mostly known to the patient, and his ophthalmologist should take the proper measures when defects with traffic relevance appear. Insidious glaucomatous large field defects are, however, not uncommon, and this fact, thus, supports the view that the visual fields be regularly checked in older people. If such an examination should be meaningful, it must be performed by a method both sensitive and specific. Unfortunately, there is none yet available at a reasonable cost in relation to the expected gain.
Only perimetry discloses all visual field defects of traffic safety importance. Auto-matic perimetry can be performed in a short time (Johnson and Keltner, 1983) but calls for expensive equipment. Furthermore, in spite of the few minutes required, it has been calculated that a very large amount of manpower would be needed if perimetry were introduced in a country like the United States. An even faster ergoperimeter might be the solution, or some other screening procedure that would make it possible to pick up the few applicants with visual field defects of importance.
The few one-eyed subjects studied indicate that some persons will have the capacity to compensate for their defect, whereas others may have problems in this respect. These results are in accordance with those presented by others (Fletcher 1947; Keeney and Garvey 1981; Johnson and Keltner, 1983). This area, however, needs to be investigated further.
Optically generated field restrictions were studied to a very limited extent. None of the myopic subjects studied, however, appeared to be handicapped by wearing spec tacles instead of lenses. Some support was found for the hypothesis that spectacle frames and, more importantly, hyperopes glasses with a large refraction error (e.g. aphakic spectacles), will reduce the ability to detect objects in the periphery. Issues such as these definitely require further study. It seems desirable that such data should be regarded when formulating standards for visual fields.
Very few of those with restricted visual fields showed an ability to compensate. These persons had different types of abnormalities. Eye movement recordings demon-strated that the person who showed the best capacity to compensate, had a visual search pattern characterized by repeated scanning of his blind area at very short time intervals, whereas this was evidently not the case for a subject with a similar defect but lacking the ability to compensate. It is certainly reasonable to assume that this ability is related to such an active search of the affected area.
Provided the visual search pattern is crucial for the ability to compensate the question arises whether this capacity could be attained by systematic training programs. Based on these ideas regarding the mechanisms some preliminary studies have been undertaken to train persons with defects to learn how to compensate. The results, however, have been very discouraging and recommendations found in the literature (Bockelmann 1982) which suggest persons to deliberately move their eyes seem not to be effective.
The driving task employed in the present study is considered quite realistic, but no validation studies have been undertaken so far. Through this method (or similar ones) it should, however, be possible to gain knowledge that could be a base for formulating standards for visual fields and hereby gain agreement about standards among different countries.
There is no indication in the present study that the visual field standards should be less restrictive than they are. However, it can be discussed whether it should not be easier to get an exemption after passing a validated test.
REFERENCES Bockelmann W. D. Auge-Brille-Auto. Basel: Karger; 1982.
Burg A. Relationship between vision test scores and driving record: Additional findings. Report 68-27. Los Angeles: Department of Engineering, University of California/ Los Angeles; 1968.
Cole D. G. A follow-up investigation of the visual fields and accident experience among North Carolina drivers. Chapel Hill, NC: University of North Carolina Highway Safety Research Center; 1979.
Council F. M.; Allen J. A. A study of the visual fields of North Carolina drivers and their relationship to
accidents. Chapel Hill, NC: University of North Carolina Highway Safety Research Center; 1974.
Fletcher, E. D. Visual problems in motor vehicle operation. One-eyed drivers. Vol. 1, no. 11. Duncan, OK:
Optometric Extension Program; 1947:49 52.
Fonda G. Biotopic telescopic spectacles are a hazard for operating a motor vehicle. Arch. Ophthalmol. 101, 1907 1908, 1983.
Henderson, R. L.; Burg, A. Vision and audition in driving. Report DOT-HS-801-265. Washington, DC: Department of Transportation, National Highway Administration; 1974.
Hills, B. L.; Burg, A. A reanalysis of California drivers vision data: General findings. TRRL Laboratory Report 768. Crowthorne, United Kingdom: Transport and Road Research Laboratory; 1977.
Johnson, C. A.; Keltner, J. L. Incidence of visual field loss in 20,000 eyes and its relationship to driving
performance. Arch. Ophthalmol. 101: 371 375; 1983.
Keeney, A. H.; Garvey, J. The dilemma of the monocular driver. Am. J. Ophthalmol. 91: 801-803; 1981. NAC Inc. Operation manual. Eye mark recorder model V. Tokyo; 1984.
Nordmark, S. VTI Driving simulator. Mathematical model of a four-wheeled vehicle for simulation in real time. VTI Report 267A. Linköping, Sweden: Swedish Road and Traffic Research Institute; 1984.
Törnros, J.; Jansson, H., Laurell, H., Lidström, M., Morén, B., Nordmark, S., and Palmkvist, G. The VTI
Driving simulator Driver performance applications. Workshop simulation in traffic systems human as-pects. Bremen. VTI särtryck 122. Linköping, Sweden: Swedish Road and Traffic Research Institute; 1988. Verriest, G., ed. The occupational visual field I. Theoretical aspects: The normal functional visual field. Doc.
Ophthalmol. Proc. Series 35: 165-185; 1983.
Verriest, G., ed. The occupational visual field II. PractiCal aspects: The functional visual field in abnormal conditions; its interfaces with visual Ergonomics, visual impairment and job fitness. Technical Notes. 6th International Visual Field Symposium, S:ta Margherita Ligure, Italy, 1984.
