Department of Business Administration and Economics
Titel /Title: Market potential in Sweden of small wind power stations
Författare /Author : Bo-Göran Johansson
Examensarbete nr /Thesis No:
15 poäng /15 credits
Examensarbete/ Thesis
Magisterprogram med ämnesbredd med inriktning mot marketing management
Study programme in
Titel Marknadspotential i Sverige för små vindkraftverk
Nivå C-uppsats för Master of Business Administration i Marknadsföring Management
Adress Högskolan I Gävle
Institutionen för ekonomi 801 76 Gävle Sverige Telefon (+46) 26 64 85 00 Telefax (+46) 26 64 85 89 Hemsida http://www.hig.se Författare Bo-Göran Johansson
Datum 6 juni 2009
Handledare Per-Arne Wikström
Sammanfattning Syfte: I och med att den globala uppvärmningen är ett faktum och att användningen av energi kontinuerligt ökar är alternativa energikällor ett måste.
Användningen av olja och kol för uppvärmning är begränsad då den som resurs är ändlig.
Alla kommer att bli tvungna att delta i hur energi konsumeras och bidra till att lösa det globala problemet. För flertalet kan solfångare, solceller eller vindkraftverk vara ett alternativ som energikälla.
Idag är utbudet I Sverige av små vindkraftverk begränsat, med små lokala tillverkare eller importörer av utländska verk, vilka
marknadsförs och säljs för det mesta via Internet.
Metod: Den teoretiska modell som används I uppsatsen är baserad på MIO modellen, I kombination med flera andra modeller och verktyg som PESTEL, Marketing Mix, SWOT, Porter’s five forces, EVC och STP.
Resultat & slutsats: Det finns en marknad i Sverige för små vindkraftverk i storleksklassen 5 – 50 kW.
Den främsta orsaken till att marknadssegmentet existerar och kommer expandera i värde är den kontinuerligt ökade energikostnaden och att denna storlek på vindkraftverk kan tillåtas bli direktanslutna till kundens elförbrukning utan att passera elbolagens nätverk. Förslag till fortsatt forskning: Hur påverkas affären för små
vindkraftverk med andra alternativa energiproducerande lösningar, som solfångare eller påverkan av ändrad lagstiftning?
Uppsatsens bidrag: För att vara lyckosam i segmentet för små
vindkraftverk krävs en annan ansats på affärsstrategi, än vad befintliga aktörer gör.
Nyckelord Små vindkraftverk Vindstatestik Vindenergi MIO modellen
Title Market potential in Sweden of small wind power stations
Level Final Thesis for Master of Business Administration in Marketing Management
Address University of Gävle
Department of Business Administration and Economics 801 76 Gävle
Sweden
Telephone (+46) 26 64 85 00 Telefax (+46) 26 64 85 89 Web site http://www.hig.se
Author Bo-Göran Johansson
Date 6th June 2009
Supervisor Per-Arne Wikström
Abstract AIM: As global warming is a fact and the consumption of energy is continuously increasing, alternative sourcing of energy is a must. The use of oil and coal for heating is limited due to it is nature resource which is also limited. Everyone will be forced to evaluate their own usage of energy and look into the alternatives of how to be a part of solving this global issue. For many, alternatives such as sun panels and wind power stations could be an alternative power source.
Today, there is only a limited availability in Sweden of small sized wind power stations and only small local producers or importers that sell the equipment – mostly through internet based market
communications.
Method: The theoretical approach to this thesis is based on the MIO model in combination with several other models and tools such as, PESTEL, Marketing Mix, SWOT, Porter’s five forces, EVC and STP. Result & Conclusions: There is a market for small wind power stations between 5 – 50 kW in Sweden.
The biggest reason why the market segment exist and will increase is due to continuously increasing energy prices and that wind power stations of this size are permitted to be connected directly to household consumption.
Suggestions for future research: How are other energy complements like solar panels influenced? What governmental decisions affect the business of small wind power stations?
Contributions to the thesis: Success in this segment requires a different approach to product offering than what the current competition is doing.
Keywords Small sind power stations Wind statistic
Wind energy MIO-model
TABLE OF CONTENTS
TABLE OF CONTENTS ... 4
PART I: INTRODUCTION ... 6
1. BACKGROUND AND MOTIVATION OF STUDY ... 6
PART II: THEORETICAL BACKGROUND ... 9
2. PROBLEM & AIM ... 9
3. THEORETICAL DISCUSSION... 10 3.1. THEORY... 10 3.1.1. MIO MODEL... 10 3.1.2. PESTEL... 11 3.1.3. MARKETING MIX ... 12 3.1.4. SWOT ANALYSIS... 15
3.1.5. PORTER’S FIVE FORCE ... 17
3.1.6. SEGMENT, TARGETING AND POSITIONING ... 19
3.1.7. EVC ANALYSIS ... 22
3.1.8. TOTAL COST OF OWNERSHIP ... 23
3.2. THEORETICAL APPROACH ... 23
PART III: EMPIRICAL STUDY... 28
4. DATA COLLECTION... 28
4.1. CUSTOMER ... 29
4.2. COMPETITION... 29
4.3. LEGAL... 30
4.4. STATISTICAL DATA ... 30
4.4.1. ELECTRICAL COST DEVELOPMENT... 31
4.4.2. WIND STATISTICAL DATA... 31
5. EMPIRICAL STUDY ... 32
5.1. TOTAL COST OF OWNERSHIP ... 33
5.2. WIND SPEED IMPACT ON POWER OUTCOME ... 33
5.3. ELECTRICAL PRICE COST IMPACT ON NET INCOME ... 35
5.4. ANNUAL PRODUCTION COST IMPACT... 36
5.5. BREAK EVEN WITH TOTAL COST OF OWNERSHIP MODEL ... 37
5.6. COMMERCIAL SIZES OF WIND POWER STATIONS... 39
6. ANALYSIS ... 39 6.1. PRESENT SITUATION ... 40 6.1.1. MARKET ... 40 6.1.2. INTERACTION ... 41 6.1.3. ORGANISATION... 41 6.2. OPPORTUNITIES ... 41 6.2.1. MARKET ... 41 6.2.2. INTERACTION ... 41 6.2.3. ORGANISATION... 42 6.3. STRATEGY ... 42 6.3.1. MARKET ... 42 6.3.2. INTERACTION ... 43 6.3.3. ORGANISATION... 44 6.4. ACTIONS... 45
6.4.1. MARKET ... 45
6.4.2. INTERACTION ... 46
6.4.3. ORGANISATION... 46
7. REFLECTIONS ... 46
PART IV: RECOMMENDATIONS... 48
8. CONCLUSIONS... 48
9. RECOMMENDATION ... 50
10. FURTHER RESEARCH... 50
REFERENCES... 51
APPENDIX A: Basic calculations of wind power energy... 54
APPENDIX B: MIO Model matrix... 56
APPENDIX C: Strength / Weakness check list ... 57
APPENDIX D: Opportunities / Threats check list... 58
Figure 1: Porter’s Five Forces (Carpenter & Sandler, 2007, p.99) ... 18
Figure 2: Competitor analysis (Respective firm’s home page, 2008)... 30
Figure 3: Electrical cost development (Svensk energi, 2008)... 31
Figure 4: Average annual wind speed by MIUU method (Bergström, 2008)... 32
Figure 5: Wind speed at different heights (Energimyndigheten, 2007)... 32
Figure 6: Wind speeds impact on annual production (Johansson, 2008)... 35
Figure 7: Gross annual income (Johansson, 2008) ... 36
Figure 8: Annual running cost (Johansson, 2008)... 37
Figure 9: Total Cost of Ownership break even analysis (Johansson, 2008) ... 38
Figure 10: Nominal power of wind power stations (Johansson, 2008)... 39
Figure 11: Profit analysis during firm’s start-up period (Johansson, 2008)... 49
Figure 12: Total efficiency Cp of wind power stations (Larsson, 1985) ... 55
Table 1: Wind power stations Development 1980 – 2005 (Wizelius, 2007) ... 7
Table 2: Production costs of different power stations (Elforsk, 2008) ... 9
Table 3: Agricultural per arable land size (SCB, 2008)... 29
Table 4: Total Cost of Ownership calculation template (Johansson, 2008)... 33
Table 5: Production cost (Johansson, 2008)... 36
Table 6: Customer price calculation based on break-even method (Johansson, 2008).... 44
Table 7: Minimum income statement level (Johansson, 2008)... 45
Table 8: Start up firm income statement (Johansson, 2008) ... 49
Table 10: The MIO-model matrix (Eriksson et. al., 2004) ... 56
Table 11: Strength / Weaknesses check list (Kotler and Keller, 2005, p.55)... 57
PART I: INTRODUCTION
The introduction section contains the motivation for the study including the background leading up to the thesis question.
1. BACKGROUND AND MOTIVATION OF STUDY
As global warming is a fact and that energy usage is continuously increasing, alternative sourcing of energy is a must. The use of oil and coal for heating is limited due to it is nature resource, which is limited.
Everyone will be forced to evaluate their own use of energy and look into alternatives of how to take part in solving this global issue.
For many, alternatives such as sun panels and wind power stations could be an alternative power source.
The first documented use of wind energy for the purpose of stationary energy was the use of windmills in Afghanistan in 644 A.D. (Hau, 2006, p.2). The first use of wind energy with the purpose of producing electricity was in 1894 (Hau, 2006, p.24) in New York. However, the real pioneer in the development of wind power stations was the Danish professor Poul La Cour, who was encouraged by the Danish government to start developing wind power technology for the production of electricity.
In Sweden, discussions surrounding wind power was kicked off in 1973 (Motion 1973:350, 1973). The background to these discussions was the nuclear energy debate in Swedish parliament and the discovery of the states sensitivity to a single sourced energy system. Swedish parliament initiated a major competence-development program for wind power technology that in contrast to Denmark, USA and Netherlands, was focused on small-scaled wind power mills. The results of the Swedish development were two large wind power mills in the MW-class, Maglarp 3 MW and Näsudden 2 MW. Furthermore, a large investigation, which resulted in report (NE 1982:12, 1982, p.6), was conducted and revealed the potential of electricity produced in Sweden to be10TWh. Unfortunately, the Swedish way provided no long-lasting results. Denmark was more successful and today hosts the largest wind mill
manufacturing company in the world with a turnover in 2006 of 4.86 B€ and a 126% increase in sales from 2005-2006 (DN, 2008, p.12).
According to an investigation of small power stations presented in 2008 (SOU 2008:13), less than 63 A (ampere), equivalent to around 44 kW, should be able to be developed without any demands by decision makers in Swedish government. This will result in a much lower production costs of electricity. Furthermore, the investigation points out that the potential of wind power electricity production is around 8.6 TWh until the year 2025. However, with more efficient usage of the planned stations, the potential is between 17 to 26 TWh.
Since several Danish companies commercialized wind power stations during the early 1980’s, the development trend has been for larger and larger wind power stations. In the beginning, manufacturers offered a range of wind power stations up to 50 kW, during the 1990’s they offered between 225 kW – 500 kW and today 3 MW wind power stations are common (Wizelius (2007, p.143), Table 1: Wind power stations Development 1980 – 2005 (Wizelius, 2007)
. During these evaluation steps, manufacturers have been discontinuing smaller wind power stations.
Year 1980 1985 1990 1995 2000 2005
Power size [kW] 50 100 250 600 1000 2500
Rotor diameter [m] 15 20 30 40 55 80
Sweep area [m2] 177 314 706 1256 2375 5024
Annual production at good location [MWh/year] 90 150 450 1200 2000 5000 Table 1: Wind power stations Development 1980 – 2005 (Wizelius, 2007)
Development is due to the improvement in technology in terms of blade design, generators, etc. The higher a wind power station rotor is, the more stable it is at higher speeds. And as the energy in the wind is proportional to the cubic wind speed, it provides better production capacities.
Today, there is a limited offering in Sweden of small sized wind power stations. Only small local producers or importers sell the equipment through Internet based marketing
communications. This is excluding very small units less than 1 kW, which are offered for the charging of 12 V batteries used in summer houses, caravans, etc.
The general attitude toward small wind power stations1, as Britse and Wizelius state in their handbook Vindkraft på lantbruk (2006, p.19), is that small wind power stations below 100 kW output power are still rather expensive, therefore, the cost per kWh2 produced is much higher than the cost per kWh produced from larger wind power stations.
− Is this statement relevant? This question is the basis for this thesis. Thesis Question:
Is there a potential market in Sweden for small wind power stations in the range of 5 – 50 kW and what are the limitations?
1 The definition of small wind power stations, also defined as “gårdsverk” (farm wind power
station) has rotor diameter between 1 – 15m and 1 – 50kW output power (Wizelius, 2007, p.41).
PART II: THEORETICAL BACKGROUND
The theoretical background section will discuss the aim of the thesis, its related problems and current market situation. The theoretical discussion will provide the general theories used in order to be applicable to markets other than Sweden and are described in a way that gives any reader the possibility of understanding.
Each tool has sections that provide important inputs for a marketing plan and, therefore, the well-known theories used have been merged and adjusted to be suitable in the study of market potential of small wind power stations in Sweden.
The thesis investigates if a combination approach is useful in researching and developing a marketing plan.
2. PROBLEM & AIM
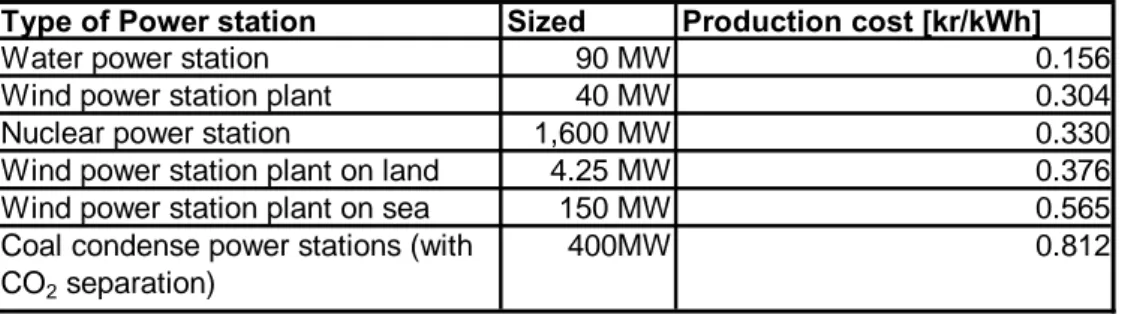
All energy production costs differ according to the report (Elforsk, 2008) regarding
production costs of different energy production system. Table 2: Production costs of different power stations (Elforsk, 2008)
shows the production costs of different production methods, calculated with 6% interest. Type of Power station Sized Production cost [kr/kWh]
Water power station 90 MW 0.156
Wind power station plant 40 MW 0.304
Nuclear power station 1,600 MW 0.330
Wind power station plant on land 4.25 MW 0.376
Wind power station plant on sea 150 MW 0.565
Coal condense power stations (with CO2 separation)
400MW 0.812
Table 2: Production costs of different power stations (Elforsk, 2008)3
One of the largest problems with wind power stations lies in making them economically attractive for customers. In 2008, a newly installed wind power station plant of 40 MW had an
electrical production cost of 0.30 kr/kWh, which is less than a newly installed nuclear power station production cost of 0.33 kr/kWh. However, it is twice the production cost of water power stations at 0.16 kr/kWh. This leads to an interesting question:
− What is the cost of producing electricity from small wind power stations?
Thus, it is not only the production costs that must be taken into consideration, but also political and legal aspects that influence the value of wind power stations, especially those of a smaller size. Governmental decisions on taxation or fees for the different energy production methods do change the possibilities of wind power stations.
3. THEORETICAL DISCUSSION
In order to create a valuable result, suitable methods and theories are important for the investigation to find an answer to the thesis question – Market potential in Sweden for small Wind power stations.
The theoretical approach in this thesis is based on the MIO model in combination with several other models and tools such as PESTEL, Marketing Mix, SWOT, five forces, EVC and STP. All models are described, as well as how they are combined to act as a tool for this study. Each model and tool is discussed as it is necessary in order to be applicable to other markets outside Sweden, thereby extending the sections on Marketing Mix and PESTEL.
3.1. THEORY
3.1.1. MIO MODEL
The MIO4 model was develop by Ericsson et. al. (2004), and is short for Market – Interaction – Organisation. It is a Matrix5 based tool and a structural and systematic way of identifying,
targeting, developing and implementing a Marketing strategy for a business. As mentioned in (Ericsson et. al., 2004, p.6) for “successful marketing” it is essential to have a good working
4 MIO is used as a short word for Market – Interaction – Organisation.
relationship (I) to maintain the interaction between the market (M) and business organisation (O).
The MIO model considers:
− Market – the market situation and values as the external factors related to the firm, − Interaction – transformation or the connection between the Market (customer) as internal
factors related to the firm and,
− Organisation – (own business – firm) the business’ own organisational match in comparison to its requirements and needs as internal factors related to the firm. Each phase in the Marketing plan considers:
− Present situation – Where is the business today, how the MIO looks today
− Opportunity Analysis – Where does the business want to be, what possibilities are there with MIO,
− Strategic Choices – How does the business get there, what actions and implementations are required in MIO and
− Action Programs – When does the business do what and which sequence shall actions be taken in MIO.
MIO model is good due to its ability to give an overall picture of the contents required for the Marketing Plan and planning process, as well as its high degree of flexibility.
3.1.2. PESTEL
The PEST analysis is an acronym for the four key strategic areas of change: Political factors,
Economic factors, Social factors and Technological factors. Each area has the potential to
fundamentally change the competitive environment where the company is operating (Aware). Adefinition, according to Grant, is “environmental influences” that “can be classified by source (for example into political, economic, social and technological factors (“PEST analysis”))” (Grant, p.68).
The following parameters need to be evaluated in the PEST analysis (netmba) extended as PESTEL analysis (Carpenter and Sandler, 2007, p.91 – 94) with Environmental factors and
Legal factors.
− Political: war, terrorism, inter-country relationships, international trade regions (Eriksson, et. al., 2004, p.22), political trends, governmental leadership, government structures, taxes, elections, employment law, consumer protection, environmental regulations, competitive regulations, and industry-specific regulations.
− Economic: economic growth trends, taxation, government spending levels, disposable income, job growth, unemployment, exchange rates, tariffs, inflation, consumer confidence index, import ratios, export ratios and production levels.
− Social: demographics (age, gender, race, family size), education, lifestyle changes, living standards, population shifts, trends, housing trends, fashion, attitudes toward work, fads, diversity, immigration, emigration, health, leisure activities, occupations, and earning capacity (Kotler & Keller 2005, Chapter 8).
− Technological: inventions, manufacturing advances, information technology, internet, communications, transportation, new discoveries, research, energy uses, energy sources, new fuels, rates of obsolescence, health, bio-tech, genetics, agro-tech, waste removal and recycling.
− Environmental: consists of direct and indirect costs as access to raw materials, waste, pollutions, etc.
− Legal: consists of laws and regulations in the region and within the organisation. PESTEL analysis is a good tool for putting the right amount of effort into strategic planning process that focus on outside environments and for identifying core strategic issues needed to focus on providing a better mid-term and long-term horizon in the strategic plan
(Businessballs). It is also applicable to different market sizes as for local as PESTEL is able to adapt to the request of analysis (Kotler et al., 1996, p.26).
3.1.3. MARKETING MIX
Initially, Marketing Mix was classified by McCathy (Kotler & Keller, p.19) into four groups consisting of Product, Price, Promotion and Place. To cover the increase in service oriented businesses, Booms and Bitner (Constantinides, 2006, p.12) extended the marketing mix by adding the three additional groups of People, Physical evidence and Process. This helped to maximize the performance of the businesses’ organization, and provide a marketing strategy
tool that expands the number of controllable variables from traditional marketing mix model in tangible products.
Product
Historically speaking, a good product will sell itself, but as with current situations there are no bad products that survive highly competitive markets and there are many laws giving
customers the right to return products perceived as bad.
Define the characteristics of your product or service that meets the needs of your customers such as, functionality, quality, appearance, packaging, brand, service, support and warranty. To be successful with products in the marketing mix it is necessary to group the market into segments, define the target customer in each segment, define the product’s positioning and develop products to match the requirements of each segment (Kotler & Keller, p.310).
Price
Price includes the list price, discounts, allowances, payment period, and credit terms. From list price until the final purchase price, the discounts, allowances, payment period and credit terms will affect the customer price. Price includes the list price, discounts, allowances, payment periods and credit terms. List price is normally the first indication of the supplier’s expected positioning within the segment in relation to the competition.
Sales promotions draw a stronger and quicker response from the customer (Kotler & Keller, p.555). “Advertising is any paid form of non-personal presentation and promotion of ideals, goods, or services by an identified sponsor “(Kotler & Keller, p.555). The definition is very clear and understandable. Promotions done in right way, in the right mix, provide a
measurable effect on sales (Kotler & Keller, p.555). There is a great importance in the right mix of promotion, so customers recognize the product or products and develop a need for the product.
Place
Availability is to have the right quantity of product at right place, at the right time. Place includes locations, inventory, logistics, channel members, channel motivation and market coverage. Furthermore, Place is also made up of service levels and the Internet. Channels are how product knowledge reaches the customer. Coverage is the strategically decided area or segment where the product should be available. The needs of location and inventory depend on product offerings and customer needs.
Promotion
Awareness of the products in the chosen target groups is created by information or education via advertising, selling, sales promotions, public relations, direct sales, sales, media, etc. Products today are more equal in quality and performances, therefore, the importance of promotions have increased. Differentiation is necessary to be successful in business.
People
All people directly or indirectly involved in the consumption of a service are an important part of the extended marketing mix. Knowledge adds significant value to the total product or service offering.
Process
Procedure, mechanisms and flow of activities by which services are consumed (customer management processes) are also an essential element.
Physical Evidence
The ability and environment in which the service is delivered, both tangible goods that help to communicate and perform the ability of the business to relay that customer satisfaction to potential customers.
Marketing Mix, the extended version, is the basic knowhow in marketing. The content covers all parts specifically related to the product and services required mapping and positioning. Marketing mix is requiring in order to:
− Group the market into segments
− Define the target customers in each segment
− Define product positioning and develop products that match the requirements of each segment
− Have pricing strategy that match the company’s mission and positioning vision − Develop as promotion strategy that fits the customers in the segments
3.1.4. SWOT ANALYSIS
SWOT analysis is a strategic planning tool developed by Albert Humphery at Standford University during the 1960’s and 1970’s were he used data from Fortune 5006 in a research
project.
SWOT is a short name of Strengths, Weaknesses, Opportunities and Threats:
− Strengths attributes are used for identifying the internal organisation that will achieve the objective,
− Weaknesses attributes are used for identifying the internal organisation that risks not achieving the objective,
− Opportunities are the external conditions that are useful to achieving the objective and − Threats are the external conditions that threaten to hinder achieving the objective. Hence, the SWOT analysis is divided in two groups; internal environment for Strengths and Weaknesses and external environment for Opportunities and Threats (Kotler & Keller 2005 p.52-54).
Internal environments are the factors that affect an organization’s strategies and positions in relation to competitions, e.g. financial, intellectual (as staff and management) and location resources, customer service, competitive advantages, infrastructure, quality, price, delivery time, efficiency, cost and capacity, see also additional factors listed in Table 10.
External environments are the factors that represent as Kotler and Keller (2005, p.52) mention the “macro environmental forces (demographical-economic, natural, technological, political-legal, and social-cultural)” and furthermore “micro environmental actors (customers,
competitors, suppliers, distributors, dealers)” and furthermore e.g. legislation, economic condition, expectations of stakeholders, technological changes, change in market place and public expectations, see Table 11. Hence, the factors in Marketing Mix are preferably included in the SWOT analysis.
To obtain an overview of the reality, simplifying information is necessary in order to create a base for conclusions and decisions. If the analysis is consequent, the SWOT gives a good picture of comparison and result.
6 The Fortune 500 is a ranking of the top 500 United States public corporations as measured
It is highly important that the SWOT is always considered to be subjective. To be as objective as possible it is a must to:
− Include competition – simplify the subjects. − Avoid grey areas.
− Make the complex subjects.
Of further importance when making a SWOT analysis is to identify the subjects of the analysis that are explicit and approved by all participated participants in the process, in the beginning. If the participants do not have the same purpose and objective, the result will definitely be less accurate.
The weakness of the SWOT analysis is underlined by Grant, (2005 p.13), who questions the validity of SWOT by stating; “if it is sensible and worthwhile to classify internal factors into strength and weakness and external factors into opportunities and threats”. Estimations and simplicities of reality are always a risk that effect facts and the possibility of getting wrong priority and impacts. As Grant also illustrate, the fact could be in several cases both Strengths and Weaknesses or Opportunities and Threats.
Grant’s point can reduce or even eliminate the validity of the SWOT Analysis.
To not mix up the Strengths with Weaknesses or Opportunities with Threats it requires that before a SWOT analysis is started, all topics are identified and defined first as internal environments or external environments.
Furthermore, Strengths and Weakness are relative, not absolute (Kotler et al., 1996, p.59) which adds to the subjectivity of the judgment in the analysis. What Kotler et. al. miss, is that Opportunities and Threats are also relative even though they are based on facts from data analysis or studies. This is because the analysis and judgment is done by people related to or independent of the commissioner.
By listing and specifying the topics and organizing them in a table (APPENDIX C: Strength / Weakness check list) for internal environment and in a table (APPENDIX D: Opportunities / Threats check list) for external environment, the risk of mixing and bad definitions will be reduced.
The tables give an overview of all topics: − Description of the subject.
− The affect - if it is a Strengths, Weaknesses, Opportunities or Threats.
When the subjects listed are defined, each must be indentified in a structured way to avoid its negative impacts by asking following questions (Wikipedia):
1. How can we Use each Strength? 2. How can we Stop each Weakness? 3. How can we Exploit each Opportunity? 4. How can we Defend against each Threat?
When each subject has been answered by USED, an action plan can be established to eliminate the Weaknesses and Threats and strengthen the affects of Strengths and Opportunities.
3.1.5. PORTER’S FIVE FORCE
By complementary with sixth force to Porter’s five Forces (Porter, 1980) (Carpenter & Sandler, 2007, p.99; Grant 2005, p.104), gives a structure clarifies a firm’s competitive environment and thereby the product’s or service’s strengths and weaknesses. This provides a company with tools to focus on, add or improve functionality as well as reduce cost.
The horizontal section of the model is a light version of a value chain; the vertical is the competition variants.
Figure 1: Porter’s Five Forces (Carpenter & Sandler, 2007, p.99)
The five forces analysis looks at five key areas, plus the added Complementors: − Rivalry − New Entrants − Supplier Power − Buyer Power − Substitutes − Complementors Rivalry
Rivalry is the “intensity of competition within an industry”. Rivalry, or Competitive Rivalry, describes the value of the firm’s products and services in comparison to competition, as number of competitions, what are the costs of adding value, brand value, etc.
New Entrants
The degree of threats of new entrants is the difficulty a new competitor has at passing the barrier of entry and intensifying the rivalry. Barrier to entry is the level of difficulty of entering the business.
Buyer power
Buyer power is the degree to which the firm’s customer evaluate the offers and are prepared to pay for products and services, as well as how many alternatives customers can compare with equal products and service.
Supplier Power
Supplier power is the degree to which the firm in the industry can or cannot dictate the terms of a contract. If the required product and service is unique or the availability of alternative offers is high, the value of the brand is high.
Substitutes
Threats of substitutes are products and services from other industries that can satisfy the same requirements and buyer demands. “A complementor is any factor that makes it more attractive for suppliers to supply an industry on favourable terms or that makes it more attractive for
buyers to purchase product or services from an industry at prices higher than it would pay absent the complementor” (Carpenter & Sandler, 2007, p.104).
Complementors
Complementors are products and services from other industries that are sold in the business and tend to increase sales by cooperating with firms in industries without competition.
3.1.6. SEGMENT, TARGETING AND POSITIONING
The basis of Marketing Strategy is the expectations of customer behaviour in specific markets. To get the knowledge of customer behaviour and purchasing behaviours, the concept and tools of market segmentation, market targeting and market positioning has been developed. The process is built up in steps with each being related to each other. To understand the process, it is necessary to clarify some definitions (Kotler et al., 1996):
1. “Market segmentation – Dividing a market into distinct groups of buyers with different needs, characteristics or behaviour, who might require separate products or marketing mixes.” Hereafter mentioned as segmentation.
2. “Geographic segmentation – Dividing a market into different geographical units such as nations, states, regions, counties, cities or neighborhoods“.
3. “Market segment – A group of consumers who respond in a similar way to a given set of marketing stimuli.” Hereafter mentioned as segment.
4. “Market positioning – Arranging for a product to occupy a clear, distinctive and desirable place relative to competing products in the minds of target costumers. Formulating competitive positioning for a product and a detailed marketing mix.” Hereafter mentioned as positioning.
5. “Product’s position – The way the product is defined by consumers on important attributes – the place the product occupies in consumer’s minds relative to competing products”.
6. “Market targeting – The process of evaluating each market segment’s attractiveness and selecting one or more segments to enter.” Hereafter mentioned as targeting.
Defined as (Wikipedia):
7. Product Portfolio – “A collection of products, projects, services, or brands that are offered for sale by a company”.
Defined as (Marketingteacher):
8. Positioning map – Evaluation of comparable products in a Segment in a coordinate system by measurable variables, normally using two variables.
Kotler et al. (1996, p.391) defines the segmentation, positioning and targeting procedure more clearly by:
Segmentation steps:
1. “Identify bases for segmenting the market” 2. “Develop profiles of resulting segments”
Targeting steps:
3. “Develop measures of segment attractiveness” 4. “Select the target segment(s)”
Positioning steps:
5. “Develop positioning for each target segment” 6. “Develop marketing mix for each target segment”
The presentation by Grant (2006, p.117) is not clear to where the steps belong (segmentation, positioning or targeting):
1. “Identify Key Segmentation Variables” 2. “Construct a Segment Matrix”
3. “Analyze Segment Attractiveness”
4. “Identify the Segment’s Key Success Factors” 5. “Select Segment Scope”
Marketing segment variables (Kotler et al., 1996, p.399; Wikipedia), especially for consumable products, is normally based on:
1. Geographic variables, as region, country, climate or type of nature
2. Demographic variables, as age, gender, family setup, income, occupation, religion or sex 3. Psychographic variables, personality, life style or attitude
4. Behavioural variables, as brand loyalty or product end-use
Grant (2006, p.123) defines the vertical segmentation for industries, as “Profit Pools”, “by identifying different value chain activities”, which is in most of the cases true.
Purchasing forces control the choice of products.
Kotler et al. (1996) is more precise and clear in the presentation of the processes and by splitting up of the development steps, it is easier for the user to succeed with the activities.
While Grant (2006) tries to explain things through text and examples, it is more difficult to follow.
Kotler and Keller (2005, p.262) underline clearly, that the developed segments (with the short name SADAM) shall be:
1. Substantial – sufficiently large and profitable 2. Accessible – reachable, servable and maintained
3. Differentiable – conceptually distinguishable different in customer behaviours 4. Actionable – possibility to offer attractive products and service
5. Measurable – size, purchasing power and characteristics.
By having separated the market into defined segmentations and positioning the firms offering in each segment, the final step is to define targeting.
As mentioned above the purpose of targeting is to select the target customer or customers in each segment. When defining target customer or customers, one uses measurable values of segment attractiveness and the selection of target. Furthermore, it is important to evaluate the ability of the company and its resources needed to broaden the market as well as analyze the competitors that are already acting in the target market (Wikipedia).
Different targeting models (Marketingteacher) are:
1. “Single segment with single product”. The supplier offers just one product to one targeted segment of all defined segments.
2. “One product for all segments”. The supplier offers one product to all defined segments. 3. The supplier’s product portfolio consists of several products with same or different brands,
where each product or products are targeting specific defined segment. Thereby creating a tailored product offering to each segment.
The next step is targeting. As mentioned above the purpose of targeting is to select the target customer or customers in each segment. When defining a target customer or customers, one must use measurable values of segment attractiveness in the selection of target. Furthermore, it is important to evaluate the ability of the company and its resources needed to broaden the market and analyze the competitors that are already acting in the target market (Wikipedia). Different targeting models (Marketingteacher) are:
4. “Single segment with single product”. The supplier offers just one product to only one targeted segment of all defined segments.
6. The supplier’s product portfolio consists of several products with the same or different brand, where each product or products are targeting specifically defined segment. Thereby creating a tailored product offering to each segment.
By having separated markets into defined segmentations and targeting potential customers in each segment, the final step is to define positioning.
Positioning is to position the products in each target segment and thereby create the product mix. This is done by mapping the company’s products internally against each other and also their place compared to the competition on a positioning map. The positioning map consists of the segment’s defined variable parameters, for example performance and sophistication. The following question is valuable in obtaining a successful positioning (Marketingteacher):
1. What is the current position? 2. What is the wanted position? 3. Who has the wanted position?
4. What resources are required to reach the wanted position and do those exist? 5. Can the company persist until the position is reached?
6. Are the tactics inline with the defined positioning objective?
The presented theories and tools are very valuable and can easily be used when doing
segment – targeting – positioning process.
Hence, it is also possible to use product differentiation to gain a competitive advantage. One type of differentiation is offering training of the product included in the scope of supply. The building up of differentiators by using variables such as simplicity, durability, productivity, running cost and reparability is one example.
As Grant underlines (2005 p.275), it is necessary to understand the difference between differentiation and segmentation. If the definitions are not clear, it is easy to mix them up and make wrong conclusions and decisions.
3.1.7. EVC ANALYSIS
The intention of the Economic Value to the Customer analysis, EVC analysis, (Jobber & Fahy, 2006, p.199) is to keep the price of products and services at a level that maintains the customer’s perceptions and needs. Many businesses striving after high value pricing offering
superior value compared to a competition with low production costs trying to make as good revenue as possible.
The EVC analysis investigates the value that the product and service gives the customers. A high EVC can mean that the customer revenue is increased due to its operation costs and decreased, by e.g. start up costs, less maintenance or production costs. EVC can be in favour of the competition.
3.1.8. TOTAL COST OF OWNERSHIP
Total cost of ownership (Wikipedia), often named TCO, was invented by Bill Kirwin and is a tool used to investigate the directly related and indirectly related costs of owning a product. Direct costs refer to capital costs and labour costs, and indirect costs refer to costs depending on availability and downtime.
3.2. THEORETICAL APPROACH
In this study the MIO model is used (APPENDIX B: MIO Model matrix). With this matrix build-up and with each matrix box using necessary tools for best identifying specific businesses, the material is in place to create a valuable marketing plan.
Present situation:
MIO analysis in the present situation combined with PESTEL analysis (Carpenter & Sandler, 2007, p.91–94) as extensions of Market study and Marketing Mix analysis 7P (Borden, 1964) will provide deeper analytical information to the next step in MIO work.
Present situation – Market:
As Carpenter and Sandler (2007, p.92) mentioned in Strategic Management, the PESTEL analysis has three steps:
1. Investigate the relevance of each PESTEL factors. 2. Analyze and categorize each factor.
3. Make conclusions.
For the evaluation of small wind power stations in the Swedish market, questions can be answered in Customers, Competitions and PESTEL analysis.
To understand customer’s behaviour and requirements, it is essential to be successful in the business and to understand competitors and their maneuvers. It is also essential to understand the political environment and to be able to have business knowledge of how taxation will influence the purchase of small wind power stations, as well as the legal requirements of the products and their usage.
Economic aspects must also be evaluated regarding the value of the products how much the customers are willing to pay.
Socio-cultural aspects concerning the customer’s perceptions of small wind power stations, as well as how communities react in the areas where the wind power station will be placed, are of great importance.
Technological aspects are important factors in gaining the customer’s acceptance of small wind power stations, as required services must be satisfactory.
Environmental aspects and concern are a trend in Sweden, and partly, the rest of the world. This can also play a role in determining and encouraging purchasing power.
Legal and legislation aspects in Sweden and the EU effect the situation for small wind power stations.
Present situation – Interaction:
The product can be a material thing the customer paying for, it can be a service that the customer paying for or it can be a combination of both. The scope of a product consists of several features such as, variation, quality, design, brand, packaging, sizes, services, warranties, and returns. Depending on the product’s features, the scope has a variety of complexities.
Price includes the list price, discounts, allowances, payment period, and credit terms.
Promotion is the tool that attracts the customer of certain product or products and it consist of sales promotion, advertising, sales force, public relations, and direct marketing. Place is how and where the product or products shall be present. Place includes channels, coverage,
assortments, locations, inventory, and transport. People are the most important element of any service or experience. Services tend to be produced and consumed at the same moment, and aspects of the customer experience are altered to meet the customer’s needs while consuming. As customers purchase from sellers that they trust, the skills and appearance of all staff need to be first class through – training, personal selling and customer service. Physical evidence is the material part of a service. Strictly speaking there are no physical attributes to a service, so a consumer tends to rely on material cues only. There are many examples of physical
dispatch notes) and brochures. Process is the perception of the concepts within the business and marketing activities, as they deliver value through other elements of the marketing mix.
Present situation – Organisation:
Competence is essential to enter, maintain or expand a business. The capacity of a organisation must be on a level to meet the market needs and competitors. Mission, the “declaration of what the firm is and what it stands for (Carpenter & Sandler, 2007, p.39), is fundamental of the organisation’s values and its purpose is to provide a target for the business.
Opportunity analysis:
As described in Mind Map Marketing (Eriksson et. al., 2004, p25) MIO fits Porter’s five forces model (Porter, 1980) in MIO model as well as an opportunity analysis, but because this study targets an entrance, the five force model is preferably used in the opportunity analysis phase.
Opportunity analysis – Market:
The targeted segment of small wind power stations must be evaluated regarding their ability of gaining market share, the existence of future market value and the buying power of potential customers.
Furthermore, threats from competitors, the businesses rivalry (Carpenter & Sandler, 2007, p.99), new entrants, how the segment should be entered, substitutes, the products or services from other industries that can fulfill or satisfy the customer’s needs in segments, as well as any other product or service that can be classified as an alternative solution and
complementors, must be evaluated in order to broaden the portfolio or extend the offered value of the product or service.
Opportunity analysis – Interaction:
To understand what type of products and services are expected from customers it is essential to create the best offering. The best offer shall be communicated to customers in order to make them aware of the firm and offering. The availability must be communicated. The customer’s willingness to pay reflects the market value of small wind power stations, which g limits the customer’s price based on adequate pay back calculation for the customers. The firm’s net income is also related to the purchasing costs, which are related to the supplier power, availability of products and market share.
Opportunity analysis – Organisation:
The organisation’s Strengths and Weaknesses must be analyzed in order to see the opportunities and possibilities.
Strategic choices
Strategic choices – Market:
As the segment is defined by the title in this thesis, the strategic choice is to position the entering firm’s product in the business. Positioning a rather new business demands good knowledge of the customer’s behaviour, needs and purchasing strength.
Strategic choices – Interaction:
When the strategic market is chosen, the choice of product model with its pricing model is essential in order to match the demands, with right branding (Jobber & Fahy, 2006, p.141 – 151), to the customer’s behaviour. To distribute and communicate the product’s messages, a network of alliances (Carpenter & Sandler, 2007, p.161) between dealers or distributors, or a separate sales and service organization is required. Initially, with smaller firms, it is more common to use dealers.
Strategic choices – Organisation:
Strategic Business Unit, SBU, is a separate organizational unit in a corporate firm that runs a business line or segment with a complete strategy (Carpenter & Sandler, 2007, p.125; Jobber & Fahy, 2006, p.327; Wikipedia). Small wind power stations could be a SBU in a larger firm such as Vestas (Vestas), while a firm such as Hannevind Vindkraft AB (Hannevind) is a complete business is small wind power stations.
To ensure new organisations meet the demands from the new business, investments are required. To be able to interest investors, a profitable business case is required showing an attractive Return of Investment (ROI), and eventually it may be necessary to create an alliances Carpenter & Sandler, 2007, p.201).
Action Programs
Action Programs – Market:
The target market is to select the target individuals, customer or customers in each segment that meet a selected level. In the case of small wind power stations, the customer is required to have the possibility to build the station on their own or rented land where there are favorable conditions for wind power.
Action Programs – Interaction:
The strategy of each defined segment shall be to target through undifferentiated marketing, differentiated marketing or concentrated marketing. Due to how the product portfolio should match the market, one or several marketing mixes can be used to meet the segments.
Action Programs – Organisation:
The implementation of the new mission and its targeted customers marketing mix, demands one or several projects to meet demands.
Each project shall have project specification, including a project plan, with time and resource planning and budget gates where defined status targets shall be followed up.
After implementation it is essential to follow up and analyze if the forecasted results have been achieved.
PART III: EMPIRICAL STUDY
To obtain an understanding of what information is necessary to collect; one has to have basic knowledge of how a wind power station generates energy and the main factors that influence the outcome. In this thesis, deeper theories will be handled only in brief discussions of the main parameters. For those whom required deeper understanding, it is recommended to read Aerodynamics of Wind Turbines (Hansen, 2008).
The most important factor of energy from wind power is the availability of wind, preferable laminar wind. Laminar wind is important due to the fact that turbulent wind (Wizelius, 2007, p.62 – 65) causes less energy transformation to kinetic energy in wind power stations, as well as it causing higher stresses on the equipment. This heightens the risks of maintenance and repair costs and a lower life cycle of the equipment. The geographical placement of the wind power station, such as sea, lake, field, forest, mountains buildings and others (Bergström, 2008, p.8; Larson, 1985, p.13; Wizelius, 2008, p.61) makes a huge impact on energy out come. To get high average laminar wind, geographical placement must be as close as possible to environments that do not disturb the wind, such as in or close to sea. Another alternative is to build the wind power station with high tower. When you increase height, the impact of the geographical roughness is reduced (Bergström, 2008, p.20-22) and at a certain level, which is not applicable on this segments wind power station sizes, the impact is minimal. This is called geotropical wind (Wizelius, 2007, p.54 – 56)
As the energy outcome is proportional to the wind speed (APPENDIX A: Basic calculations of wind power energy), it is essential to analyze the placement deeply before any additional actions is taken.
4. DATA COLLECTION
This data collection in this thesis consists only of data available in literature and on the Internet. No organised survey had been conducted due to the set-up model of thesis and it should be suitable for other markets were no competition or existing customer base exists.
4.1. CUSTOMER
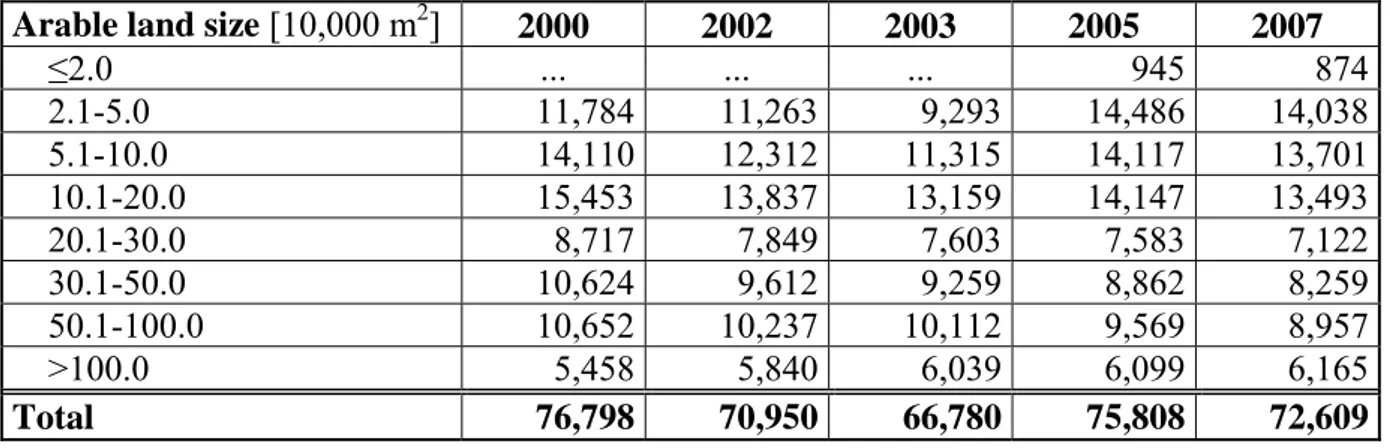
The most potential customers for small wind power stations are landowners with lands that are arable. There are other alternatives for non-land owners can be to rent land for a certain period of time, as long as the wind power stations life cycle or untill expected net income is achieved (Wizelius, 2007, p.363). In the end, there is a viability of proper areas to set up the station. This is normally on arable land or close to open water. Table 3: Agricultural per arable land size (SCB, 2008) gives an indication of the number of people that can be a basis of a survey to discover the interest of investing in small wind power stations.
Arable land size [10,000 m2] 2000 2002 2003 2005 2007
≤2.0 ... ... ... 945 874 2.1-5.0 11,784 11,263 9,293 14,486 14,038 5.1-10.0 14,110 12,312 11,315 14,117 13,701 10.1-20.0 15,453 13,837 13,159 14,147 13,493 20.1-30.0 8,717 7,849 7,603 7,583 7,122 30.1-50.0 10,624 9,612 9,259 8,862 8,259 50.1-100.0 10,652 10,237 10,112 9,569 8,957 >100.0 5,458 5,840 6,039 6,099 6,165 Total 76,798 70,950 66,780 75,808 72,609
Table 3: Agricultural per arable land size (SCB, 2008)
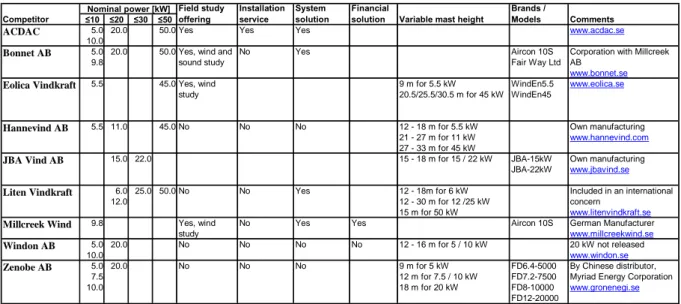
4.2. COMPETITION
In Sweden, the following competition currently exists in the targeted segment of small wind power stations 5 – 50 kW (Google, 2008):
≤10 ≤20 ≤30 ≤50
ACDAC 5.0
10.0
20.0 50.0 Yes Yes Yes www.acdac.se
Bonnet AB 5.0 9.8
20.0 50.0 Yes, wind and sound study
No Yes Aircon 10S
Fair Way Ltd
Corporation with Millcreek AB
www.bonnet.se Eolica Vindkraft 5.5 45.0 Yes, wind
study 9 m for 5.5 kW 20.5/25.5/30.5 m for 45 kW WindEn5.5 WindEn45 www.eolica.se Hannevind AB 5.5 11.0 45.0 No No No 12 - 18 m for 5.5 kW 21 - 27 m for 11 kW 27 - 33 m for 45 kW Own manufacturing www.hannevind.com
JBA Vind AB 15.0 22.0 15 - 18 m for 15 / 22 kW JBA-15kW JBA-22kW Own manufacturing www.jbavind.se Liten Vindkraft 6.0 12.0 25.0 50.0 No No Yes 12 - 18m for 6 kW 12 - 30 m for 12 /25 kW 15 m for 50 kW Included in an international concern www.litenvindkraft.se Millcreek Wind 9.8 Yes, wind
study
No Yes Yes Aircon 10S German Manufacturer
www.millcreekwind.se Windon AB 5.0
10.0
20.0 No No No No 12 - 16 m for 5 / 10 kW 20 kW not released
www.windon.se Zenobe AB 5.0 7.5 10.0 20.0 No No No 9 m for 5 kW 12 m for 7.5 / 10 kW 18 m for 20 kW FD6.4-5000 FD7.2-7500 FD8-10000 FD12-20000 By Chinese distributor, Myriad Energy Corporation
www.gronenegi.se Brands / Models Comments Competitor Installation service Financial solution Nominal power [kW] Field study
offering
System
solution Variable mast height
Figure 2: Competitor analysis (Respective firm’s home page, 2008)
Other relative competitors, complementors (Carpenter & Sandler, 2007, p.104) are not discussed in the study.
4.3. LEGAL
In this thesis there will be no deeper investigations of legal aspects, but it is worth mentioning that there are resources on the internet that help investigate where wind power station may be placed in consideration to the interest of state, the environment and protected areas.
Furthermore, because Sweden has fully adopted EU legislation, all products and services must fulfil these requirements.
Wizelius (2007) handles many legal aspects, and it is recommendable to read “Vindkraft i teori och praktik” for a better understanding.
4.4. STATISTICAL DATA
There are a number of different sources for statistics. In this study, the main sources have been from other statistical surveys found on the Internet and in literature.
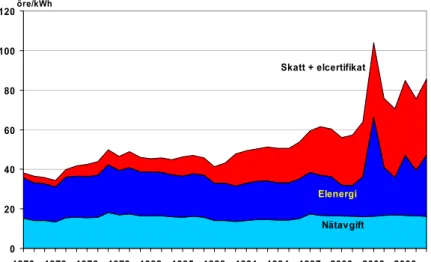
4.4.1. ELECTRICAL COST DEVELOPMENT
In Figure 3: Electrical cost development (Svensk energi, 2008), the price development for end customers of electricity 1970 – 2008, by viewing the net fee “Nätavgift”, electrical energy fee “Elenergi” and tax + electricity certificate “Skatt + elcertifikat”.
0 20 40 60 80 100 120 1970 1973 1976 1979 1982 1985 1988 1991 1994 1997 2000 2003 2006 Elenergi Nätavgift Skatt + elcertifikat öre/kWh
Figure 3: Electrical cost development (Svensk energi, 2008)
The distribution cost, net fee and the electricity energy cost up until 2002 has been more or less constant, but taxation and electricity certificates have been increasing consistently since 1998.
4.4.2. WIND STATISTICAL DATA
University of Uppsala (LUVA) has mapped the annual average wind speed in Sweden on the three heights of 49m, 72m and 103m by using the wind mapping method MIUU-model (Bergström, 2008) This data is available on the internet with the accuracy of average wind speed per square kilometre (Δm/s / km2).
Figure 4: Average annual wind speed by MIUU method (Bergström, 2008)
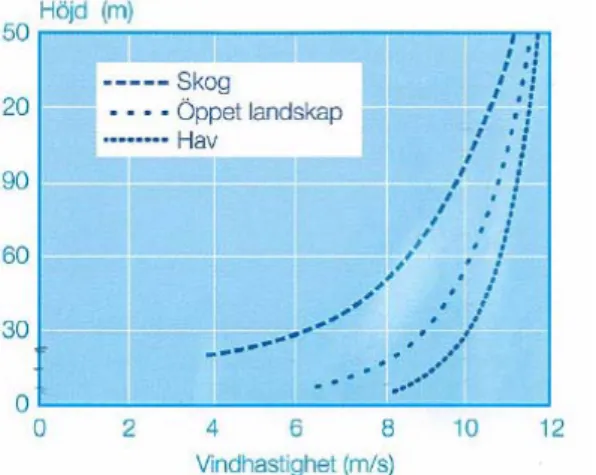
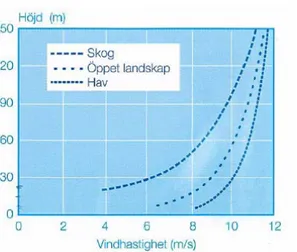
Energimyndigheten (2007, p.15) had made a simplified description of the wind speed at various heights and the geographical conditions of; ocean, arable and forests, as seen in
Figure 5: Wind speed at different heights (Energimyndigheten, 2007).
5. EMPIRICAL STUDY
To evaluate the economic aspects of investments in small wind power stations, it is necessary to make calculations based on different scenarios where the variable wind speed and wind power station sizes varies. This is in order to calculate the net income and compare that to payback calculations where total cost of ownership can vary.
5.1. TOTAL COST OF OWNERSHIP
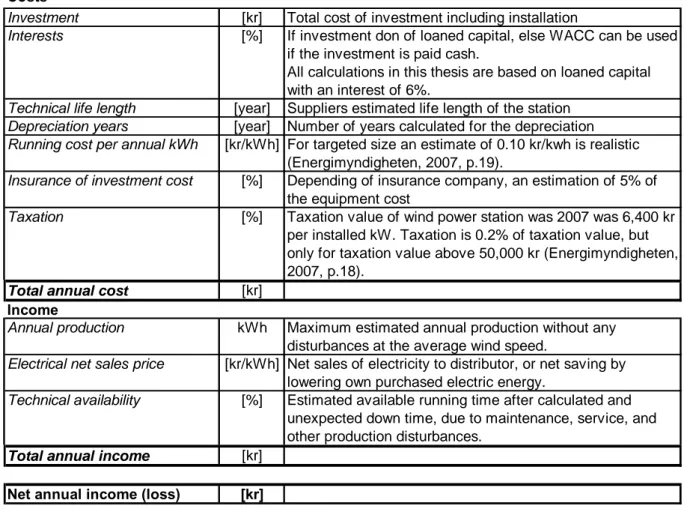
Total cost of ownership is the sum of costs such as the interest of investment, depreciation, wind availability and running costs (including maintenance and service costs), insurances, land rental costs, net fee, administrative costs, taxations, VAT, as well as income including total electrical price level that include; electrical net price, electrical certificate and
Costs
Investment [kr] Total cost of investment including installation
Interests [%] If investment don of loaned capital, else WACC can be used if the investment is paid cash.
All calculations in this thesis are based on loaned capital with an interest of 6%.
Technical life length [year] Suppliers estimated life length of the station
Depreciation years [year] Number of years calculated for the depreciation
Running cost per annual kWh [kr/kWh] For targeted size an estimate of 0.10 kr/kwh is realistic (Energimyndigheten, 2007, p.19).
Insurance of investment cost [%] Depending of insurance company, an estimation of 5% of the equipment cost
Taxation [%] Taxation value of wind power station was 2007 was 6,400 kr per installed kW. Taxation is 0.2% of taxation value, but only for taxation value above 50,000 kr (Energimyndigheten, 2007, p.18).
Total annual cost [kr]
Income
Annual production kWh Maximum estimated annual production without any disturbances at the average wind speed.
Electrical net sales price [kr/kWh] Net sales of electricity to distributor, or net saving by lowering own purchased electric energy.
Technical availability [%] Estimated available running time after calculated and unexpected down time, due to maintenance, service, and other production disturbances.
Total annual income [kr]
Net annual income (loss) [kr]
Table 4: Total Cost of Ownership calculation template (Johansson, 2008)
5.2. WIND SPEED IMPACT ON POWER OUTCOME
The wind speed can be seen as a function of height above ground and geographical conditions. This relation differs in different areas, but using empirical calculations, a ratio can be obtained as a function of height and geographical position; ocean, arable and forest with values from
either Figure 4: Average annual wind speed by MIUU method (Bergström, 2008) or
Figure 5: Wind speed at different heights (Energimyndigheten, 2007).
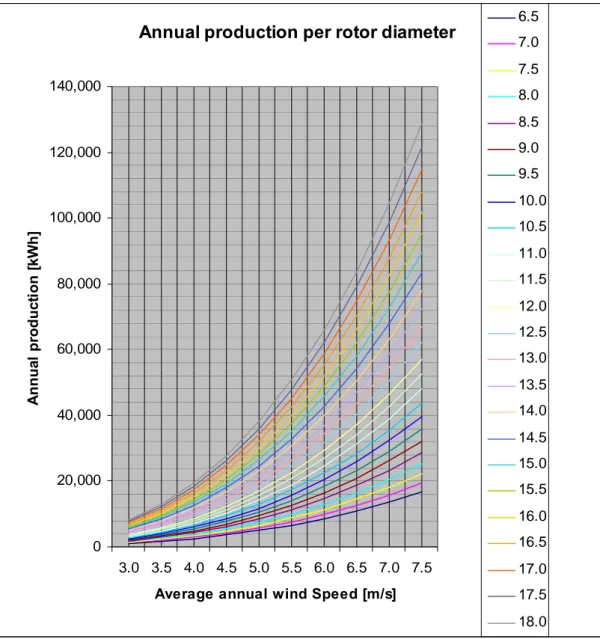
By using the formula in APPENDIX A: Basic calculations of wind power energy can be adjusted by estimating that the wind power station reaches maximum power at 12 m/s in normal conditions7 following that annual production is reach at a different annual wind speeds and rotor diameters.
All production calculations are based on the theoretical model in APPENDIX A: Basic calculations of wind power energy, but have been adjusted according to recent levels of current wind power stations on market. The adjustment factors are Cp set to 40% and efficient factor to 14.7%.
Average annual wind speed has the biggest impact on the outcome of a wind power station as annual production is proportional to wind speed, which is illustrated in Figure 6: Wind speeds impact on annual production (Johansson, 2008).
Annual production per rotor diameter
0 20,000 40,000 60,000 80,000 100,000 120,000 140,000 3.0 3.5 4.0 4.5 5.0 5.5 6.0 6.5 7.0 7.5
Average annual wind Speed [m/s]
A nnua l pr oduc ti on [ kW h ] 6.5 7.0 7.5 8.0 8.5 9.0 9.5 10.0 10.5 11.0 11.5 12.0 12.5 13.0 13.5 14.0 14.5 15.0 15.5 16.0 16.5 17.0 17.5 18.0
Figure 6: Wind speeds impact on annual production (Johansson, 2008)
5.3. ELECTRICAL PRICE COST IMPACT ON NET INCOME
Electricity price levels are directly proportional to the gross annual income, and are also the parameters that customers have less impact on. There are only two alternatives:
1. Sell to the distributor instantly. This alternative is the most common when the annual production is higher than consumption.
2. Use the electricity produced and sell the overflow to distributors and buy when needed from distributor. This alternative is possible when the production capacity is lower or on
the same level as personal consumption. Of course, this depends greatly on the distributors.
Annual income per production capacity and electrical price
0 kr 20,000 kr 40,000 kr 60,000 kr 80,000 kr 100,000 kr 120,000 kr 10,0 00 20,00 0 30,0 00 40,00 0 50,0 00 60,0 00 70,00 0 80,0 00 90,00 0 100, 000 Annual production [kWh] A n na ul gr os s i n co m e [ kr ] 0.50 0.60 0.70 0.80 0.90 1.00 1.10 1.20
Figure 7: Gross annual income (Johansson, 2008)
The Figure 7: Gross annual income (Johansson, 2008) and Figure 8: Annual running cost (Johansson, 2008) clearly shows the level of investment needed for a favorable return.
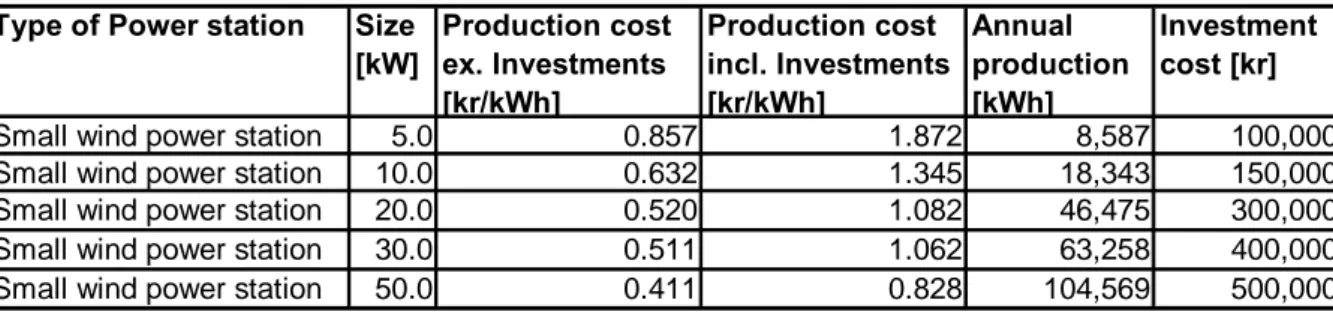
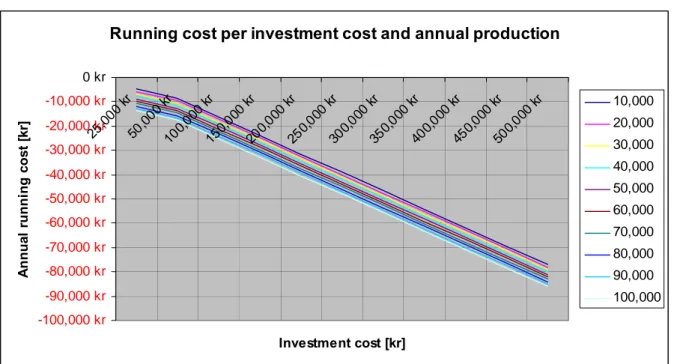
5.4. ANNUAL PRODUCTION COST IMPACT
The running cost is mostly based on the investment cost. In all figures the annuitant method is used for payback calculation. This calculation is based on Table 4: Total Cost of Ownership calculation template (Johansson, 2008) preset values.
Type of Power station Size [kW] Production cost ex. Investments [kr/kWh] Production cost incl. Investments [kr/kWh] Annual production [kWh] Investment cost [kr]
Small wind power station 5.0 0.857 1.872 8,587 100,000
Small wind power station 10.0 0.632 1.345 18,343 150,000
Small wind power station 20.0 0.520 1.082 46,475 300,000
Small wind power station 30.0 0.511 1.062 63,258 400,000
Small wind power station 50.0 0.411 0.828 104,569 500,000
Running cost per investment cost and annual production
-100,000 kr -90,000 kr -80,000 kr -70,000 kr -60,000 kr -50,000 kr -40,000 kr -30,000 kr -20,000 kr -10,000 kr 0 kr 25,0 00 k r 50,0 00 kr 100 ,000 kr 150 ,000 kr 200, 000 kr 250, 000 kr 300, 000 kr 350, 000 kr 400, 000 kr 450, 000 kr 500, 000 k r Investment cost [kr] A n nua l r u nn in g c o st [ kr ] 10,000 20,000 30,000 40,000 50,000 60,000 70,000 80,000 90,000 100,000
Figure 8: Annual running cost (Johansson, 2008)
5.5. BREAK EVEN WITH TOTAL COST OF OWNERSHIP MODEL
As different sizes of wind power stations can produce the same annual energy output, it is necessary to analyze the optimal size of the input parameters electrical price and wind speed. The field study measurement in combination with the expected annual energy requirements reduces the options of sizes, as annual production is proportional to average wind speed, Figure 6: Wind speeds impact on annual production (Johansson, 2008).
Furthermore, the expected return of invested capital reduces options even more, especially if the invested capital is loaned. In all calculations, capital is loaned with an interest of 6%, see Table 4: Total Cost of Ownership calculation template (Johansson, 2008).
In the Figure 9: Total Cost of Ownership break even analysis (Johansson, 2008), the
breakeven point is visualized, which gives the indication of how much investment is needed corresponding to the size of the wind power station.
Brake even by Total Cost of Ownership
0 kr 10,000 kr 20,000 kr 30,000 kr 40,000 kr 50,000 kr 60,000 kr 70,000 kr 80,000 kr 90,000 kr 100,000 kr 0.50 0.60 0.70 0.80 0.90 1.00 1.10 1.20 Energy price [kr/kWh] A n n u al ne t ope ra ti on in co me [ kr ] -100,000 kr -90,000 kr -80,000 kr -70,000 kr -60,000 kr -50,000 kr -40,000 kr -30,000 kr -20,000 kr -10,000 kr 0 kr A n n u al f ixed co st s [k r] 10,000kWh 20,000kWh 30,000kWh 40,000kWh 50,000kWh 60,000kWh 70,000kWh 80,000kWh 90,000kWh 100,000kWh 50,000 kr 100,000 kr 150,000 kr 200,000 kr 250,000 kr 300,000 kr 350,000 kr 400,000 kr
Figure 9: Total Cost of Ownership break even analysis (Johansson, 2008) Example:
The required production level to meet household needs is 20,000 kWh and the measured wind speed in the location of the eventual wind power station is 6.0 m/s at a height of 20 m and 6.5 m/s at 40 m above ground. The investment will be financed by a loan with an interest rate of 6%. The payment by distributor is 0.50 kr/kWh if all electricity is delivered and current purchase levels are 1.10 kr/kWh. Then break even is accepted.
If all electricity is sold to the distributor, the wind power station needs to produce a net annual income of 22,000 kr to cover the purchase level. This means that at 6.0 m/s the annual
production volume needs to be 60,000 kWh to cover the costs. From this, the size is chosen from Figure 10: Nominal power of wind power stations (Johansson, 2008), and at 6.0 m/s it is seen that 50 kW does not covers the needs. The alternatives here are to:
1. Increase the average speed by a higher tower, or 2. Consume all electrical power directly.
The height had to be increased to 6.5 m/s for a 50 kW size to cover the need.
By consuming all of the energy produced, the value is 1.10 kr/kWh and a minimum size of 15kW is sufficient. If a loan is taken to cover the costs, the maximum annual costs will be 20,800 kr with 6% interest 125,000 kr.
5.6. COMMERCIAL SIZES OF WIND POWER STATIONS
By comparing today’s commercial small wind power station market with the above tables the following is seen, Figure 10: Nominal power of wind power stations (Johansson, 2008). This is based on a maximum production of 12.0 m/s with 95% technical availability.
Annual production per rotor diameter
0 100,000 200,000 300,000 400,000 500,000 600,000 3.0 4.0 5.0 6.0 7.0 8.0 9.0 10.0 11.0 12.0
Average annual wind Speed [m/s]
A n n u a l pr oduc ti on [ k W h ] 5 kW (6.5 m) 10 kW (9.5 m) 20 kW (12.0 m) 30 kW (14.0 m) 50 kW (18.0 m)
Figure 10: Nominal power of wind power stations (Johansson, 2008)
6. ANALYSIS
The analysis puts the collected data and empirical study into the theoretical approach in order to evaluate the value and potential of the market related to the thesis question.