GOTLAND UNIVERSITY
Wind Power Potential in
Palestine/Israel
An investigation study for the potential of wind
power in Palestine/Israel, with emphasis on the
political obstacles
Yousre Odeh 6/6/2011
Advisor for Wind Resource Assessment Section Dr. Bahri Uzunoglu
Advisor for Political Situation Assessment Section Liselotte Aldén
Examiner Ph.D. Stefan Ivanell
ii
Abstract
Wind resource assessment studies have been conducted in the Israeli side and the Palestinian side before; however, the previous studies were restricted with the political border either Palestinian or Israeli except one of them that was based on measurements dated to 1940-1983 (R. Shabbaneh & A. Hasan, 1997). Moreover, the studies were performed years ago, with simple techniques and based on old data (R. Shabbaneh & A. Hasan, 1997). Hence, the needs for a new study that is based on updated data, and using updated model is highly demanded. This study is intended to perform wind resource assessment in Palestine/Israel; the study has used two stages of assessment, primary one based on reference station data on both sides, Israeli and Palestinian. The second stage of wind resource assessment is based on WindPRO software. The wind resource assessment ends up with identifying sites with higher potential that are situated in four selected sites, North of Palestine/Israel, North of West-bank, Jerusalem, and Eilat, the higher potential was in Eilat area bearing mean wind speed of 9.88m/s at 100 m hub height.
Moreover, the study recognized the importance of political situation assessment due to the Israeli-Palestinian conflict. Based on conducted survey, the political situation assessment concluded that international non-governmental organizations seem to be most capable of starting up wind power project in Palestine/Israel. Furthermore, the study concluded that supportive policies from both the Israeli and Palestinian governments are crucial to promote wind power projects in the region.
Keywords: Wind resource assessment, land breeze, sea breeze, wind fluctuation, wind frequency rose, diurnal wind profile, correlation matrix, West-bank, Palestine, Israel, wind profile, Israeli-Palestinian
iii
Acknowledgments
I would like to thank Arava institute for Environmental studies for connecting me with professionals who were working directly with Air Quality Mentoring project in Israel. I also would like to thank COMET-ME organization for providing me with wind measurements from Hebron. I am extremely thankful for Suleiman Halasah, Project Manager at Shamsun Power Company, for his support with literature resource. I also would like to express my appreciation for Dr. Ahmad Ghazawni for his remotely guidance in online survey. I also would like to thank Arava students and alumni for assisting my research with filling online survey. I would like to thank my two supervisors Dr. Bahri Uzunoglu and Liselotte Aldén for support, guidance, and unlimited efforts that they made to have this study done.
iv
Contents
Abstract... ii
Acknowledgments ... iii
Introduction ... 1
Limitation and de-limitation ... 2
Section 1: Wind Resource Assessment (WRA) ... 3
Background of (WRA) in Palestine/Israel ... 3
Theory of (WRA) ... 5
Wind Formation ... 5
Wind Fluctuation ... 6
Identifying Wind on Site ... 7
Analysis of Wind Data ... 7
Framework of (WRA) ... 8
Methodology of (WRA) ... 9
Primary WRA Method ... 9
Secondary WRA Method ... 11
Analysis of (WRA) ... 13
Findings ... 18
North of Palestine/Israel ... 18
North of West-bank ... 20
Jerusalem and the Center ... 23
Eilat Area ... 26
Section 2: Political Situation Assessment ... 30
Background Information for Political Assessment ... 30
Theoretical Framework of Political Assessment ... 31
Political Situation Assessment Method ... 32
Political Assessment Analysis ... 34
Survey Data Analysis ... 34
Participants Information ... 34
Survey Discussion ... 35
Conclusion... 37
v
Bibliography ... 39
List of Figures ... 41
Acronyms ... 43
1
Introduction
Last few decades, an extensive progress of the wind power was noticed in the world. The progress of wind technology was significantly visible in European countries and developed countries, while developing countries are slow to follow the progress. Palestine considered as developing country due to its humble capabilities. Furthermore, the country has been suffering from conflict for decades and the land now being divided into Israeli and Palestinian territories. As a result, two income levels exist in the same region, one is very developed within the Israeli borders, comparable to the European standards, while the Palestinian territories considered lower standard. The gap between two levels requires different development policy and different planning requirements for exploiting available resources. The aim of this project is to study the potential of wind power resources in both Palestine and Israel. Furthermore, the project will shed the lights on the difficulty of political situation, as well as it will suggest practical solution to overcome the political conflict barriers for development projects.
The importance of the research lay down on the fact that this research is mapping the wind resources in Palestine/Israel neglecting the political borders using recently issued version of WindPRO software. Moreover, the value of the project is based on the fact that is being built on the base of updated data that has been collected in the period of 2001-2006. Furthermore, the study will emphasize on the political obstacles for wind power projects, and it will suggest realistic solutions based on a survey conducted by different nationalities targeted group.
The study will be presented in two sections after limitations of the study being exposed; the first one is wind resource assessment that has been supervised by Dr. Bahri Uzunoglu. The second section is political situation assessment that has been supervised by Liselotte Aldén.
2
Limitation and de-limitation
Data from Israel is not covering places that are expected to have high potential, neither data time series are available from Palestinian stations. International data like NCAR, METAR. SYNOP and QSCAT will be used; however, the local data will be analyzed and used to identify high correlations.
Height of the anemometer in both data set from Palestine and Israel is not defined, therefore, the local data will be restricted for correlation purposes to find other stations with same potential.
Resource map generating is time consuming, therefore, only selected sites will be mapped.
It was not possible to identify all the high potential sites because of the limitations of reference stations.
The used survey contains questions to gain information about the local acceptance in Israel from different students, beside the objective of finding a realistic solution for building wind projects, however, the result of answers expected to be in favor of wind power, as the students all belong to environmental studies, and aware of the climate issue caused by CO2 emission. Therefore, the result that related to local acceptance will not be countable, however, constrains will be upon the questions that has to deal with the political conflict and the proposed solutions.
Expected participants number was around 300, as surveys had to be deployed by administration office. Unfortunately, the permission for conducting the survey through administration has to go through systematic procedure that needs some times, because the limited time available, as an alternative, the survey has been sent to a selected people belongs to the institute around 150. 37 people managed to fill the survey.
Number of participants in the survey was relatively low compared with the expected number, this reason increase the uncertainty of the result.
3
Section 1: Wind Resource Assessment (WRA)
Background of (WRA) in Palestine/Israel
The process of exploring wind potential in Israel has started early in 1980 by Manes, Rindsberger , and Segal, in their study they computed the seasonal and the annual mean wind speeds for many stations in Israel, furthermore, they computed the wind frequency roses of these stations (A.Manes, M. Rindsberger & L. Segal, 1980).
In 1986 surveys were conducted by Druyan, intended to cover 10,000 of square kilometers in the desert of the Negev (L. Druyan, V. Goldreich & Z. Maximov, 1986). The field surveys were based on direct measurements on some selected sites, observation using hand held anemometers. Moreover, the observations was followed by automatic measurement stations at some selected site and compared with data was taken from meteorological stations in the Negev (L. Druyan, V. Goldreich & Z. Maximov, 1986).The study considered to be further step for wind resource assessment in Palestine/Israel as the roughness and topology were considered.
The study has recommended ten sites in the Negev area for further investigations, however, the study stressed associated logistic issues, as some of these sites are mountain ridges had no access roads; some others were used as military zones, or natural reserves (L. Druyan, V. Goldreich & Z. Maximov, 1986). Therefore, the final word left held by the Israeli intra-government’s deliberation of facilitating further investigation in the Israeli side.
Further study was proposed by Shabbaneh and Hasan in 1997, based on data collected from 49 over Palestine/Israel (R. Shabbaneh & A. Hasan, 1997). The data from Israeli meteorology stations were over the period of 1972-1983, additional data from Palestinian territories including Gaza strip were over the period of 1940-1947 (R. Shabbaneh & A. Hasan, 1997). The study not only drew the wind potential contour in the Palestinian territories, but also included a feasibility study for the effectiveness of investing in wind power for generating wind electricity in comparison with diesel stand-alone generators and the payback years (R. Shabbaneh & A. Hasan, 1997). The study considered the local topography and roughness classes (R. Shabbaneh & A. Hasan, 1997). The study has significance importance for finding alternative solutions for Palestinians.
However, as the used data were collected over two different periods, probably different standards were being used in the two periods, which can impact accuracy of the data. Furthermore, since the time of
4
study 1997, the wind power technology has developed; new wind resource assessment techniques have been introduced to assist accurate wind power estimation.
In 2003, another study was proposed by Furshpan, Setter, and Rubin. The study investigated the potential of wind power in the southern side of Israel “the Negev” (A. Furshpan, I. Setter & S. Rubin, 2003). Collected data from 24 stations were used in this study. The study has used detailed topographic maps indicated detailed information about roughness length and nearby obstacles. For most of the Negev area, the mean wind velocity and power were mapped at 50 meter heights (A. Furshpan, I. Setter & S. Rubin, 2003). The importance of this study is that it has used more advanced models for wind resource assessment; however, this study still had some limitations.
Some sites were excluded due to the complexity of terrain or the lack of measurements data. Furthermore, the study recommended establishing more stations in suggested areas in the Negev with high potential of wind power such as, the high Negev Mountains, the southeast Judea Mountains, Eilat Mountains, and the Eilat Bay. The suggested stations are highly recommended to use the same type of anemometer, and the wind speed to be measured at the same height (A. Furshpan, I. Setter & S. Rubin, 2003).
In terms of wind power projects in Israel/Palestine, a project was established in the Golan Height close the border with Syria, ten turbines were installed in 1993, with accumulated rated capacity of 6 MW (R. Shabbaneh & A. Hasan, 1997), there was news recently of granting permissions for repowering this project via Korean company (Quilter, 2010). In the north of West-bank, in settlement called Jalboa’, close to the Palestinian-Israeli border, a single wind turbine installed on the site for test. Also, recent news indicated that a wind farm might be constructed there; however, resources also said the project was shut down by an environmentalist group (Israeli Ministry of Environmentl Protection , 2009). In south of West-bank, close to Jerusalem area, in a place called Susya, small scale wind projects were established there for helping the Bedouin community to maintain their life normally by Comet-MT organization (Comet-ME, 2009).
5
Theory of (WRA)
Wind FormationSolar energy, considered to be the source for most of the renewable energy, as the earth receives KW of power as a solar radiation (Mathew, 2006). Received energy heating up the surface of the earth in different levels depends on radiation angel toward the surface and surface type. For example, radiation intensity is higher in the equator area as the sun radiation is directly perpendicular to the earth than it is in the two poles. Higher intensity of radiation on the equator warms up the earth surface, as the temperature increasing for the surface and the air, the density of the air became lighter. The light air rises up in the space for certain latitude and spreads around. This process drops the pressure in the area, and attracts cold air from two poles to substitute the air, and to cool down the surface, wind produced in this process called global wind or geotropic wind (Mathew, 2006).
The same previously described principle is followed to form regional wind when the solar radiation heat up onshore and offshore adjacent areas. Onshore reacts to the radiation faster than offshore area, when the air close to onshore surface heated up, it became less dense compared to that one close to offshore, air with
less density rises, spreads around, and reduces the pressure, see Figure 1.
The process results to attract
cold air from offshore to cool down onshore area, this process is reversed in the night time when both onshore and offshore start cooling down. This process forms the so-called sea breeze and land breeze respectively (Mathew, 2006). Wind speed and direction is also being affected by the local formation of the land, terrain complexity, and obstacles (J.F. Manwell, J.G. McGowan & A.L. Rogers, 2002).
Coriolis force is one of those effecting forces. It is affecting the flow of any wind that flowing from any of the poles of the earth to the equator. This force is generated due to the rotation of the Earth, the force results to deviate the direction of the wind from the destination point (M. Lange & U. Focken, 2006).
Figure 1: Sea breeze during the daytime, land breeze during the nighttime (Nelson, 2009).
6
Wind Fluctuation
As the wind moving from a certain point to another, the wind speed might be changed due to different forces affecting its flow beside the local topography. Wind fluctuation can be variable hourly, daily, seasonally, or even annual
base.
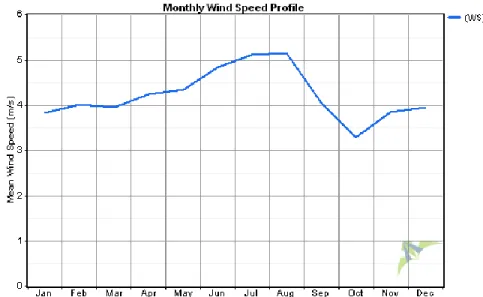
As example, Monthly wind speed profile is shown in Figure 2 for Carmiel station, the seasonal change of wind speed as described in Mathew’s book is due to variation of daylight caused by the earth’s tilt and elliptical orbit (Mathew, 2006).
Moreover, wind speed might vary as you can see in the diurnal curve of the same station (Carmiel) in Figure 3. The major reason of the diurnal variation is due to the difference of the temperature between the sea and land surface (Mathew, 2006). The diurnal variation can be advantageous for wind power production during the daytime as the demand for power is more in the daytime than nighttime (Mathew, 2006). Therefore, the process of collecting measurements
for any resources assessment process should be at least one year, ten minutes sample rate is very common to be used, although some data is for more than ten minutes sample rate (Mathew, 2006).
Figure 2: Monthly wind speed profile in Carmiel station according to data granted to the author.
Figure 3: Diurnal wind speed profile in Carmiel station according to data granted to the author.
7
Identifying Wind on Site
Basically, for wind energy industry, it is vital to identify wind resource on site primary to the construction phase of the project. Wind speed and wind direction are some required factors to identifying wind resource at a site (Mathew, 2006). The simplest way for observing wind intensity at a site is through biological indicators, as the wind plays noticeable role on how ecological and biological indicators being formed, like Sand dunes and trees (Mathew, 2006). However, this method cannot be used for actual wind speed measurements since it is too rough of an estimate. Therefore, techniques that are more accurate were developed to measure wind speed and wind direction such as cup, pressure tube, pressure plate, and sonic anemometers.
Analysis of Wind Data
Usually, Wind speed and direction are basic data required to identify wind resource in a site, however, these data need to be analyzed in a proper way to provide us better understanding of wind characteristics. Wind data can be grouped and averaged over time spans that we are interested to know wind profile over them, for example, diurnal wind profile projects the wind profile in hourly base. However, for wind industry it is believed that the common way of averaging wind data, according to the equation ,Eq. 1, is underestimating (Nelson, 2009), (Mathew, 2006).
Therefore, Eq. 1 will not be used for power calculation, but it will be used with the power curve for estimating wind power.
The usage of equation, Eq.(1) underestimates the wind power production by twenty percent if it has been used for wind power calculations (Mathew, 2006). as that wind power is proportional to the cubic of wind speed (Nelson, 2009). Hence, the alternative of using Eq.(1), is Eq.(2) as Mathew and Nelson have suggested (Mathew, 2006), (Nelson, 2009).
8
The drawback of Eq. (2) that the error value is being cubed as well, therefore, higher uncertainty is expected. Hence, it is demanded in wind resource assessment (WRA) to know the frequency distribution of wind speeds or the so called wind frequency rose (Nelson, 2009).
Framework of (WRA)
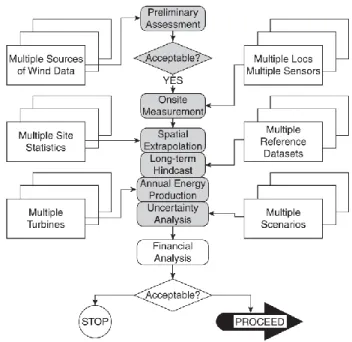
Basically, the typical way of WRA as it is explained by Jain in his published book as shown in Figure 4.
The gray blocks in the flow chart indicates phases for the overall process, other blocks in both sides indicate input data for a specific each stage. The study will be focused on wind resources assessment, the financial aspect, and the uncertainty analysis will be excluded due to the time limitation.
9
Methodology of (WRA)
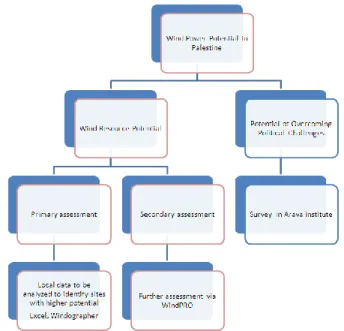
The block diagram for the flow of the project is expressed in Figure 5; the project will be focused on two parts. The first one, highlighted with red, is to investigate technically the potential of wind power in Palestine/Israel. The second part will shed the lights on the possibility to overcome the Palestinian-Israeli conflict to accomplish wind development, as well as, it will tests the local acceptance of wind power in Palestine/Israel and it will suggest practical solutions from different prospective. This section will shed lights on the methodology followed to assist the finding of this project.
Primary WRA Method
Figure 6, shows the three major steps taken to perform primary assessment of wind resource in Palestine/Israel. The process started with collecting local data from distributed stations in Palestine/Israel. The outcome of this process was two sets of data:
Data from Israeli stations: these data were covering the time series from 2000-2006 in some stations.
Data from Palestinian stations: the data were already monthly averaged over the year of 2009. Figure 6: The suggested plan for Primary WRA process by the author.
Figure 5: Block diagram shows the flow of the project developed by the author.
10
The collected data were being filtered and analyzed to identify stations with higher potential. For the purpose of analyzing data and Identifying stations with higher correlation, Excel software was used to plot graphs for wind profile in each one of stations. Moreover, Excel software was used for correlating each one of stations with the reference station. Furthermore, the data from different stations were imported to Windographer software to plot the wind frequency rose for each one of stations and diurnal wind profile to assist the process of making decisions about stations with higher potential. The whole process of analyzing local data is to identify the areas with high wind potential. Whereas online data like, SYNOP, QSCAT, METAR, and NCAR are to be used to perform wind resource assessment. The local data such as surrounding roughness and measurement’s height were not available at the time of this study.
In secondary assessment, WindPRO software was used to
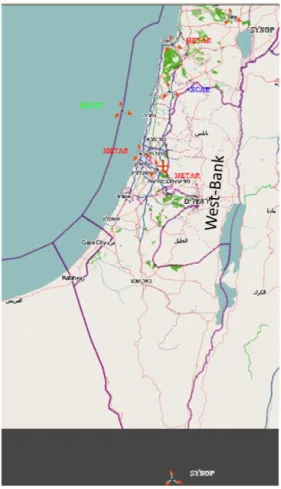
generate approximate wind resource grid. A map for Israel/Palestine was generated with the right coordination system “Israeli TM coordinating system”, available Meteorological stations were located on the map and labeled with the sources of the data as shown in Figure 7. To have an idea about the available meteorology stations and the distance of these stations is important to know, so that suitable stations close to the targeted site will be used. Identified sites with higher correlations or indicated sites in previous studies that are close enough to reference stations will be selected to perform wind resource assessment using WAsP model in WindPRO at the hub height.
Figure 7: Available METAR, NCAR, QSCAT, SYNOP metrological stations in Palestine/Israel, the map from http://www.openstreetmap.org/, edited by the author.
11
Secondary WRA Method
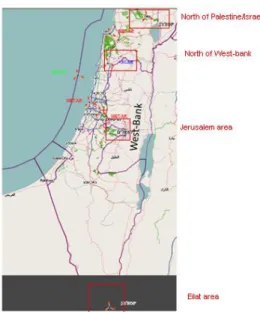
Among the whole area of Palestine/Israel, smaller areas were selected to facilitate the WRA using WindPRO, as the software requires more computational capabilities to deal with bigger areas. Sites were selected based on high wind potential that have been observed through correlations with reference station, literature review, and know hilly mountains. Distance between Meteorological stations and targeted sites also considered, as some targeted sites could not be selected because they are far from any Meteorological station. Figure 8 shows selected sites on the map. Sites were used separately and treated as a single project.
Each one of the sites went through following phases:
New project has been created for each site in a new folder with appropriate name relevant to the site.
Close up map for the site were imported online, Israeli coordination system has been used.
NCAR, METAR, QSCAT, or SYNOP Meteorology station was placed at the targeted, the closer to the targeted site, the higher priority.
Contour lines were imported to the targeted site via online option, roughness area and roughness lines were imported as well.
Site data were placed at the targeted site for STATGEN model to be used. STATGEN is important to be run so that wind statistics can be created at the sites so that WAsP model can be used then.
Site data were placed at that targeted site for RESOURCE model. RESOURCE model is designated to map wind resources in a given site. Resource simulation result can be shown on the map and it can show where are places with higher potential
Site data were placed at targeted site to be used for WAsP model. WAsP model used to calculate wind resource at the hub height. The same turbine, VESTAS, V90-3 000 has been used as a turbine for calculations.
Figure 8: Selected sites for further assessment using WindPRO, the map from http://www.openstreetmap.org/, edited by the author.
12
Several site data were placed at the targeted area, moreover calculations have been run several times using different site data to identify places with higher potential. Some sites only one site data used for WAsP calculations, but it has been placed carefully at the site with high wind resource according to the resource map generated by RESOURCE model.
Result of this simulation process contains information about potential of wind resource at a specific site, estimated power production, and capacity factor. Calculation results are presented in the result section.
13
Analysis of (WRA)
The analysis process went through two stages; one is primary assessment that was based on Windographer and Excel software. The outcome of this stage was two sites to be used for further analysis beside two more sites that were mentioned in the literature review for further assessment The aim of the primary process was to identify sites with higher potential to be used for further analysis via WindPRO, as it would be difficult to deal with the whole area of Palestine/Israel for wind resource mapping, as it is time consuming.
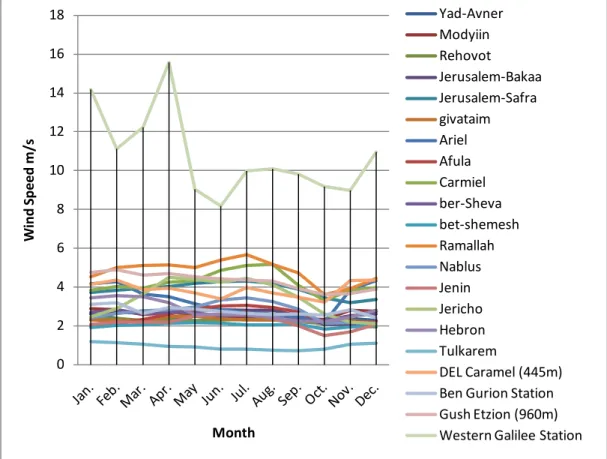
The analysis process started with local data measurement, unwanted parameters, such as humidity and temperature, were removed from data set. Wind velocities were averaged over each one of the months using the first equation mentioned in the theory to avoid error. Monthly wind profile was mapped for all stations, shown in Figure 9.
Figure 9: Wind profile in each one of the stations monthly averaged according to the data granted to the author.
0 2 4 6 8 10 12 14 16 18 W ind Spe ed m /s Month Yad-Avner Modyiin Rehovot Jerusalem-Bakaa Jerusalem-Safra givataim Ariel Afula Carmiel ber-Sheva bet-shemesh Ramallah Nablus Jenin Jericho Hebron Tulkarem DEL Caramel (445m) Ben Gurion Station Gush Etzion (960m) Western Galilee Station
14
An assumption was made that all reference stations were same height, but height was unknown, above figure shows clearly that the wind potential is higher in Western Galilee station, however, the graph of Western Galilee represent higher fluctuations, which is an indicator that the data from this station is poorly availability. This site might be considered for resource assessment, but it is not good Idea to use it as a reference station to be correlated with other stations.
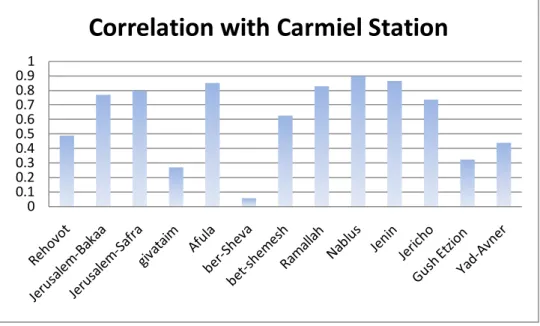
Therefore, an alternative station with relatively high wind potential, and high availability of data should be used as a reference station to be correlated with other stations, so that a station with similar potential can be identified easily. Carmiel station has been chosen as a reference station. Therefore, a correlation matrix was calculated to consider similarities of wind potential between different stations. Figure 10 shows the result of the correlation matrix.
Figure 10: Correlation of different stations with the reference station "Carmiel” according to data granted for the author. It is worth to mention that some stations were excluded from the calculation due to time series error and unrealistic correlation result. The result shows high correlation with Afula, Ramallah, Nablus, Jenin, Jerusalem-Bakaa, and Jerusalem-Safra. Further step of resource assessment carried out with Windographer software to map wind frequency roses, diurnal curves, and monthly wind speed profiles in each station. However, the data from Palestinian stations were excluded from this step as the data time series is not available.
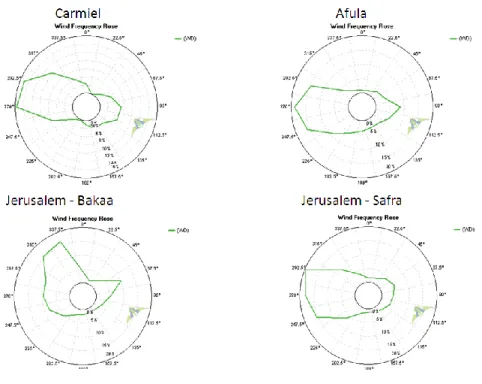
Figure 11 shows wind frequency roses for four selected stations with high correlations for comparison. The wind frequency roses are very similar in each of Carmiel, Afula, and Jerusalem-Safra. However, it is
0 0.1 0.2 0.3 0.4 0.5 0.6 0.7 0.8 0.91
15
slightly different in Jerusalem-Safra station. One more important factor should be considered in the assessment process is the monthly wind profile.
Figure 12 shows monthly wind profile in the selected for stations each station corresponding to its name. The figure shows the monthly fluctuation of the wind profile in each one of selected stations.
Figure 11: Comparison of wind frequency roses in Carmiel "reference station" and each one of selected stations, according to data granted to the author.
16
Figure 12: Comparison of monthly wind profiles in Carmiel "reference station" and each one of selected stations, according to data granted to the author.
Although the figure represents relatively low wind speed, but still these stations can be considered for the secondary assessment as the height of the measurements is unknown.
Diurnal wind profiles in the reference station “Carmiel” and the three other stations are shown in Figure 13.
17
Figure 13: Comparison of diurnal wind profiles in Carmiel "reference station" and each one of selected stations, according to data granted to the author.
Usually, diurnal wind profile shows the fluctuation of wind speed in hourly base. The importance of these graphs that these graphs can help to estimate the power potential over the time spans in our interest, daily or monthly.
it worth to mention that available Meteorological stations will be used to map wind resources in the adjacent Palestinians territories to stations site, considering Palestinians’ sites that had high correlation with the reference station.
The selected sites from this process were used for further assessment using WindPRO software, besides other sites that are known to have high wind potential in Palestine/Israel through literature review, such as Golan Height, and Eilat mountains.
18
Findings
As simulation process done, the process end up with a result indicate sites with higher potential, mean wind speed at hub height 100m for WAsP calculations, and estimated wind power potential. The outcome of this study also was wind resource maps that show higher resources in each one of the stations. The result of the assessment is presented according to their site as following:
North of Palestine/Israel
As previously mentioned north of Palestine/Israel, shown in Figure 14, contains Carmiel station “the reference station” and Golan Heights, the Golan Heights have been mentioned in the literature review as places that have high potential of wind power, based on that assumption, the area was selected for secondary assessment. SYNOP reference data was used for calculations at 10m height. Sites data at the map were labeled with mean wind speed at 100m hub height based on WAsP calculations.
Resource model has been used to Identify sites with higher potential in that area, it worth to mention that the resource calculation is time consuming, and it depends on the size of the map that would be Figure 14: Site map, north of Palestine/Israel, Data sites labeled with wind speed at 100m hub height, the map from
19
use as input for resource map. Generated resource map via RESOURCE model is shown in Figure 15; red color indicates area with higher wind potential.
Figure 15: Resources map has been generated for north of Palestine/Israel site via resource model in WinPRO, red spots indicate higher potential areas 50m height.
In this map, some sites have been identified with a ~7 m/s at 100m hub height, however, the natural reserves seems to obstacles for many of these sites as it is shown in Figure 16 that show site of the map imported from Google earth.
20
Figure 16: Elevation map imported from Google earth shows north of Palestine/Israel site, terrain, and natural reserves in the area.
The area of the north is known to have complex terrains, high mountains, and forestation areas. There is already a wind power project that has been operating in this region since 1993.
North of West-bank
The closest city from West-bank to the border with Israel from the north is Jenin, Figure 17 shows north of West-bank area. Afula station is situated in the north east. This area has been selected for secondary assessment as it has high correlation with Carmel station. NCAR reference data was used for calculations at 42m height.
21
A site has been identified to have high potential right at the border, the site has mean wind speed around 7 m/s at 100m hub height based on WAsP model calculations. More sites with high potential are also shown in Figure 18. The map in Figure 18 has been generated by RESOURCE model that model is designated to generate wind resource map in a given site, at a specific height.
Figure 17: Site map, north of West-bank, Data sites labeled with wind speed at 100m hub height, the map from http://www.openstreetmap.org/, edited by the author.
22
Figure 18: Wind resources map has been generated for north of West-bank area, orange spots are the highest potential at 50m height.
High wind potential site has been identified at the border area, close to Um Al Fahim city in the Israeli side, the resource map also shows high potential of wind that can be used for producing electricity in West-bank area, however the maximum mean wind speed is 7.4 m/s at 50m hub height. An elevation map for the area is shown in Figure 19; the picture has been imported from Google earth. The complexity of the terrain also can be identified somehow from the elevation map.
23
Figure 19: Elevation map imported from Google earth shows north of West-bank, terrain in the north of West-bank, and natural reserves in the area.
Probably the eastern side of the map bearing higher wind potential as there was plan for starting up a wind farm project by the Israeli government at east of Jenin city in the Israeli territories. It was not possible to perform an accurate wind resource assessment due to the distance of the meteorological station that was increasing the uncertainty of the result.
Jerusalem and the Center
Both stations, Jerusalem-Bakaa and Jerusalem-Safra, are situated in the center of the map. The two stations were highly correlated with the reference station. The reference data station was used for calculations was METAR at 10m height. The site map is shown in Figure 20. Data sites are labeled with mean wind speed at 100 hub height based on WAsP calculations.
24
Figure 20: Site map, north of Jerusalem area, data sites labeled with wind speed at 100m hub height, the map from http://www.openstreetmap.org/, edited by the author.
A detailed resource map for the site is shown in Figure 21. From Figure 21, the area with high potential seems to be close to green spots. More information about the site itself and terrains can be understood through the elevation map generated via Google earth, shown in Figure 22. The south side of the map, close to Bethlehem and Hebron cities, a small scale of wind projects that have been established by peace activist to help Bedouin community to maintain their life normal. The resource assessment process was hard to be extended to cover these areas because it is far from the meteorological station that increases the uncertainty of the result, moreover, including such a large area for wind resource mapping is time consuming.
25
Figure 21: Wind resources map has been generated for Jerusalem area; orange spots are the highest potential at 50m height. Elevation map is shown in Figure 22. The map has been generated from Google earth as the previous cases. From the elevation map, one can conclude that the terrain is more complex compared with that one in the previous case in Jenin. The natural reserves are issue only close to Jerusalem city itself where is the wind resource is low compared with other places. The highest calculated site based on WAsP calculation was with mean wind speed 7.12 m/s at 100m hub height. Sites can be identified with higher potential but the resource map shows that the highest mean wind speed is 8 m/s at 100m hub height.
26
Figure 22: Elevation map imported from Google earth shows Jerusalem area, terrain in Jerusalem, and natural reserves in that area.
Even if some calculations showed that there is potential for wind power in Jerusalem, still it is not valid to develop wind power specifically in Jerusalem, as the city considered having special value for Muslims, Jews, and Christians for historical links with prophets and old style architecture. The idea of building wind turbines might be discouraging for religious people who are inspired by the history of the city. Eilat Area
Eilat area has been mentioned in the literature review, two of references were studying wind power potential in the Negev “South of Palestine/Israel”. Moreover, the conducted studies showed high potential in some area, and suggested sites for further study. SYNOP reference data station was used to perform wind resource calculation in this region at 10m height. Figure 23 shows the southern side of Palestine/Israel, the so called “Negev”. Surprisingly, the resource assessment showed that Eilat area has the highest potential of the four selected sites.
27
Figure 23: Site map, Eilat area, it is also called the Negev. Data sites labeled with wind speed at 100m hub height, the map from http://www.openstreetmap.org/, edited by the author.
The issue in the south as many of the site that is big area reserved for natural reserves, military zones. Moreover, it is more effective to invest in solar than wind power in the south as it has high intensity of solar power. The resource map for the site is shown in Figure 24.
28
Figure 24: Wind resources map has been generated for Eilat area; red spots are the highest potential at 50m height. The map shows sites with different mean wind speed. The labeled site data with mean wind speed of 9.71 m/s is situated on Mount Shlomo. Places with higher potential were identified close to Elifaz area with mean wind speed 9.88 m/s at hub height 100m. However, the area of Arava contains natural reserves, military zones, and it contains archeological sites. Figure 25, shows Elevation map, geographical terrains, and natural reserves.
29
Figure 25: Elevation map imported from Google earth shows Eilat area, terrain in Eilat, and natural reserves in that area. The picture shows natural reserve close to Mount Shlomo furthermore, the site seems to be a complex terrain, high mountains. There are two airports in the area one in the Jordanian side, the other one in the Israeli side that might constraint with wind projects in the future.
30
Section 2: Political Situation Assessment
Background Information for Political Assessment
The map of Palestine/Israel is shown in Figure 26. Palestine is sharing borders from the east with Syria and Jordan, while it is sharing the border from the west with Egypt, the Mediterranean Sea, Lebanon from the north, and Red Sea from the south. The total area is roughly 26.300 square kilo meter (Levine, 2009), the situation of Palestine as a connection point between Africa and Asia gave it strategic importance, and therefore it used to be attractive for the strong powers through the history.After the war of 1967 (six days war) the country has been divided into Israel, West-bank and Gaza. The roughly estimation of the population is eleven million, by the year of 2006 (Levine, 2009).
In order to resolve the Israeli Palestinian conflict that erupted 1948 and extended for decades, negotiations were extensively held between Palestinians and Israelis to achieve Oslo agreement (Aronson, 2000). The main feature of this agreement was the division of West-bank and Gaza into a three main areas each with different level of Palestinian/ Israeli administration (Aronson, 2000), the division was considered to be solution that time. However, the consequences of the division started to be visible after this policy went through application.
Area (a) highlighted in the map with the yellow color, this area completely under the Palestinian control in terms of
security and civilian control. However, Area (b), indicated on the map with a gray color, was agreed to be under the Palestinian control in terms of Civilian matters and services while being controlled by Israeli in terms of security (Aronson, 2000). Moreover, area (c) is the left area in West-bank that
Figure 26: Map of Palestine/Israel showing different territories (Map, 2011)
31
contains Israeli settlement, this area was agreed to be under the Israeli control in terms of both security and civilians control (Aronson, 2000).
The issue with the associated division, that any project will be established in the future, according to the targeted site of the project, the project has to pass through different stages to grant permissions. For example, if there is potential of wind power in Palestine within the Area (a) and Area (b), permissions has to be granted from Palestinian Authority for the construction, but approval is required from the Israeli side for transportation, importation, and construction. Whereas, if there is potential within the Area (c) or within the Israeli territories, then the only government that is authorized for granting permissions is the Israeli governments.
Theoretical Framework of Political Assessment
Investigation about energy development situation in Palestine/Israel is necessarily especially in Israel. As Israel is recognized country that has full control over its territories, moreover Israel has high level standard, and more likely to be capable of investing in renewable energy particularly in wind power compared with surrounding countries (Levine, 2009). However, even in Israel the enhancement of renewable energy is not matured yet due to the following reasons that were stressed by Mason, M., & Mor, A. (2009):
A comprehensive plan for renewable energy policy has not been developed by the ministry of national infrastructures; neither the coordination with others ministries has been done by the ministry of infrastructures (M. Mason & A. Mor, 2009).
The Israeli Electrical Corporation’s that is the most dominant corporation for supplying electricity in Israel has strong favor to keep operating with the conventional fuel, especially with coal, although there was proportional shift from using coal to natural gas. But the Israeli company is not facilitating the process of connecting from renewable energy resources (M. Mason & A. Mor, 2009).
Feed in tariff policy already introduced. But the tariff incentive for renewable energy is low compared with other countries; tariff intensive for photovoltaic is higher than other facilities, about 0.52$/Kwh, but still not supportive (M. Mason & A. Mor, 2009).
The low level of public investment in research and development for renewable energy. The research studies are carried out exclusively to Ben-Gurion University in the Negev and Weizmann institute. The rest of research and development projects are self financed (M. Mason & A. Mor, 2009).
32
The public awareness of the importance of renewable energy is playing important role. polls has shown that 89% of the Israeli believed that the government is not doing enough to address the environmental issues to the public, moreover, 65% believed that the climate change issue is a serious issue, however, less than 50% of the Israeli have taken serious steps to reduce their energy consumption (M. Mason & A. Mor, 2009).
The previous polls have opened new window to investigate the possibility to extend relay on renewable energy, particularly wind power in Palestine/Israel from one hand. Also, the political barriers have been recognized in the other hand. Therefore, a proposed survey has been developed by the author, to address the difficulty of coordinating logistics for wind power projects especially with the existence of political barriers, furthermore, the survey intended to find a realistic suggestions about the party that has the capability to develop similar projects in the region.
Political Situation Assessment Method
As mentioned previously, the technical assessment might be viable but it is extremely demanded to investigate the viability of the political solution for such projects to be established in Palestine/Israel. Any future project should is believed to have ties with political situation due to the required logistics, transportations and construction process. In order to build solid understanding about for situation and suggest some way to waive the political conflict to develop wind projects in the future, a survey form were developed and distributed to a targeted group. Figure 27, shows the preparation plan for the survey.
33
Figure 27: Preliminary plan for a survey was developed by the author to find alternative solutions to overcome the political conflict in order to develop wind power project in Palestine/Israel.
The targeted group is intended to be Arava institute students, alumni, and staff. The institute is well-known of adapting diverse group of students from different nationalities. Students from Israel, Palestine, Jordan, and international students from United States and Canada study together about the environment as well as peace building. The program that is lasting for one semester, offers to students a unique opportunity to learn about the Palestinian-Israeli conflict from different prospective than the biased one offered by international media. The diverse group of students offered them an opportunity to think out of the box for political solutions to overcome the political obstacles especially because they are involved somehow in the conflict. The objectives of this survey are to evaluate the most practical solutions to carry out big scale development projects, to realize the Israeli position toward Palestinian’s projects whether it would be supportive or oppositional, as well as to identify the most important factor to be empowered to promote for wind power projects in the region. The conducted survey is expected to assist the study with more insight solutions and suggestions to avoid the political obstacles.
Survey Targeted Group
•Arava students and Alumni •Palestinian- Jordanian- Israeli
–American- and some other nationalities
Survey objectives
•To evaluate Israel position toward Palestinian projects •Party capable of developing
wind power
• factors to promote wind power
Survey conclusion
•Find realistic solution for logistics and permissions •Find which factor need to be
empowered to promote wind power
34
Political Assessment Analysis
This section is intended to deal with the second side of the study, that has focused on addressing the political issues and seeks alternative solutions through a survey. Moreover, the survey is aimed to know who will be an authorized party to proceed with wind power projects, and to be accepted in both Palestinian and Israeli governments.
Survey Data Analysis
Online survey has been conducted for five days between 12th of May to 17th of May 2011. Number of was 39, which was below the expectation, as the survey was intended to be deployed by alumni office, however, due to logistic issue and time delay, the survey has been sent to colleagues and alumni from Arava institute in my contact list.
Participants Information
Ages of the participants were distributed between 18 years and 35years as shown in Figure 28, as the institute offers both, undergraduate and graduate courses for different nationality students.
Different nationalities took part in the survey; the distribution of nationalities is shown in Figure 29. Most of the participants were from Israel. Other nationalities like Canadian and British conducted the survey as well. 62% of participants were females, while 38% were males. Most of the participants were student in the institute, one staff member, and four were intern students.
Figure 28: Participants ages' distribution for the survey conducted by the author.
Figure 29: Participants' nationalities distribution in the conducted survey by the author.
35
Survey Discussion
In general the, answers related to the local acceptance regarding wind power projects were significantly positive as the institute is for environmental studies, therefore, students are aware of the environmental issues and recognize the importance of wind power is an alternative for
conventional oil, hence, their answers were already expected to be in favor of wind power.
Regarding the Israeli government position whether it will be oppositional or supportive, the result was as shown in Figure 30. There was some balance, as 31% thought that it would be oppositional position, the same percentage of participants believed that it would be supportive position. But even among the Israelis there were people who believed that Israeli position will be in favor of such projects (23.53%). Also quite sufficient percent of Americans sharing the same sense (37.5%).However, none of the Palestinians thought that the Israeli’s government position will be supportive. The survey objective not only to understand the Israeli government’s position toward development of wind power in Palestine, but also it has to deal with proposed alternative solutions.
In order to point out the issues and rising up alternative solutions, a question was added to confer the authorized parity to establish wind
projects. The result was as shown in Figure 31, the majority of the participants believed that a third party neither Israeli nor Palestinian can develop wind power projects, as third parties like international or local NGO (None Governmental Organizations). However, some suggestions were
giving a credibility to joint corporations, Israeli-Palestinian; whether between companies or governments. However, these opinions were stressed under “others” option in the survey. But the third
Figure 30: Israeli government's position toward future Palestinian's wind projects according to the survey conducted by the author.
Figure 31: The party that is most likely to be capable to develop wind power projects in Palestine/Israel due to the political conflict according to the conducted survey by the author.
36
party seems to be more realistic as the third party will have authority to coordinates the efforts between Israelis and Palestinians, moreover, third party decisions might be more obligated to both Palestinian and Israeli especially if it is supported by the United Nations. However, the third party is not the only requirement to develop wind power projects, for example in Israel, there is no need for any third party to develop wind projects, but only few wind projects had been established. Therefore, it was crucial to know important factors to be empowered to promote wind power in Palestine/Israel.
Regarding the factors that playing important role in wind power in Palestine/Israel, 75% of the participants think that supportive
policies by government whether it was Israeli or Palestinian government has the strongest influence in promoting wind power, Figure 32 shows the results. However, some participants
pointed under “others” option to the motivation to move toward green technology, and decentralize energy sources as well as the international economic support for green technology.
Figure 32: The most important factor for promoting wind power in Palestine/Israel according to the survey conducted by the author.
37
Conclusion
Wind resource assessment has been performed based on two stages of assessment; one was primary assessment that based on a local data taken from stations that cover partial areas of Palestine and Israel, the other one was secondary assessment that via WindPRO software and WAsP model. The wind resource assessment showed relatively high wind potential in selected sites that was around 7 m/s at 100m hub height. The study also concluded that the highest wind potential was in the southern side of Palestine/Israel that approached 9.88 m/s at 100 m hub height. The wind resource assessment and good wind potential in Palestine/Israel is not enough to develop wind power projects. In parallel with wind resource assessment, political situation assessment has been performed based on a conducted survey. According to the conducted survey, the Israeli government position will be slightly oppositional to any project for Palestinians; moreover, international NGOs are most likely to succeed in developing wind power in Palestine/Israel, not to forget the added complexity to maintain logistics and permissions with two governments rather than one. Furthermore, supportive policies from both the Israeli and Palestinian governments are crucial for wind power development in the region.
38
Recommendations
For further study in this field, I would recommend future researchers to have same time series of data from Israel and Palestine, So that no station will be excluded if a similar time series is not available. Moreover, local data is more accurate to be used at the targeted site than imported data from airport site. Moreover, WindSim software that is based on Computational Fluid Dynamic (CFD) is more suitable to be used for complex terrain, as it is the case in Palestine/Israel. In addition to the fact the simulation in this research did not cover the whole area due to the time constrain. Further simulation can be done to cover the whole area of Palestine/Israel. Further study at the suggested sites based on local wind measurement can assist the results for future development projects. In terms of planning and management, a study that questions the barriers for wind power development in the Israeli side is highly demanded, as Israel has the required factors to invest and develop wind power but the wind power in Israel is still left behind. Further study to address the local acceptance for wind power in both sides is highly encouraged, as conducted survey in this study was in environmental studies, and the result does not reflect the local acceptance for wind power.
39
Bibliography
A. Furshpan, I. Setter & S. Rubin. (2003). Wind Energy Atlas of Israel: Negev and Arava. Bet-Dagan: Israel Meteorological Service.
A.Manes, M. Rindsberger & L. Segal. (1980). Wind power resources in Israel and Eastern Mediterranean. Israel Meteorological Service. Research and Development Division .
Aronson, G. (2000). Recapitulating the Redeployments: The Israel-PLO'Interim Agreements. Washington,
DC, Palestine Center .
Comet-ME, O. (2009, January 1). Comet-ME web page. Retrieved June 19, 2011, from Community, Energy and Technology in the Middle East: http://comet-me.org/what.html
G. Ben-Porat,Y. Levy,S. Mizrahi, A. Naor, and E. Tzfadia. (2008). Israel Since 1980. New York: Cambridge University Press.
Israeli Ministry of Environmentl Protection . (2009, July 31). Retrieved June 19, 2011, from Ministry of
Environmentl Protection :
http://www.sviva.gov.il/bin/en.jsp?enPage=e_BlankPage&enDisplay=view&enDispWhat=Zone&enDisp Who=renew_energy&enZone=renew_energy
J.F. Manwell, J.G. McGowan & A.L. Rogers. (2002). Wind Energy Explained Theory, Design and
Application. University of Massachusetts, Amherst, USA: John Wiley & Sons Ltd.
Jain, P. (2011). Wind Energy Engineering. New York : The McGraw-Hill Companies.
L. Druyan, V. Goldreich & Z. Maximov. (1986). Wind energy survey in the Negev (Israel). Applied
Geography , 241-254.
Levine, M. (2009). Impossible Peace: Israel/Palestine since 1989. 32 Oceanvista Lane: Fernwood Publishing Ltd.
M. Lange & U. Focken. (2006). Physical Approach to Short-Term Wind Power Prediction. Oldenburg: Sprinker.
M. Mason & A. Mor. (2009). Renewable Energy in the Middle East: Enhancing Security Through Regional
Cooperation. Dordrecht, The Netherlands.: Springer.
Map, C. (2011, February 10). Bethel Web Page. Retrieved June 18, 2011, from Bethel Christian Fellowship: http://www.bethelcf.com/israel_programs/article228493c4256134.htm
Mathew, S. (2006). Wind energy: fundamentals, resource analysis and economics. Berlin Heidelberg: Springer.
Nelson, V. (2009). Wind energy: renewable energy and the environment. Boca Raton London New York: Taylor & Francis Group, LLC.
40
Quilter, J. ( 2010, August 10 ). WindPower Monthly. Retrieved June 19, 2011, from Israeli government approves Golan Heights repowering:
http://www.windpowermonthly.com/go/middleEastAfrica/news/1021294/Israeli-government-approves-Golan-Heights-repowering/
41
List of Figures
Figure 1: Sea breeze during the daytime, land breeze during the nighttime (Nelson, 2009). ... 5
Figure 2: Monthly wind speed profile in Carmiel station according to data granted to the author. ... 6
Figure 3: Diurnal wind speed profile in Carmiel station according to data granted to the author. ... 6
Figure 4: Procedures of WRA, input for each one of the process (Jain, 2011) ... 8
Figure 5: Block diagram shows the flow of the project developed by the author. ... 9
Figure 6: The suggested plan for Primary WRA process by the author. ... 9
Figure 7: Available METAR, NCAR, QSCAT, SYNOP metrological stations in Palestine/Israel, the map from http://www.openstreetmap.org/, edited by the author... 10
Figure 8: Selected sites for further assessment using WindPRO, the map from http://www.openstreetmap.org/, edited by the author... 11
Figure 9: Wind profile in each one of the stations monthly averaged according to the data granted to the author. ... 13
Figure 10: Correlation of different stations with the reference station "Carmiel” according to data granted for the author. ... 14
Figure 11: Comparison of wind frequency roses in Carmiel "reference station" and each one of selected stations, according to data granted to the author. ... 15
Figure 12: Comparison of monthly wind profiles in Carmiel "reference station" and each one of selected stations, according to data granted to the author. ... 16
Figure 13: Comparison of diurnal wind profiles in Carmiel "reference station" and each one of selected stations, according to data granted to the author. ... 17
Figure 14: Site map, north of Palestine/Israel, Data sites labeled with wind speed at 100m hub height, the map from http://www.openstreetmap.org/, edited by the author. ... 18
Figure 15: Resources map has been generated for north of Palestine/Israel site via resource model in WinPRO, red spots indicate higher potential areas 50m height. ... 19
Figure 16: Elevation map imported from Google earth shows north of Palestine/Israel site, terrain, and natural reserves in the area. ... 20
Figure 17: Site map, north of West-bank, Data sites labeled with wind speed at 100m hub height, the map from http://www.openstreetmap.org/, edited by the author. ... 21
Figure 18: Wind resources map has been generated for north of West-bank area, orange spots are the highest potential at 50m height. ... 22
Figure 19: Elevation map imported from Google earth shows north of West-bank, terrain in the north of West-bank, and natural reserves in the area... 23
Figure 20: Site map, north of Jerusalem area, data sites labeled with wind speed at 100m hub height, the map from http://www.openstreetmap.org/, edited by the author. ... 24
Figure 21: Wind resources map has been generated for Jerusalem area; orange spots are the highest potential at 50m height. ... 25
Figure 22: Elevation map imported from Google earth shows Jerusalem area, terrain in Jerusalem, and natural reserves in that area. ... 26
Figure 23: Site map, Eilat area, it is also called the Negev. Data sites labeled with wind speed at 100m hub height, the map from http://www.openstreetmap.org/, edited by the author. ... 27
42
Figure 24: Wind resources map has been generated for Eilat area; red spots are the highest potential at 50m height. ... 28 Figure 25: Elevation map imported from Google earth shows Eilat area, terrain in Eilat, and natural reserves in that area. ... 29 Figure 26: Map of Palestine/Israel showing different territories (Map, 2011) ... 30 Figure 27: Preliminary plan for a survey was developed by the author to find alternative solutions to overcome the political conflict in order to develop wind power project in Palestine/Israel. ... 33 Figure 28: Participants ages' distribution for the survey conducted by the author... 34 Figure 29: Participants' nationalities distribution in the conducted survey by the author. ... 34 Figure 30: Israeli government's position toward future Palestinian's wind projects according to the survey conducted by the author. ... 35 Figure 31: The party that is most likely to be capable to develop wind power projects in Palestine/Israel due to the political conflict according to the conducted survey by the author... 35 Figure 32: The most important factor for promoting wind power in Palestine/Israel according to the survey conducted by the author. ... 36
43
Acronyms
Eq: Equation KW: Kilo-Watt Kwh: Kilo-Watt-HourMETAR:Meteorological Aerodrome Report
MWh: Mega-Watt-Hour
NGO: None Governmental Organizations QSCAT: Quick Scatter-meter
RESOURCE: Wind resource model that is already available in WindPRO pack. STATGEN: Power calculation model that is already available in WindPRO pack. SYNOP: Synoptic
WAsP: Wind Atlas Analysis and Application Program
WindPRO: is software that is developed by EMD Company. WindSim: Wind-turbine Simulation
44
Appendix I
Survey
Introduction: this survey will be used for my master thesis, which will be focused on the potential of wind power projects in Palestine/Israel. The thesis will be focused on the technical part of wind resource assessment, as well as the potential to overcome the political conflict for managing needed logistics including (construction permissions, heavy vehicles transportation permissions, importing equipment permissions and grid connection permissions). A wind resources assessment study will be carried out for the first part of the thesis. But for the second part that will be focused on the logistics and social attitudes toward wind power will be tested by survey covering targeted group with different nationalities, who were involved in both environmental studies and Israeli-Palestinian political conflict.
Part A : participant general information 1. Age : (below 18, 18-25, 25-35, above 35)
2. Nationality: (Israeli, Palestinian, American, Jordanian or other) 3. Gender: (male, female)
4. Profession in Arava: (teacher, Student, intern student, officer, none )
Part B: social acceptance questionnaire
1. To what extent do you support or oppose the use of renewable generation as part of the
Israeli/Palestinian electricity supply? (strongly support, tend to support, neither support nor oppose, tend to oppose, strongly oppose)
2. To what extent do you support or oppose the use of wind power as an alternative source of
electricity? (strongly support, tend to support, neither support nor oppose, tend to oppose, strongly oppose)
3. How would you describe your knowledge of on shore wind farms? (know knew a lot, knew a little, knew very little, knew nothing )
4. How many wind farms have you seen in operation in the last five years? (1 , 2 , 3 , 4, 5+)
5. When you last saw a wind farm in operation, would you say this had a positive or negative effect on your perception of the local area? (Very positive, slightly positive, neither positive nor negative, slightly negative, very negative )
6. In case if there is wind power potential in West bank area, to what extent do you feel Israeli government will facilitate the process of importing required equipments and permissions? (Very supportive, slightly supportive, neither supportive nor oppositional, slightly oppositional, very oppositional )
7. Which body you think is mostly likely to be capable to develop these projects due to political
situation? (Israeli government, Palestinian Authority promoted by Dr.Salam Fayyad, Local NGOs and peace activist, international NGO )
8. To what extent do you feel wind power could have a positive or negative impact on the following areas?
45
Very positive slightly positive neither positive nor negative slightly negative very negative Harnessing sustainable wind energy Reducing CO2 emissions Producing energy locally Reducing reliance on imported fossil fuels very positive slightly positive neither positive nor negative slightly negative very negative Providing local construction and maintenance jobs Business set up and run by local people