Bachelor of Science Thesis
KTH School of Industrial Engineering and Management Energy Technology EGI-2015
SE-100 44 STOCKHOLM
Thermal Conversion of MSW a
Comparison of the System
Performance:
Direct Combustion Versus Conversion
Through Syngas in CHP Plant
Termisk Omvandling av MSW ett
Jämförelse av Systemets Prestande:
Direct Förbränning Mot Omvandling
Genom Syntesgas
Mahdi Al Naami
Bachelor of Science Thesis EGI-2015
Thermal Conversion of MSW a Comparison of the System Performance:
Direct Combustion Versus Conversion Through Syngas in CHP Plant
Mahdi Al Naami Pedro Escribano Cebrián Approved 2015-05-18 Examiner Peter Hagström Supervisor Jeevan Jayasuriya Commissioner
Institute of Energy Department KTH
Abstract
This thesis is a study comparing two different thermal conversion paths for Municipal Solid Waste (MSW). The comparison will be focused on technical, economic and emission aspects. One path is the direct incineration of the MSW. Meanwhile the other consists of submitting the MSW to the process of gasification obtaining syngas which will be used for the production of energy. The thermal conversion is produced in a Combined Heat and Power system (CHP-system) looking at the economic, emission and technical aspects.
CHP-incineration plant produces heat and power from mass burning MSW directly without pre-treatment and CHP-gasification plant produces heat and power from converting MSW to syngas in a gasifier and then use the syngas to produce heat and electricity. To get the result of the objective, the following questions have been answered:
What is the overall economic performance of the two thermal conversion paths? What are the differences in emission depending on the path selected?
What is the overall efficiency?
The results shows that the most profitable thermal conversion path is directly incinerated MSW in the CHP-incineration since it is a more mature technology and therefore the costs of applying it are much less than applying the other alternative, however there are other economic cases that is the opposite. In case of pollution, thermal conversion of MSW into syngas for production of heat and power is much more environmental friendly and in case of the overall efficiency is the thermal conversion of MSW into syngas higher.
Sammanfattning
Detta projekt är en studie som jämför två olika termiska omvandlingsvägar för kommunalt fast avfall (MSW). Jämförelsen kommer att inriktas på tekniska, ekonomiska aspekter. Den ena omvandlingsvägen är direkt förbränning av kommunalt avfall. Den andra
omvandlingsvägen är att förvandla MSW till syntes gas som kommer att användas för
produktion av värme och elektricitet. Den termiska omvandlingen händer i en Combined Heat and Power system (CHP-system) och från systemet undersöks de ekonomiska och tekniska aspekterna.
CHP-förbränningsanläggning producerar el och värme från att massbränna MSW direkt utan sortering och CHP-förgasningsanläggning producerar el och värme från att förvandla MSW till syntes gas i en förgasare och sedan använda syntesgasen för att producera värme och el. För att få ett resultat av målet har följande frågor besvarats:
Vad är den övergripande ekonomiska prestationen i de två vägarna? Vilka är skillnaderna i utsläpp beroende på termisk omvandlings väg? Vad är den totala effektiviteten?
Resultaten visar att det mest lönsamma termiska omvandlingsvägen är att direkt förbränna MSW i CHP-förbränning, eftersom det är en mer mogen teknik och därmed kostnaderna för att installera och när den är i drift är mycket mindre än att tillämpa det andra alternativet, men i de andra aspekterna är det motsatta. Vid förorening, är termisk omvandling av MSW till syntes gas för produktion av värme och kraft mycket mer miljövänligare och i fallet med den totala effektiviteten är den termiska omvandlingen av kommunalt avfall till syntes gas är högre och bättre.
Table of Contents Abstract...4 Sammanfattning...5 Nomenclature ...7 Abbreviations ...8 1 Introduction ...9 1.1 Background ... 9
1.2 The Objective and the Aim ... 10
1.3 Limitation ... 10
2 Literature Study ... 10
2.1 Management of Municipal Solid Waste... 10
2.2 The Incineration And Gasification Process... 14
2.3 Comparison Between Two Technologies ... 17
2.3.1 CHP Incineration Technology ... 17
2.3.2 CHP Gasification Process... 19
2.4 The Cleaning System Of CHP-incineration And Gasification Systems ... 20
2.4.1 Pollutants ... 20
2.4.2 Emission Comparison Between The Thermal Conversion Paths ... 23
2.5 Investment ... 25
3 Methods ... 26
3.1 Assumption: ... 26
3.2 Case Of Study ... 27
3.3 Comparison the two path conversion in a CHP System ... 28
3.3.1 Efficiency ... 28
3.3.2 Economic... 31
3.3.3 Pollution ... 32
3.4 Sensitivity Analysis ... 32
4 Result And Discussion ... 34
4.1 The overall economic performance of the two paths ... 34
4.1.1 Payback Method ... 34
4.1.2 NPV Method ... 35
4.2 Emission depending on the path selected ... 35
4.3 Overall efficiency ... 36
4.4 Sensitivity Analysis ... 37
4.4.1 Maturity Of CHP-gasification Technology ... 37
4.4.2 Cost Analysis ... 38
5 Conclusion ... 40
6 References: ... 42
7 Appendix ... 45
7.1 Interview With Fortum Team Manager Niclas Åkerlund ... 45
7.2 Tables ... 45
7.2.1 LHV different components of MSW ... 45
7.2.2 Cost of capital and Operation cost of CHP systems in both fuels ... 46
Nomenclature
Name Symbol Unit
Amount of power produced Ee kWh
Amount of heat produced Eh kWh
Combustible fraction of the waste C % Capital cost of gasification CCOG (Euro) Capital cost of incineration CCOI (Euro)
Cost of capital i (%)
Factor of capital cost f(CC) - Factor of O&M cost f(O&M) -
Efficiency (%)
Income from municipalities S (Euro)
Initial investment cost PC (Euro/ton)
Heat h kWw
High heat value HHV (MJ/kg)
Low heat value LHV (MJ/kg)
Moisture of the raw waste W %
Net Present Value NPV (Euro)
O&M cost of gasification O&MCOG (Euro) O&M cost of incineration O&MCOI (Euro)
Operation and maintenance O&M (Euro/(ton*year)
Revenue R €
Power P (W)
Profit year n (years)
Payback year PB (years)
Price of electricity Pe €/kWh
Price of heat Ph €/kWh
Temperature T (°C)
Yearly income I (Euro)
Abbreviations
etc. Etcetera
EU European Union
GHG Green house gas
MJ Mega Joule
M€ Million Euros
MSW Municipal Solid Waste
Mton Million ton
MW Mega watt
MWh Mega watt hours
N Present value
NPV Net present value
WTERT Waste-to-Energy Research and Technology Council
CHP Combine heat and power.
CO2 Carbon Dioxide
C Carbon CH4 Methane H2 Hydrogen NH3 Ammonia CO Carbon Monoxide PVC Polyvinyl chloride
SOx Sulphur oxides
NOx Nitrogen oxides
EPS Electrostatic Precipitators
O2 Oxygen N Nitrogen H2O Water HCl Hydrogen Chloride S Sulphur (g) Gas T Turbine
CHP gasification s CHP gasification Steam turbine CHP gasification cc CHP gasification Combine Circle
1 Introduction
1.1 BackgroundThe management of Municipal Solid Waste (MSW) is a crisis in most of the developed countries. The number of civilians in the urban areas is growing as the industrial activity. Capitalism is the key of our economy, which makes the constant consumption of products indispensable, and therefore incrementing the amount of waste produced. It is really challenging to manage MSW in an efficient and safe manner. For that reason deep research in new techniques as well as enhance the current ones is vital to ensure the sustainability of the world.
Landfill has been widely used in the last decades. Nevertheless it is now when the humanity starts noticing the detrimental aspects of this way of procedure. Albeit the technology and installations handled have evolved greatly, there are still many problems far from being solved.
During past decades, it was impossible to imagine a system without landfills as last destinations of the waste since the waste cannot be entirely recycled. Thus, it is crucial to pre-process it with the aim of obtaining the largest outcome from it either in form of energy or decreasing its damage. One process that is stomping because of its advantages is the incineration. With the aid of developed technologies, incineration has gone from a mere combustion to a highly sophisticated process, which is matured enough to use around the world.
In the past, the waste was burned without recovering energy and the units for burning waste were known as “incinerators” a name no longer relevant and used to denote the sorry state of affairs of poor design, inadequate engineering and inept operation, with little control equipment in place for pollution abatement. Strict regulations has been applied since then to the incineration plants regarding the composition of the fumes and the final ash after the combustion making it one of the cleanest and sustainable way of treating the waste. Modern combustors combine solid waste combustion with energy recovery.
It is not only recovering energy using MSW as fuel in power plants what makes that method so attractive, but also Incinerators reduce the solid mass of the original waste by 80–85% and the volume by 95–96% [Waste Management Resources, 2009].
Another method of recovering energy from MSW is the gasification process which is a new technology compared with incineration. The waste gets converted into syngas to use it in the CHP-gasification plant to recover energy. What makes it even more attractive is the cleaning system is more controlled that incineration cleaning system, which makes it even better for the environment.
1.2 The Objective and the Aim
The objective of the project is to make a comparison between two different thermal conversion paths using MSW as a fuel in CHP systems.
The aim of the project is study the main differences that imply using one case or another. Therefore, it is necessary to focus on the economical, environmental, technological and operational aspects of the heat and power production in the respective CHP-system depending on the alternative selected. To find a solution of the question above it has been answered the following sub-questions:
How is the overall economic performance of the two thermal conversion paths? What are the differences in emission depending on the path selected?
What is the overall efficiency? 1.3 Limitation
Due to the wide range of possibilities that can be applied it is impossible to handle all of them in this study due to the time limit. Thus, some limitations must be applied.
Because of the lack of information from the two CHP-technologies selected. Some data has been interpolated from research that has been published in literature and company reports.
The waste collection system before the burning process will not be included in our research.
The project is focused on the two thermal conversion paths, the first one is direct combustion of MSW and the second one is combustion of syngas converted from MSW.
The calculations will be made based on one ton of combusted MSW.
The calculations will be made on CHP incineration Grate firing technology and on CHP gasification steam and combined cycle technologies with no pretreatment. The results represent large CHP plants with the capacity of more than 40 000
ton/year.
2 Literature Study
Acclamation: for an easier understanding for the reader and making easy to refer to the two different thermal conversion paths it will be considered syngas (gasification path) and MSW (direct incineration of the waste path) as two different fuels even if they have the same origin, MSW.
2.1 Management of Municipal Solid Waste
Municipal solid waste has increased in nearly all of EU; it can be corroborated in the figure 2.1.1. It claims the real necessity of deep research on management of MSW.
Figure 2.1.1 Kg waste produce per capita [European Environment Agency, 2013]
Great improvements have been done in the last few decades. Countries of the EU are more aware of the problems, which come from the waste. That is the reason why EU waste policy landscape has evolved considerably over the last 30 years. One important step was the thematic strategy on prevention and recycling of waste, which resulted in a revised Waste Framework Directive in 2008 (European Parliament and Council, 2008). In which it is described the European Waste Hierarchy.
Figure 2.1.2 Waste Hierarchies. [Avfall Sverige, 2014]
Figure 2.1.2 shows the waste hierarchy model where the first stage of the management of MSW is reducing the waste. By using less material in a process to get a job done which result in producing less waste. By acting this way, it will help industries and household to save both money and resources. The next step is Reuse. The society should reuse if the product still has value to perform either the activity it was made for or a new one. A cleaning process or maintenance could be needed for reusing it. When the product’s lifetime is over, it should be recycled if it is possible. The part of the waste, which doesn’t have any possibility or it is not profitable to recycle, will be burned. The heat produced in the combustion will be used for electricity production and district heating. Finally all the remaining products will be landfilled
There is no concrete definition of the MSW. A cite of how European Commission defines municipal waste for the purpose of national annual reporting is as follows:
“Municipal waste consists of waste collected by or on behalf of municipal authorities and
disposed of through waste management systems. Municipal waste consists mainly of waste generated by households, although it also includes similar waste from sources such as shops, offices and public institutions.” [European Commission, 2014].
This waste should be treated following the hierarchy shown in figure 2.1.2. However there are parts of the waste that cannot be reused or recycled. Therefore combustion to produce power and heat is the most suitable treatment in order to mitigate the severe problems of waste management and greenhouse gas (GHG) emissions.
Figure 2.1.3 million tons GHG emissions from municipal waste management in the EU [European Environment Agency, 2013]
Figure 2.1.3 shows how incineration of MSW reduces GHG emissions. Incineration reduces GHG emissions according to the figure 2.1.3 approximately 25 Mton CO2-equivalent in 2010. Nowadays, the tendency is reducing the amount of landfilled waste, reducing then the annual CO2 emissions and therefore contributing to reduce Green House Effect. It is inevitable that a small part of the waste goes to the landfill.
Landfill gas is mainly made of methane. The constant monitoring and control of this gas is essential to avoid serious problems such as explosions or excessive emission. This element is one of the main founders of greenhouse effect. These and much more problems will be solved using the waste as a fuel in controlled combustions. [Johnsson, 2010]
The composition of the MSW is diverse and it depends on in many factors, which have to be considered when designing the different treatments for the waste. The main factors are [FhG-IBP, 2014]:
● Demography (age structure of the population) ● Season
● Geography (regional or local conditions) ● Waste collection method
● Provision and scope of recycling schemes
● Legislation, like local policy on the collection of waste, e.g. compostable waste ● Lifestyle impacts.
Figure 2.1.4 MSW composition EU [FhG-IBP, 2014]
Figure 2.1.4 shows how the waste is divided in several sub waste depending on its origin [T Rand et al., 2000]
● Domestic Waste: Waste from household activities. In lower-income countries, domestic waste is dominated by food and ash. Middle- and higher-income countries have a large proportion of paper, plastic, glass, metal and hazardous matter.
● Commercial Waste: It comes from shops, offices, hotels and similar. It mainly consists of packaging materials, office supplies and food waste.
● Institutional Waste: Waste from schools, hospitals, government offices, etc. It is similar than both domestic and commercial but it contains more packing and office supplies than food.
● Industrial Waste: The composition of the industrial waste depends on the kind of industry from where the waste comes from. Normally it is similar than commercial and domestic waste. However some industries work with hazardous material.
● Street Sweeping: Composed of dust and soil with varying amounts of paper, metal and other litter from the street.
● Construction and Demolition Waste: It corresponds to soil, brick, concrete, ceramic materials, wood, packaging materials, etc.
In order to use the waste in the production of power and heat it is crucial to analyses the heating value. It means the ability of the waste to sustain a combustion process without supplementary fuel (T Rand, etc. 2000). There are two levels of heating value: low and high heating value. The one which is the most relevant for the combustion process is the low heating value (LHV) which means the net energy that is released when burning the fuel and subtracting the heat required for vaporisation of the water included. These values will change depending on the final composition of the MSW. As an example, the organic parts of the waste have LHV from 12 to 14 MJ/kg, whereas plastics or rubbers go up to 30 MJ/kg. This
value indicates the amount of energy released from the combustion of one kilogram of waste. The differences between the LHV can be seen easily in the next table:
Table in appendix 7.2.1 shows the LHV for subgroups of waste components. There are significant differences between the different types of waste. For a correct combustion in the incineration chamber it is necessary to have a homogeneous mixture. By mixing the waste, decent values of LHV can be achieved. An approximation of the LHV can be got as follows:
In MJ/kg [T Rand, etc. 2000]
HHV is the high heating value, C is the combustible fraction and W is the moisture of the raw waste. How much heat is released when the water condense at 25 °C must be taken into account. It is known as a vaporization heat and which in terms of temperature it corresponds to the constant 2.445 MJ / kg. The average LHV for MSW used for calculations in this report is 10.7 MJ/kg [FhG-IBP, 2014].
2.2 The Incineration And Gasification Process
The two categories for the usage of MSW and syngas as a fuel are explained in this part: ● Incineration process
● Gasification process
Both categories can be used in a CHP system to produce heat and power.
In the first category to get power and heat from burning waste with no pre-treatment the incineration process is used. Incineration means a controlled burning process of a fuel in an enclosed area with excess of oxygen. Combustion, which means burning the fuel, is an exothermic chemical reaction [Turns, 2011]. How the combustion works depends on what kind of fuel is used, in case of MSW there are a primary combustion and secondary combustion. The primary combustion includes burning the MSW and turning it into flue gases and ash, which occurs in a furnace that can be a grate furnace or fluidized bed. Meanwhile the secondary combustion completes the combustion of the flue gas. The flue gas is moved to a waste heat boiler where the heat is used to create steam from water with high pressure which moves the turbine to generate electricity and also used for district heating [Turns, 2011]. To make a complete combustion of MSW these four steps shown in figure 2.2.1 are needed:
Figure 2.2.1 Combustion process [Turns, 2011]
1. Drying: This step occurs at approximately 100 grades Celsius. By burning the solid fuel the water vaporizes and therefore leaves the fuel dry. The drying process requires heat, which can be obtained by another heat source for example burning oil or from previous combustion of the solid fuel.
2. Pyrolysis: This step takes place after the drying process and occurs at approximately 200 to 300 grades Celsius. During this process volatile products are produced. These products are gases as CO, CO2, CH4, CnHm, NH3, H2 and tars. The decomposition of MSW requires heat. After this process approximately 70 % of the MSW is reduced and the solid left is called char.
3. Combustion of gases: In this process the volatile gases gets mixed with oxygen, which makes a chemical reaction to begin where the products are heat and carbon dioxide. The heat provided helps the solid fuel to undergo the first and second process.
4. Combustion of solid char: After the gas combustion is finished the oxygen reaches the surface of the char and a chemical reaction begins that produces heat.
Figure 2.2.2 Gasification process [Gasification technologies council, 2011]
Figure 2.2.2 explains the second category of using syngas produced from MSW as a fuel. MSW is turned to syngas by a gasifier; the gasifier can be a fluidized bed or a moving bed. In the gasification process, MSW is converted into syngas which can be used as a fuel in a CHP gasification technology with a gas turbine which comprises of a compressor and a downstream turbine and in between it has a combustion chamber to combust the gas to produce electricity and use the heat in the flue gases in a heat exchange system to produce heat used for district heating [Rogers et al., 2008].
The gasification process of MSW shown in figure 2.2.2 can be explained as a thermochemical process that involves the reaction of carbon, contained in MSW with an oxygen contained mixture which can be air, oxygen etc. The process of gasification is similar to the process of combustion but in the case of gasification there are two main stages. The first important stage is where volatile components are released which results in a char that consist of fixed carbon and inorganic compounds. The second important stage is the reaction of the carbon consisted in the char with steam, air or oxygen. The main difference between combustion and gasification is in gasification the amount of excess air or oxygen is more controlled to prevent a full combustion. Gasification is mostly exothermic but just like combustion of MSW it needs some heat to initialize the gasification process [Zafar, 2009].
The main product produced is syngas, which contains hydrogen, monoxide and methane. Gasification with steam gives as a result more hydrogen and carbon dioxide consisting in the gas. With air it gives a high nitrogen gas, which gives low energy value in the gas, but with oxygen it gives more carbon monoxide and hydrogen consisting in the syngas, which gives a high-energy value. The main reactions in the gasification process are either endothermic or exothermic [Klein et al., 2003]:
This product can be cleaned up even more to reduce particulates, mercury, sulphur and other unconverted carbon. When the syngas is cleaned it can be sent to a power plant to produce heat and electricity or to a chemical industry to produce chemicals or other consumer products depending on the demand [Gasification technologies council, 2011]. For every kilo of raw material, MSW produces 0.8-1 Nm^3 [Zafar, 2009]. The syngas has an approximate LHV of 6.7-9.8 MJ/NM^3 [Tasma et al., 2012).
2.3 Comparison Between Two Technologies 2.3.1 CHP Incineration Technology
Figure 2.3.1 Schematic description of the process of CHP incineration
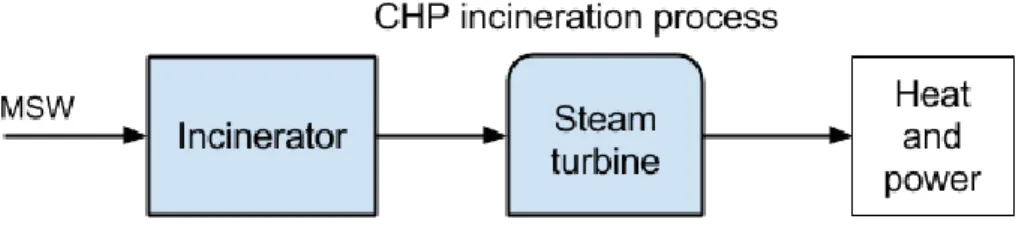
Figure 2.3.1 is showing the process using MSW to produce power and heat. When MSW is burnt in the combustion chamber, heat is produced in order to turn the water into steam in the boiler. The steam flows through the pipes until it reaches the steam turbine. The steam spins the turbine and therefore of the generator producing electricity. The heat remaining in the steam is transferred to the district heating system, which heats residential buildings, commercial buildings, institutions etc. [United States Environmental Protection Agency, 2015].
The energy recovery system has many components that are used to convert the energy from combustion of the fuel into energy used for various applications. The primary component is the boiler. The boiler most common is the steam boiler used for converting water to steam, which is used to turn the steam turbine. The average boiler efficiency in Europe is 81.2 % [Ryu et al., 2012]. The other components used are the economizer, its function is heating the water just below boiling temperature and the superheater is a component that re-heats the steam produced by the boiler to increase its thermal energy and therefore decrease the
There are many types of steam turbine but the one most used for CHP incineration plants is the backpressure turbine, which has efficiency approximately between 20-25 % [Ryu et al., 2012].
2.3.1.1 The Strengths Of The Incineration Process
The incineration process has many strengths which is mentioned in the book “Waste management” where the most important strengths are:
● Large reduction of MSW volume.
● Destruction of pathogens i.e. bacteria by the heat. ● Bad smell minimization.
● Elimination of the organic materials in the MSW. ● There already exist emissions control system. ● The technology is established and matured. ● The quality of the feedstock is not essential.
● There are a lot of available raw material coming from residential and commercial buildings and industries.
● No need for large area of raw material storage.
2.3.1.2 The Drawbacks Of The Incineration Process
The incineration process has many drawbacks which is mentioned in the book of “Waste management” where the most important drawbacks are:
● It produces dangerous particles and gases for human health for example toxic dioxins and furans. These are produced from burning PVC-containing plastics.
● All clean up take place after combustion. Because it is very difficult to clean MSW before incineration to prevent producing toxic particles.
● Incinerator ash is not recommended to be used in commercial products.
● Low steam quality, because the flue gases has corrosive particles that must be cooled down by air from a temperature of approximately 650 grades Celsius to 500 grades Celsius which corresponds steam temperature of approximately 450 grades Celsius and that is to prevent the boiler from corrosion. Therefore the flue gases will have lower heat when reaching the boiler, which give the steam lower quality.
● NOx and SOx emissions problems. ● Drying of the MSW is needed. ● Low energy efficiency.
● Expensive emission control
2.3.2 CHP Gasification Process
Figure 2.4.1 Schematic description of the process of CHP gasification
The figure 2.4.1 is showing the process using syngas as a fuel to produce both heat and electricity. There are two sub-technologies in the CHP gasification plant. One that uses a steam turbine as the main component and the other uses both gas turbine as the main component and a steam turbine as secondary component. In the second technology, syngas is burnt as a fuel in the gas turbine. When the fuel is combusted then flue gases are produced. The heat from these flue gases are recovered in the heat recovery unit whose performance is similar to the energy recovery system mentioned before in the section of 2.3. In this case it will not be steam water but gas from the combustion what makes the turbine rotates. The air flows through the compressor built on the same shaft as the turbine. The compressor increases the pressure of the air. Figure 2.4.2 shows a simple design of the gas turbine. Both air and syngas are mixed in chamber and the combustion is produced. The gases produced during the combustion turn the turbine. This rotation makes the generator spin to produce electricity. The efficiency of the gas turbine 40 % [Siemens, 2015]. The flue gases are transported to the heat recovery system where the flue gases is used to heat water and produce steam that can rotate the steam turbine in order to produce more electricity and the heat left from the steam turbine can be transferred to the district heating system where it is distributed to buildings, institutes etc. [United States Environmental Protection Agency, 2015].
2.3.2.1 The Advantages Of Gasification Process
The gasification process has many advantages which is mentioned in the book “Waste management” where the most important advantages are:
● Higher efficiency of energy recovery ● Less emissions than incineration
● There are a lot of available raw material coming from residential houses and industry ● The syngas produced can be used in both as a fuel to produce heat and power and also
as a material in the chemical industry.
2.3.2.2 The Drawbacks Of Gasification Process
The gasification process has many drawbacks which is mentioned in the book “Waste management” where the most important drawbacks are:
● The gasification technology is less matured than incineration technology. ● Disposal problem for example heavy metals and ash
● Drying of MSW is needed ● Complexity of the technology
● Has not been commercially developed for pulp and paper MSW treatment. ● High investment and maintenance cost
2.4 The Cleaning System Of CHP-incineration And Gasification Systems
2.4.1 Pollutants
The combustion of both the MSW and syngas could not be suitable without a gas cleaning system. The composition of the fumes might be very diverse. The mainly components are:
● Fly ash.
● Nitrogen Oxides (NOx) ● Acids
● Carbon monoxide and volatile organic compounds
In this part the different pollutants will be described and also a small comparison between the emission of the two alternatives.
2.4.1.1 Fly Ash
There are two types of particles that could become fly ash. Solid particles consist in non-combustible material from the MSW such as metal, glass, slices, etc. and condensable particles that during the combustion due to the high temperatures they will sublime which means they change to gas but when the fuel gases leaving the furnace start cooling down they will change phase into solid particles. This type normally is metal with low condensation temperature like mercury. There are diverse problems with fly ash, like visibility or air quality but undoubtedly the main problem is when these particles are less than 10 microns. They can enter in the respiratory system of the humans producing health problems.
The fumes contains many particles of many sizes so it is primordial to dispose of the biggest particles first in order to avoid saturation of the following devices and keep good levels of efficiency of the devices. Therefore, cyclones will be the first element of the cleaning process that will be set. The efficiency of this device decreases, as the particles are smaller. The average diameter captured is over 100 μm from [Flagan, 1988].
Electrostatic precipitators (ESP) is a very effective method which has around 95% efficiency which is based on creating an electric field which attracts mainly metals by ionizing the particles. It also catches dioxins. In order to establish the electric field, high voltage is needed. Hence, an electric corona discharge will be set between cathode and anode, ionizing the gas around the electrodes. This produces the movement of the ionized fly ash particles to the collector. The dust collected will create a layer around the collector plane. This layer has a resistivity which will affect the efficiency of the ESP. Maintenance will be essential for a well performance. Another key factor of this system is the velocity with which the air enters. It should be around 0.8 m/s or below [Quina, 2011].
Fabric Filters, commonly known as baghouse, fabric collectors use filtration to separate dust particulates from dusty gases. Dust-laden gases enter the baghouse and pass through fabric bags that act as filters. The bags can be of woven or felted cotton, synthetic, or glass-fibre material in either a tube or envelope shape.
2.4.1.2 Nitrogen Oxides
There are two main ways in which the NOx can be produced: conversion and thermal fixation. The nitrogen of the MSW can be oxidized depending on the peak operation temperature of the flame, amount of estequiometric air during the combustion and chemical structure and amount of nitrogen. It is known as conversion. Moreover, nitrogen in the flue gases can react at high temperatures with oxygen to produce NOx. It is known as thermal fixation. The formation of this pollutant depends on the amount of nitrogen and the design of the burner and its operating temperature. The source of nitrogen in the MSW corresponds to yard and food waste. A normal temperature in the incineration of the MSW is around 900-1000 ºC; therefore the NOx will be formed by conversion mostly [Quina, 2011].
There are several approaches to solve NOx emission. This study will focus on the most used ones.
Combustion modifications, it means changing parameters of the design and operating features:
● Varying the speed of MSW input. ● Auxiliary burners in the furnace.
● Several chambers with different air conditions.
● Using lower temperatures in the combustion process (it can affect the efficiency of the process)
A variation on the fuel gas recirculation can help reducing NOx. Selective catalytic reduction, injecting ammonia (NH3) into the fuel gases will originate the following reactions:
As a result NOx are replaced by water and nitrogen. The efficiency of this cleaning method is around 70-80%.
2.4.1.3 Acids
This type of pollution has been of concern because of potential hazardous effect such as: health and respiration problem for humans, damaging the environment (acid rain, etc.) and due to its high corrosiveness, incinerators and nearby structures could be affected. Thus, it is important to clear acid gases.
The principal acid gases emitted from MSW incineration are: sulphur dioxide (SO2), hydrogen chloride (HCl) and minor gases such as sulphuric acid, hydrogen fluoride and hydrogen bromide. Normally are they controlled using scrubbers, which add alkaline reagents that react with the gases to form salts that are then collected and landfilled. There are three main types of scrubbers (Congress of the US, 1988):
● Wet scrubbers use a liquid alkaline absorbent. Under optimal condition it can remove 95% of HCl and 85% of SO2. The temperature of the gas after the process will drop to 38ºC
● Dry scrubbers inject lime in a dry state into the flue gas. They use more reagent than wet scrubbers. The removal efficiencies are 90 % for HCl and 70 % for SOx
● Spray dry (or wet-dry or semi-dry) scrubbers. Atomized liquid such as lime slurry is used. The process will produce dry particles since the water evaporates. The final temperature of the process will be around 150 ºC.
Some of the collected acid will be reused.
2.4.1.4 Carbon Monoxide And Volatile Organic Compounds
The apparition of CO and volatile organic compounds is signal of inappropriate burning conditions. There are some adjustments of the combustion process, which can be adopted in order to decrease the amount of both components [Congress of the US, 1988]:
● Increase the stoichiometric excess of air in the furnace by means of increase of raw air inlet to the furnace and reduction of the flue gas recycling to the furnace.
● Increase the pressure below the grid.
These adjustments will have indirect effect on other elements in the combustion like organic compounds. Increasing the stoichiometric excess of air will be helpful if during the combustion part of the fuel has high contents on halogens. However, the energy recovery efficiency will be reduced due to the increment of N2, which has to be heated-up. Increasing the pressure below the grid is especially effective for waste with high percentage of moisture.
2.4.2 Emission Comparison Between The Thermal Conversion Paths Once the pollutants are introduced, it is necessary to go more in detail to know what is really happening depending on the type of option selected. The reactions, which are carried out, are the main tool to achieve that purpose but also the properties of each alternative.
2.4.2.1 Incineration
The MSW can be pre-treated before it is burnt in order to achieve better properties of the fuel and more homogeneity. Even though it will not create a perfect homogeneous fuel. This will cause irregular combustion over the chamber having different temperatures and conditions. Irregular conditions favour the creation of pollutants in the combustion process [McKay, 2002].
Since the MSW are being burnt directly, the volume of the flue gases is much higher than the flue gases when burning syngas in the gasification process. It will affect in the cleaning system, as it is needed to clean a bigger volume of emitted gases from the combustion. It is translated into a bigger, more complex and more expensive devices for the cleaning up of the pollutants.
Burning MSW directly will produce large amount of impurities, as it does not need to be cleaned it before burning it. Acids and other corrosive compounds will be generated. The hot fumes of the combustion will carry these dangerous gases. In theory the hotter the fumes, the better since our objective is heating the water, which is flowing through the heat exchanger. However, in practice if the exchanger is too close to the combustion reaction, all these corrosive gases and impurities mentioned above will condensate on the device components and therefore it will be corroded and the heat exchange area reduced. So it is necessary to let the gases cool down before approaching the exchanger. Acting in this way the impurities and corrosive compounds will condense before hitting the exchanger avoiding then the lost of efficiency or malfunction of the device. Nevertheless, as the gasses now are with lower temperature, less efficiency will be obtained [Walter, 2002].
The temperatures in the incineration process of MSW are limited since the great amount of moisture presented on it. Thus, this led to lower temperatures in the heat exchanger, which lead to lower efficiency [McKay, 2002].
In the case of incineration, these are the reactions that define the combustion process [Wilson, 2014]:
1. Oxidation of Carbon 2. Oxidation of Hydrogen
3. Oxidation of Nitrogen (from intermediate reactions) 4. Oxidation of Sulphur (from intermediate reactions)
2.4.2.2 Gasification
In this case the final fuel which is burnt is a gas therefore the composition is even and homogeneous. The process of gasification clears all the “unnecessary” volume of waste. Only the gas fuel will form the final volume burnt. Therefore, as the final volume that is burnt is much less than in the incineration process because of more controlled stoichiometric air, which results in less flow of pollutants, will be produced. Thus a less complex, more efficient and cheaper cleaning system can be achieved.
With this method, the temperature can be much higher than in the incineration method. The fuel does not have moisture, acids and impurities since it is cleaned before being burnt. Therefore the temperature is not limited and the heat exchanger can be closer to the combustion process as there is no risk of condensing hazardous compounds on the exchanger reducing its efficiency and corroding it [Gasification Technology Council, 2011].
In the case of gasification the equations are listed according to the importance during the process of combustion. These equations depend on the procedure selected [Wilson, 2014]:
1. Gasification with Carbon Dioxide 2. Gasification with Steam
3. Gasification with Steam 4. Gasification with Hydrogen 5. Water Gas Shift Reaction 6. Gasification with Oxygen 7. Gasification with Hydrogen 8. Gasification with Hydrogen 9. Gasification with Oxygen
From equation 8 it can be deduced that the sulphur produced is converted to hydrogen sulphide in an exothermic reaction instead of SOx. In the case of finding chlorine in the waste it will be transformed to HCl under the same process as the sulphur. Since both hydrogen sulphide and hydrochloric acid are high acidic they will react easily with alkaline materials in the acid gas removals or scrubbers, being that process of high efficiency.
2.4.2.3 Final Comparison
As a result the benefits of the gasification compared to incineration are:
● Less oxidation of fuel bound sulphur and nitrogen to form SOx and NOx.
● Little or no formation of dioxins and furans in gasifiers compared to incinerators. ● Little or no "thermal NOx" is generated by properly operated gasifiers.
● Some of the moisture in the fuel is converted to hydrogen (eqn.2) in the reducing atmosphere, which enhances the calorific value of the clean burning syngas fuel. ● Better steam conditions.
● Less flow of gasses emitted to be cleaned. ● The boiler life becomes longer.
2.5 Investment
Investing in CHP system when using MSW as a fuel requires a big capital to purchase and install the applications of CHP-system some of them are already mentioned in section 2.3 and 2.4.
The main applications in the CHP incineration technology is a moving grate, the energy recovery system which has a boiler, a superheater, the economizer, the emission cleaning system and the power and heat production system which has a steam turbine and a generator. On the other side it is CHP-gasification technology, depending on what kind of sub-technology used the components will be different. In the CHP-gasification steam turbine the components mentioned above and replacing the moving grate to a gasifier and the cleaning system to a simpler one. In case of the CHP gasification combined cycle, the gas turbine, which comprises of a compressor, the chamber and turbine blades and the generator has to be connected to the gas turbine, emission cleaning system, the steam turbine and the energy recovery system.
According to a study made by J.D. Murphy and E.McKeogh shows that both capital cost (Investment cost) and operation and maintenance cost in CHP incineration technology shown in appendix 7.2.2. Table in appendix 2.2.2 shows the capital cost of CHP system using MSW as fuel in Denmark. It is around 650 € per ton when building CHP system of a size capacity of 40 kilo ton MSW per year. The operation and maintenance cost is 48.8 € per ton. It also shows that the cost is around 560 € per ton per year if the size capacity is 230 kilo ton MSW per year with 36,5 and the operation and maintenance is 36.5 € per ton.
Implementing an approximated relationship between the costs of the CHP incineration technology and the CHP gasification technology, by putting a factor to calculate the investments costs, can approximate the costs of investment in the CHP gasification technology. The factors should be higher than one in both the capital cost and the operation and maintenance costs because of the technology is not matured and therefore a new competence is needed which costs more than a matured technology.
In appendix 7.2.3 shows the different prices for each month in Sweden. The average of these prices will be taken into account for getting the result of the study which is 31,61 €/MWh. This price is what the company gains from producing one MWh power to the customer. What the customer actually pays is approximately 110 €/MWh because of the taxes, distribution costs are included.
The Price of the heat to the customer was also selected from Sweden for the year 2014. The average family houses in Sweden are considered to medium size. The price selected is 80 €/MWh (Svensk Fjärrvarme, 2014). To calculate an approximated price of what the company gains from producing one MWh heat a relationship between the power and heat price is going to be implemented and described in the method section 3.
The income from using MSW is coming from both selling the power and heat produced and income from the community, industries and households who pays fees to manage their waste. The income from the municipality, industries and households is mentioned in a study made 2005 by avfall sverige is between 30 and 60 €/ton depends on how many ton and if the waste managed is sorted or unsorted (Avfallssverige, 2005).
3 Methods
The information from the whole report has been extracted from different sources: research articles, academic books and webpages. All of them are collected at the end of the report in the reference section.
In our case, it has been set a proper setting in which the two systems can be compared as fair as possible. In this setting, two different conversion paths will be compared. One of them will use the MSW as a fuel. However, in the other case MSW will convert in a gasifier to form syngas. The main objective of both of them is producing electricity and heat. Therefore, a common factor should be set as a fix variable, which will be shared during the study.
In order to get the result some formulas and analysis have been applied. With the aim of following a well-structured and efficient way of procedure, a model of the problem solving flow are created in figure 3.
An interview was done with Niclas Åkerlund who works in Fortum Högdals CHP-incineration plant as a team manager has confirmed some of our assumptions and input data. The interview is mentioned in the appendix 7.1.
3. The process of the work
3.1 Assumption:
● The district heating has distribution and tax costs just like the power has.
● The investments cost from table 2.6.1 are approximately equal to the investments cost in Sweden.
● The factor of the investments cost for CHP-gasification is 1.0-1.5 because the technology is still not matured.
● The heat produced from incinerating MSW cools down approximately 20 %, because in the research paper “High Temperature Corrosion During Waste Incineration” written by Peter Viklund mentioned that to prevent corrosive particles in Waste incineration from reaching the boiler is done by cooling the flue gases from approximately 650 Celsius degrees to 500 Celsius degrees. Which means reduction of 20 % of energy.
● All the energy in the steam is used either by converting it to power in the steam turbine or to district heating.
3.2 Case Of Study
3.1. Schematic description of the CHP Incineration and CHP gasification processes
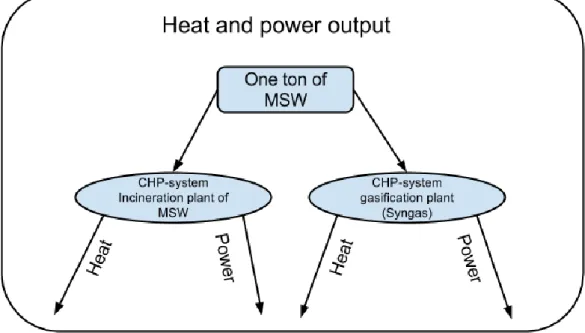
The case of study is make a comparison between MSW and syngas converted from MSW in CHP technology. The first technology is called CHP-Incineration plant and the other one is a CHP-Gasification plant. CHP gasification plant can be used in two processes. The difference between the processes is that the first one uses a steam turbine just like in the incineration process while the second one uses gas turbine plus a steam turbine. Figure 3.1º is showing a model of the two technologies compared.
The calculations will be based on one ton of MSW as a feedstock in both CHP-plants in this way the results will be easier to show.
3.3 Comparison the two path conversion in a CHP System 3.3.1 Efficiency
Figure 3.3.3.1 The efficiency of using one ton of MSW for both CHP-systems
In the process of calculating the thermal efficiency of the two fuels in CHP-technologies it has been looked at one ton of MSW processed in the two technologies as mentioned in section 3.1.
To calculate the thermal efficiency, the formula taken from the thermodynamic book written by Granryd Ekroth has been used:
(1)
To use this formula, the following data will be needed:The maximal energy production, which can be calculated by the following conversion equation:
(2)
The LHV of MSW is mentioned in section 2.1. to be 10.7 MJ/kg. The final result using the equation above is 2970 kWh/ton.
The LHV of syngas converted from MSW is mentioned in section 2.2 to be between 6.7-9.8 MJ/Nm^3, the calculation are based on the average and in the unit of kWh/ton by assuming that 1 kg of MSW converted to syngas is equal to 1 Nm^3 mentioned in section 2.2 which becomes 8.75 MJ/kg. Using the same equation above the LHV of syngas is calculated to be
2430 kWh/ton. The generated energy production can be calculated by first knowing the energy recovered from the complete burning of the fuels.
Table 3.3.3.1 Efficiency data [Ryu et al., 2012]
Steam turbine efficiency (
)
23%Gas turbine efficiency ( ) 40%
Boiler efficiency (
)
81%1.
In case of CHP incineration with a moving grate technology the complete burning of MSW is calculated by equation (2). Which gives 2970 kWh/ton, which is also cooled down before reaching the boiler as mentioned in subsection 2.4.2 so that no corrosive particles reach the boiler. Its assumed that the heat lost around 20 % so it can be concluded by using equation (3) that the heat reaching the boiler is 2380 kWh/ton.(3) Equation 10 shows how to calculate the energy reaching the boiler where represents the percentage loss from cooling.
By using the data from the table 3.3.3.1 and equation (11,12,13) can get the generated power and heat, the power efficiency and the heat efficiency.
(4)
(5)
(6) With help of the equations (1, 2, 3, 4) can the overall thermal efficiency be calculated.
2. In case of CHP gasification steam turbine technology by using equation (2) the complete burning of syngas can be given. Which gives heat of 2430 kWh/ton. By using the data from the table 3.3.3.1 and equation (7, 8, 9) can get the generated power and heat, the power efficiency and the heat efficiency.
(8)
(9) Lastly with help of the equation (1, 2, 7) can the overall thermal efficiency be calculated.
3.
In case of CHP gasification with a combined cycle technology the complete burning of syngas gives a heat of 2430 kWh/ton by using equation 2. The combined cycle efficiency will be calculated with help of the data in the table 3.3.3.1 and with the sum of the steam turbine efficiency and equation 3:
(
)
(10)
Equation (10) is used to calculate the combined cycle efficiency represents the combined cycle efficiency, which also equals to the power efficiency, is the gas turbine efficiency and is the steam turbine efficiency and is the boiler efficiency. Combined cycle efficiency becomes approximately 51 %.
(
)
(11) Equation (11) shows how to calculate the heat efficiency.
The following equations are used to calculate the generated power and heat.
(
)
(12)
(
)
(13)
(14)
Equations (12, 13, 14) are used to calculate the generated power and heat. Where means the generated power and heat in CHP gasification cc technology, means the heat produced and is the power produced.3.3.2 Economic
There are two economic methods that help to calculate the profitability to compare the usage of these fuels. These methods are the Payback method and the Net Present Value method. The values that are essential for calculating the profitability are mentioned below:
The revenue per year of the whole process can be obtained from the next formula:
(15) Where R is the revenue per year, I is the income per year and U is the total cost per year. The income I come from the next formula:
(16)
Where Ee is the amount of power produced in MWh, Pe is the current price of the electricity in €/MWh, Eh is the heat produced in MWh and Ph is the current price of the heat in €/MWh and S is the income from municipalities from managing MSW.
Power and heat already introduced in the efficiency section 3.3.1. Basically they are the outcome of the power plant and they depend on the whole efficiency of the power plant. A more detailed description will be provided further.
The relationship between incineration and gasification investment cost will be calculated by applying a factor (f) on the capital cost of incineration (COI). Below, the formula is used to calculate the capital cost of gasification (CCOG):
(17)
The factor for capital cost was chosen between 1.0-1.5, the capital cost can be lower if the technology used is matured.
(18)
The factor chosen here is between 1.0-1.1.
The revenue from the heat that the company gets can be calculated by the relationship below:
(19)
Pec is the price of electricity to the customers and Phc is the price of heat to the customers. Which means the proportion of the power price times the heat price for the customers. That assumption is made because the heat has also distribution and tax costs as mentioned in the assumption section 3.1.
The current prices of the electricity and heat average for a year becomes: Heat price is 23 €/MWh (from calculation above)
Electricity price is 31.6 €/MWh (Nord pool spot, 2015)
Note: the values has been approximated from the sources
3.3.2.1 Payback Method
The output of this method is the number of years in which the investment in the project will be recovered. It ignores the time value of money and any benefit obtained after the application of the method.
The payback method has been also applied in the analysis (Brealey, 2011). It is defined by the PC (initial investment cost) and R (revenue).
(20)
Where PB is the payback method and measured in number of years.
3.3.2.2 Net Present Value
In this case the cost of capital will be considered. It have been decided maintain the same value for the whole time analysis. In this case the Net Present Value (NPV) is defined as followed [Brealey, 2011]:
∑
(21)
Where R is the revenue (or net cash flow), i is the cost of capital, n is the number of periods and PC is the initial investment cost.
3.3.3 Pollution
The pollutants that will be compared in this report are: Nitrogen oxides, particles, sulphur dioxide, hydrogen chloride, hydrogen fluoride and heavy metals.
The amount of emission has been obtained from other researches so the final result will be focused on comparing and analysing these results.
3.4 Sensitivity Analysis
This analysis is useful to see how the outputs of the system change when one or some of the parameters are changed. In our study two different studies have been done.
In the first one the price of the energy will be changed. It is expected to see great differences between both of the fuel since the efficiency of the process, the LHV as well as the expenses differs between them. Both of the models will be compared in terms of final benefits get from the power and heat production.
Meanwhile in the second case the parameter that has been changed is the capacity of management of the power plant. It is expected to see how the two different power plants can adapt to changes in the flow of waste. Also it is expected that to see differences in the final benefit of both process.
4 Result And Discussion
4.1 The overall economic performance of the two paths 4.1.1 Payback Method
The result obtained from this method are resumed in the table 4.1.1: Table 4.1.1 Payback method
Type of CHP technology
Capital Cost €/ton O&M €/ton Income €/ton Profit €/ton Payback years CHP Incineration plant 605 43 93 50 12 CHP Gasification s 756 45 94 49 15 CHP Gasification cc 908 47 104 57 16
Figure 4.1.1 Payback year
As it can be seen from the table 4.1.1, the capital cost of CHP gasification costs more since it is a new technology and more complex equipment in case of gasifier is needed. It has been assumed for CHP gasification that the capital cost is 1.25 times higher than for the CHP incineration technology. The capital cost of the CHP gasification cc is 1.5 times higher than CHP incineration technology due to the gas turbine. In the case of the O&M cost it has assumed 1.05 and 1.1 respectively. They are new technologies therefore they will need more supervision and maintenance.
Figure 4.1.1 shows the result of the payback method where CHP incineration plant needs 12 years to become profitable while CHP gasification cc needs 15 years and CHP gasification cc needs 16 years until it pays for the investment done. That means the CHP incineration plant is more profitable to invest in in this case.
0 2 4 6 8 10 12 14 16 18 CHP I CHP GS CHP Gcc
4.1.2 NPV Method
The cost of capital is chosen to 2% because the average rate of interest in banks for big business loans in Sweden is 2 % according fundcurve. It has been considered this value as risk-free discount rate, which means that it is the minimum rate of interest that is required by the producer.
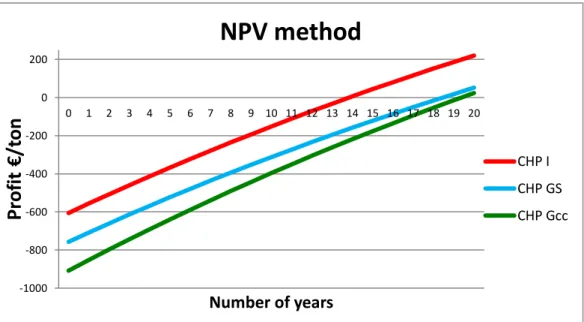
Figure 4.1.2. Profitability in case of using net present value €/(ton of MSW)
The economic life is 20 years as mentioned in subsection 2.5. Figure 4.1.2 shows which. Technology is more profitable with time when applying the cost of capital. The net present value at the year 20 in the economical life of the CHP incineration technology is around 221 €/ton, while in case of CHP gasification using steam turbine it is around 52 €/ton and in case of CHP gasification using steam and gas turbine it is around 24 €/ton. This means that CHP incineration technology is more profitable to invest in even with the cost of capital and that CHP gasification technology is also profitable but less profitable than CHP incineration technology
4.2 Emission depending on the path selected
The pollutants compared have been the most relevant regarding emissions. In the next graph can be seen the grams per ton of MSW that is produced for the two fuels:
-1000 -800 -600 -400 -200 0 200 0 1 2 3 4 5 6 7 8 9 10 11 12 13 14 15 16 17 18 19 20
Pr
o
fi
t
€
/t
o
n
Number of yearsNPV method
CHP I CHP GS CHP GccFigure 4.2.1 Pollutants in CHP gasification and CHP incineration [Zaman, 2010]
The most relevant difference can be found on the emission of NOx. The emission in the CHP-gasification plant is less in NOx, particles HCl and HF by approximately half.
4.3 Overall efficiency
Figure 4.3.1 Efficiency of thermal treatments
The efficiency of both CHP-systems is mentioned in the table above. The thermal efficiency of the incineration plant is 65 %, on the gasification s is 83 % and on the CHP-gasification cc is 86 %, which means that the CHP-system with the best efficiency is the CHP-gasification cc. When focusing on power efficiency the CHP-gasification cc is more efficient than the CHP-incineration plant and CHP gasification s. Where the efficiency of the power produced in the CHP-Gasification cc plant is 23 % more than the other alternatives however the efficiency of the heat produced is less.
0 400 800 1200 1600
NOx Particles Sox HCl HF Heavy Metals
g/ to n
Environmental Performance
Incineration Gasification 0% 20% 40% 60% 80% 100% CHP I CHP GS CHP Gcc Power efficiency Heat efficiency4.4 Sensitivity Analysis
In this point of the report it has been made three different sensitivity analyses. The objective is knows how the different parameter changes when one or more variables of the system are varied. These results will help to make further and more precise conclusion about the two technologies
4.4.1 Maturity Of CHP-gasification Technology
If it is assumed that with more research and development on the CHP gasification, the capital cost and the O&M costs will be lower since this technology will be more mature. Then a sensitivity analysis has been made base on the previous statement
It has been set 10 steps of development in which the more steps done the lower the cost for the gasification technology. The development cost is not considered in the power company side but in an external entity. The last step chosen is when the capital cost and O&M cost is equal to the CHP-incineration investment costs. Each maturity step shows that more research has been done so the costs of CHP Gasification technology have been reduced. It is assumed that the incineration technology is already matured which means its cost have reached the lowest level.
As the table 4.4.1 shows that the first at the 5 development step, the CHP gasification steam turbine (CHP gasification s.) will let the technology to be mature enough to be equal to CHP incineration costs. While in case of the CHP-gasification combined cycle (CHP gasification cc) technology it demands 10 steps to reach the maturity to equal to the CHP-incineration technology in case of investment costs.
Table 4.4.1. Steps of maturity
Steps of
maturity Capital cost factor CHP gasification s O&M factor CHP gasification s Capital cost factor CHP gasification cc O&M factor CHP gasification cc
0 1,25 1,05 1,5 1,1 1 1,2 1,04 1,45 1,09 2 1,15 1,03 1,4 1,08 3 1,1 1,02 1,35 1,07 4 1,05 1,01 1,3 1,06 5 1 1 1,25 1,05 6 1 1 1,2 1,04 7 1 1 1,15 1,03 8 1 1 1,1 1,02 9 1 1 1,05 1,01 10 1 1 1 1
Figure 4.4.1. Profit when technology matures
The figure 4.4.1 shows how much profit does each technology get for each step. The one most profitable according to the result is the CHP gasification cc. This technology is almost double the profit of CHP-incineration technology when the technology is on the last step of maturity. That means the CHP gasification technology is better to invest in when it is matured. The result also shows that in step 5 of maturity the CHP gasification technology becomes more profitable than incineration.
4.4.2 Cost Analysis
For this analysis it has been set two different study cases. The actual tendency of the electricity prices is rising on the market so it has been assumed that in the future the price of the electricity will be higher. It has been set 9 different steps in which the price for the electricity increases 6 %. The heat price will be fixed to 25€/MWh.
0 100 200 300 400 0 1 2 3 4 5 6 7 8 9 10
Pr
o
fi
t
€
/t
o
n
Maturity stepsMaturity of CHP technologies
Profit NPV CHP I Profit NPV CHP GS Profit NPV CHP Gcc 0 150 300 450 100% 106% 112% 119% 126% 134% 142% 150% 159% € /( 2 0 y e ar s)Power price increase %
Increment of 6% Elect Price each Step
CHP I CHP GS CHP Gcc
Figure 4.4.2.1 Power price change
Figure 4.4.2.1 shows that CHP gasification cc T. will be more profitable than CHP incineration when the electricity price is 48 €/MWh. (The cost for the technologies have not been varied for this analysis)
Figure 4.4.2.2 Heat and power price change
In the second case of study, it has been considered that not in every country the heat produced is as valuable as in Sweden or even pay at all. Therefore in this second analysis the price of the heat is decreased by 12 % every step. Normally in the places where there is no demand heat, the price of the electricity is higher so it has increased by 6 % every step. The result is shown in the following graph.
-400 -300 -200 -100 0 100 200 300 100% 88% 76% 64% 52% 40% 28% 16% 4% €/ (2 0 ye ar s)
Heat price reduction %
Increment of 6% Elect and -12% Heat . Price each Step
CHP I CHP GS CHP Gcc
![Figure 2.1.1 Kg waste produce per capita [European Environment Agency, 2013]](https://thumb-eu.123doks.com/thumbv2/5dokorg/5492438.142999/11.892.181.688.111.472/figure-kg-waste-produce-capita-european-environment-agency.webp)
![Figure 2.1.3 million tons GHG emissions from municipal waste management in the EU [European Environment Agency, 2013]](https://thumb-eu.123doks.com/thumbv2/5dokorg/5492438.142999/12.892.165.683.397.732/figure-million-emissions-municipal-management-european-environment-agency.webp)
![Figure 2.2.1 Combustion process [Turns, 2011]](https://thumb-eu.123doks.com/thumbv2/5dokorg/5492438.142999/15.892.245.647.110.394/figure-combustion-process-turns.webp)
![Figure 2.2.2 Gasification process [Gasification technologies council, 2011]](https://thumb-eu.123doks.com/thumbv2/5dokorg/5492438.142999/16.892.308.584.119.585/figure-gasification-process-gasification-technologies-council.webp)
![Figure 2.4.2 Components of Simple Cycle Gas Turbine [Darwish, 2013]](https://thumb-eu.123doks.com/thumbv2/5dokorg/5492438.142999/19.892.193.703.185.442/figure-components-simple-cycle-gas-turbine-darwish.webp)
![Table 3.3.3.1 Efficiency data [Ryu et al., 2012]](https://thumb-eu.123doks.com/thumbv2/5dokorg/5492438.142999/29.892.144.749.222.356/table-efficiency-data-ryu-et-al.webp)