Association of sickle cell disease with nutritional status
among under-five children: a secondary analysis of Nigeria
demographic and health survey 2018 data.
AYEDA AHMED
Master’s Degree Project in Global Health, 30 credits. Spring 2020 International Maternal and Child Health (IMCH)
Department of Women’s and Children’s Health.
Supervised by:
Syed Moshfiqur Rahman Word Count: 10800
2 Acknowledgements
I would like to give special depth of gratitude to Allah for having kept me alive and healthy throughout my stay in Sweden and then my supervisor Dr. Syed Moshfiqur Rahman for his untiring support and inspiration physically, on phone calls, zoom meeting and emails. My sincere thanks to all the staff of IMCH for contributing in such responsive and pleasant atmosphere with special thanks to professor Mats Malqvist for his guidance throughout the two years. I am grateful to all my global health master’s colleagues of 2018 for making my study period at IMCH a nice one with many enjoyable memories. Special thanks to the DHS program for allowing me to use their high structural data. My special thanks go out to my lovely husband and our daughter for standing with me during this period. I am also grateful to my Bangladeshi family and friends for their decent and spiritual support that helped to fulfill my dream.
3 Abstract
Background
Malnutrition in childhood brings lots of difficulties that hinder to lead a healthy life. Nigeria is one of the most populous country in Africa has record of largest number of children suffered from chronic malnutrition under five years age. Sickle cell disease (SCD) is one of the most common haemoglobinopathy which occurs in Nigerian children. The aim of the present study is towards recognize the nutritional status of children sufferings from SCD and findings association with other socio-economic characteristics.
Method
A population based cross sectional survey was performed and total 11,243 children were selected for anthropometric measurement, hemoglobin test and genotype test. A two- stage stratified cluster sampling was applied in this study and using biomarker questionnaire support to collect data. Finally, multivariable logistic regression was used to discovery association between SCD children with stunting and wasting combined with other socio-economic characteristics.
Result
Children with sickle cell disease had significantly higher odds (aOR =1.47;95% confidence interval (CI) : 1.13-1.91) of stunting compared children with non-sickle cell disease .Conferring to gender, female children had significantly lower odds (aOR = 0.74,95% confidence interval (CI) : 0.68-0-81) of stunting compared with male children. Children from richest group had significantly lower odds (aOR=0.34;95% confidence interval (CI): 0.28-0.41) of stunting compared with the poorest group. There was no significant association observed between wasting and children with sickle cell disease.
Conclusion
The results indicate that SCD places a nutritional burden on affected under five children in Nigeria. Higher number of SCD affected children were suffering from stunting compare to healthy children. However, there was no significant difference on wasting between SCD and healthy children.
4 Table of Contents :
1.0. INTRODUCTION………8
1.1 Sickle cell disease in Nigeria: ... 9
1.2 Health care system in Nigeria: ... 9
1.3 Nutritional status among children under five years in Nigeria: ... 10
1.3.1 Strategies related to decrease burden of SCD: ... 12
1.4 Literature review study: ... 13
1.5 Description about Sickle cell Disease ... 14
1.5.1 Historical background of sickle cell disease: ... 14
1.5.2 Pathophysiology of sickle cell disease:... 14
1.5.3 Types of Sickle cell disease: ... 15
1.5.4 Clinical sign and symptom of sickle cell disease: ... 16
1.5.5 Diagnosis of sickle cell disease: ... 17
1.5.6 Treatment option of sickle cell disease: ... 18
1.6 Problem statement:... 18
1.7 Research question: ... 19
1.8 Objectives: ... 19
1.9 Justification: ... 19
2.0 Conceptual framework: ... 19
2.1.1 Mechanism of poor nutritional status in children with sickle cell disease: ... 19
2.1.2 Causal pathway of anemia: ... 19
2.1.3 Potential confounders: ... 20
2.0. MATERIALS AND METHODS ... 22
2.1 Study design………..22 2.2. Study setting: ... 22 2.3. Study population : ... 24 2.4 Sampling ... 24 2.4.1 Sampling Design ... 24 2.4.2 Sample size ... 24
2.5 Data collection tools and techniques: ... 25
2.5.1 Questionnaire ... 25
2.5.2 Techniques: ... 26
5
2.6.1 Dependent variables (Anthropometric measurement) ... 26
2.6.2 Exposure and Independent Variables ... 28
2.6.2 Independent variables ... 28
2.7 Statistical method ... 29
2.7.1 Data cleaning and variable management ... 30
2.7.2 Descriptive statistics ... 30 2.7.3 Inferential statistics ... 30 2.8. Ethical consideration:... 31 3.0. RESULTS ... 32 3.1 Participant flow: ... 32 3.2 Descriptive Analysis: ... 34
3.2.1. Demographic characteristics of the study population ... 34
3.2.2. Nutritional status indicators: ... 36
3.3 Inferential statistics ... 36
3.3.1 Factors associated with nutritional status of children: ... 36
3.3.1.1 Stunting: ... 36 3.3.1.2 Wasting: ... 38 3.3.2 Regression Analysis: ... 39 3.3.2.1 Stunting: ... 39 3.3.2.2 Wasting: ... 41 4.0 DISCUSSION ... 43
4.1 Relevance comparative study with other countries: ... 43
4.2 Implications of the findings: ... 45
4.3 Strengths and weaknesses of the study: ... 46
4.4 Internal validity: ... 46
4.5 External validity: ... 46
5.0 CONCLUSION: ... 47
6 List of tables and figures:
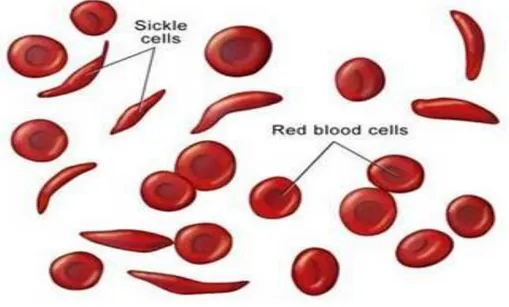
Figure 1: Shows a normal red blood cells and an abnormal red blood cells in Sickle cell disease.
... 15
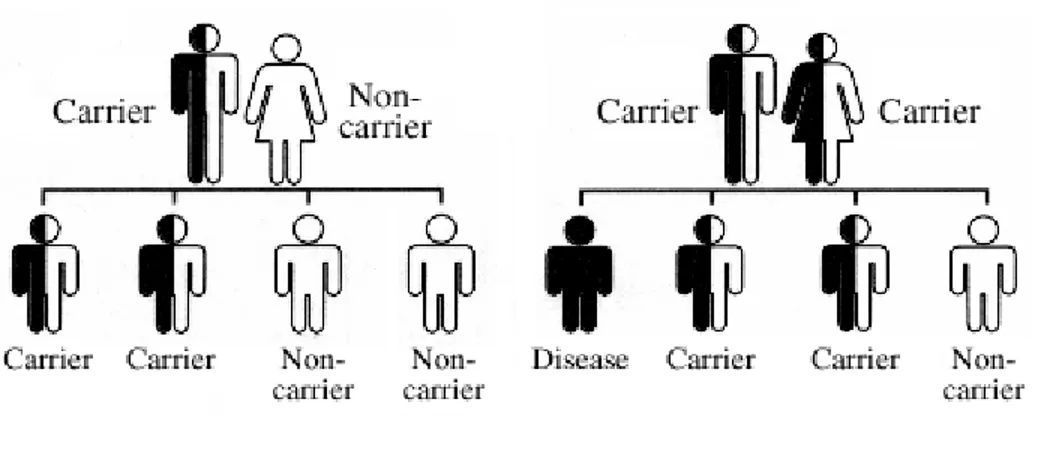
Figure 2: Shows percentage of children affected sickle cell disease and trait from their parents.. ... 16
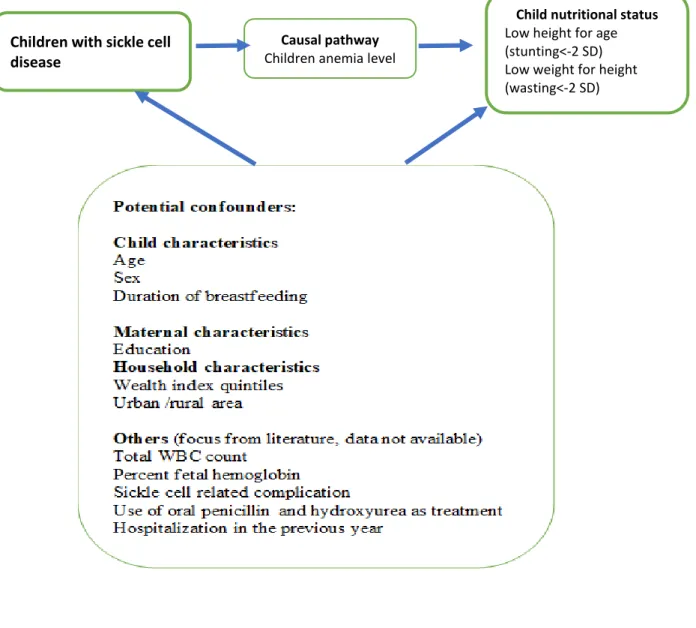
Figure 3 : Conceptual framework.. ... 22
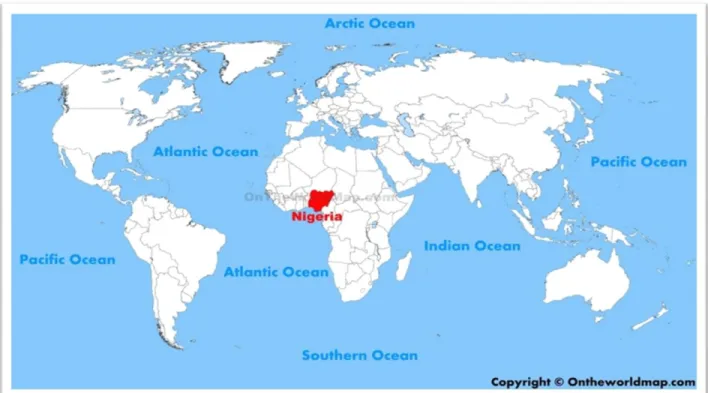
Figure 4: Geographical location of Nigeria according to world map ... 23
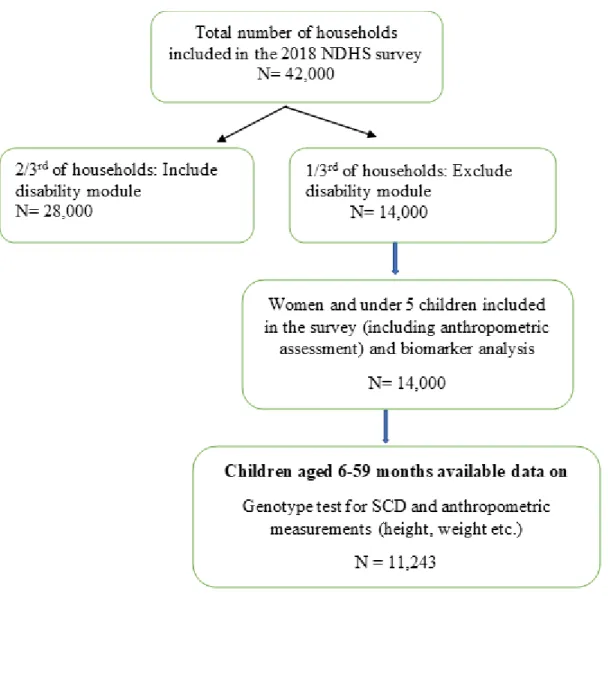
Figure 5: Participant flow chart displaying... 33
Figure 6: Cluster Bar graph indicating the relationship between mother’s educational status with stunting. ... 38
Table 1: Demographic Characteristics of study children ... 34
Table 2: Bivariate analysis. ... 36
Table 3: Crude and multivariable adjusted logistics model for the association between sickle cell disease and stunting... 39
Table 4: Crude and multivariable adjusted logistics model for the association between sickle cell disease and wasting. ... 41
7 Abbreviations:
SCD Sickle Cell Disease SCT Sickle Cell Trait aOR Adjusted Odd Ratio cOR Crude Odd Ratio CI Confidence Interval
HIV Human Immunodeficiency Virus SD Standard Deviation
Hb Hemoglobin HBS Hemoglobin S
HBSS Sickle cell disease genotype HBAS Sickle cell trait genotype LGAs Local Government Areas
NDHS Nigeria Demographic and Health Survey WHO World Health Organization
UNICEF United Nations Children’s Fund NPC National Population Commission
USAID United States Agency for International Development SPSS Statistical Package for Social Science
8 1.0 INTRODUCTION
Malnutrition, especially undernutrition is one of the major global health concerns among low- and middle-income countries [1]. Child undernutrition are extremely predominant among global health problems [1]. Approximately half of the children deaths occurred globally due to undernutrition. Undernutrition enhances risk of dying among children due to some common infection. Infection also occurred repeatedly and more severe pattern in undernourished children [2]. There is delayed recovery occurred in undernourished children from any kind of infection. The relation between undernutrition and infection could lead to worsening of nutritional status of children such as stunting, wasting, and underweight [2]. According to the UNICEF sources in March 2019 edition reveals that, around number of under 5 children whose have being globally stunted about 149 million, wasted children about 49 million and overweight children about 40 million. From UNICEF resources, it has discovered that, proportion of stunted children under 5 years age has dropped globally from 198 million to 149 million between 2000 and 2018 however the problem has remained upsurge in West and Central Africa [2].
Anemia is one of the persistent global health problem and significant cause of childhood mortality [3]. According to World Health Organization (WHO), approximately 1.6 billion people are suffering from anemia. Among of them the more noteworthy number has a place from Africa and South Asia [3]. The causes of anemia are interconnected by different factors such as, micronutrient defects (e.g. iron, vit A, folate, vitB-12), infections (e.g. schistosomiasis, intestinal parasites, human immunodeficiency virus[HIV],malaria) and congenital blood cell disorders(Sickle cell disease[SCD] and alpha-thalassemia ). Globally 50% anemia occurred due to lack of iron absorption. But in Sub Saharan Africa inherited blood cell disorders or Sickle cell anemia or Sickle cell disease are most prevalent along with other risk factor of anemia [3].
“Sickle cell disease (SCD) is a chronic hemolytic disorder caused by homozygous inheritance of abnormal hemoglobin called Hemoglobin S (HBS).” Structurally there is difference in normal hemoglobin chain where replacement of glutamic acid by valine in the sixth position of the b. globin [4].In Sickle cell disease(SCD) less number of red blood cells is produced which result in insufficient oxygen carrying to entire body. Normally red blood cells are round and flexible but in Sickle cell disease (SCD) red blood cells are become rigid and sticky which giving appearance of sickles or crescent moon shape. These irregular shaped cells are become stuck in small blood vessels of different organ of the body and produce multiorgan dysfunction complications. In
9 Sickle cell disease (SCD) blood hemoglobin level is decreased as low as 6.0 g/dl [4]. Most common varieties of SCD are SS, SC and S beta -thalassemia. On the other hand, Sickle cell trait (SCT) are also included beneath Sickle cell disease which define as , there is mixed up of one gene from sickle hemoglobin(Hb) and one gene from ordinary hemoglobin (Hb) [5]. Sickle cell disease (SCD) commonly affect the growth of the children leading to wasting and stunting. There are some co -morbidities are associated with SCD which leads to poor dietary intake [6].As a result, nutritional status of the body cannot be appropriately kept up and appropriate skeletal development is deferred due to poor dietary intake[6].
1.1 Sickle cell disease in Nigeria
Sickle cell disease (SCD) is one of the complicated diseases and associated with severe morbidity and high mortality in children in Nigeria. It is one of the commonest global health problems in Nigeria. According to Nigeria Demographic and Health Survey (2018), over 3.4 million Nigerian children are currently suffered with SCD. There is some other assumption are estimated from NDHS (2018) that, when the prevalence of SCT cross over 20% then SCD have a chance to occur to as high as 2%. Another estimation from NDHS 2018 is that approximately 24% of Nigerian children have suffered from SCT now a days [1]. Sickle cell disease (SCD) is predominant in various parts of the Sub Saharan Africa but highly prevalence in South West (2%) and lowest in the South South (0.3%) [7-10]. In Africa, SCD can contribute childhood mortality up to 90%. Sickle cell disease (SCD) can affected over 200,000 children each year in Africa. In Nigeria approximately 130,000 children are born with SCD per year. Sickle cell disease (SCD) also occur some other country such as South America, Saudi Arabia, India and Mediterranean but enormously affected in sub Saharan Africa. Sickle cell disease (SCD) also shared in black race in United States [7-10].
1.2 Health care system in Nigeria
Load of Sickle cell disease (SCD) remains high in Nigeria nearby 4 million people. In Sub Saharan Africa, 5-16% mortality of children occurs under 5 years age due to Sickle cell disease and before reach their fifth birthday 50% of SCD affected children will die due to lack of active intervention. Nigerian health care system does not meet up the optimal care requirement for Sickle cell disease where mortality rate has declined less than 1% in developed countries [11]. In Nigeria, there is
10 delayed diagnosis of Sickle cell disease is one of the major problems of mortality in children. Recent evidence suggests that, median age at diagnosis of Sickle cell disease is 28 months in Nigeria. There is still lack of health services at primary health care center in Nigeria related to early diagnosis and management of SCD. To reduce mortality rate in Nigeria due to Sickle cell disease, there should be involve of multifocal and multidisciplinary optimal Sickle cell disease care. Enthusiastic participation of the patients ,children’s parents, caregivers and others community health workers plays an important role for early diagnosis and management of Sickle cell disease[11] .In compare with high and middle income countries, Nigeria have some limitation in comprehensive care practices which include transcranial Doppler ultrasonography for stroke prevention ,genetic engineering, Sickle cell disease- targeted immunization, hydroxyurea therapy, newborn screening, penicillin prophylaxis ,chronic transfusion programs and bone marrow transplantation .In order to decrease mortality rate from sickle cell disease ,primary health care center level must have good knowledge about the disease, mostly maintenance of nutritional status of children, early case detection ,crisis prevention, hydration maintenance and referral where needed. Previously some studies have performed in the four local government areas (LGAs) in Nigeria to see the knowledge of primary health workers and to see the available arrangement for diagnosis and management of Sickle cell disease [11].
1.3 Nutritional status among children under five years in Nigeria
As stated by population, Nigeria is one of the most densely inhabited country in Africa with inhabitant of nearly 186 million people. Annual population growing rate in Nigeria is inflated approximately 2.6 rate which makes Nigeria overcrowded now a days. Here exists assumption from Population Reference Bureau in 2013 that by 2050, Nigeria’s population will be spread nearby 440 million which will make Nigeria in third position according to population density after India and China. The growing rates of urban area in Nigeria remains elevated approximately 4.1 % due to presence of less amount of capitals and land in rural areas. Regarding aiming the achievement of Sustainable Development Goals (SDGs), Nigeria is currently grading 145th out of 157th countries. According to NDHS 2013 presented that, 1 in every 15 children will die before reaching their 1st birthday and 1 in every 8 children will die before reaching their fifth birthday. The prevalence of undernutrition (stunting and wasting) is continued high burden of Nigeria. Nearby 37% and 7% of children under five years age in Nigeria are stunted and wasted [12].
11 There are many aspects related to stunting and wasting in children. Reflecting from NDHS 2018 report, SCD and sickle cell trait are the most important public health concern for developing stunting and wasting under five years children. Around 20% children have SCT and 1% have SCD and nearby 68% children suffering from anemia. As stated by age, the prevalence of stunting reaching peak value approximately 47% between 24-35-month age group but the prevalence of stunting remains less percentage (16%) between 0-6 months age group. However, wasting reaching peak value between 3-11 months.(2018).Along with place of residence ,children in rural areas are more stunted and wasted compared with the urban areas (45% stunted and 8% wasted in rural area) and (27% stunted and 5 % in urban area).According to different zone of Nigeria , North west zone has highest number of stunted children (57%) and south east has lowest number .Among the different sate of Nigeria ,Kebbi has the highest number of stunted children (66%) however Enugu has the lowest number of stunted children (1.4%).In addition, wasting is more prevalence in the North East (10%) and North west (9%) compared in the other zone [1].Children’s birth size is one of the issue connected with nutritional status of children .Children who born small or very small at birth has increased risk of develop stunting and wasting .For example, children who born very small at birth has three times more risk of developed wasting(17%) compared with average or larger birth size children(6%).Children’s mother body mass index (BMI) has relation with developed stunting and wasting in children .Children whose mother BMI< 18.5 has more risk of developed wasting in children. According to NDGH 2018, thin mother has incidence of stunted children around 49% while overweight mother has incidence of stunted children approximately23% [12].
As stated by World Bank (2017), Nigeria is one of the countries among Africa which has largest economy and contribute an upright position in global economy. Nigeria has improved a lot in economic sector last few decades, although poverty has persisted one of the major problems in Nigeria. The explanations state behind poverty is regional disproportions and growing inequality. Consistent with report, it is perceived that, Nigerian people live below the poverty line about 69%. Nigerian people financial source of income gained from oil and gas reserve. The country’s finance handled in great threat in 2014 when oil prices suddenly declined from the regular value. Secondly, Nigerian people consistently depended on agriculture persuaded by private sector approximately 40 percent of Nigerian’s total Gross Domestic Product (GDP) [12].
12 The reasons of malnutrition in children is connected to several features. One of the significant reason behind undernutrition is lack of appropriate practices of infant and young child feeding which consequences of high percentage of illness and established of stunting and wasting under 5 years age children .Furthermore, there is absent of sufficient health care practices , absent of proper hygiene and sanitation practices , absent of good water supply altogether are associated with poor nutritional status in children in Nigeria .Poverty and unemployment rate is continue high in Nigeria(north region ) because of irregular rainfall . Non -communicable diseases are also more predominant in Nigeria due to socio-cultural factors, urbanization, life-style changeover, poor maternal, fetal, and infant nutrition (Nigeria Federal Ministry of Health, Family Health Department 2014) [12].
Nigeria has established some targets between 2014 and 2018 depended on the National policy focus on food and nutrition and along with National Strategic plan of Action for Nutrition was reduced stunting by 20% and wasting by 10% under 5 years age .In April 2016, Nigeria announced ‘Zero hunger’ method which purpose of eliminating undernutrition by 2025-2030 target time period of UN’S SDGs. From January 2018, U.S Government has engaged Nigeria one of these target country which contribute 12 feed future target country .Maternal and Child Survival Program(MCSP) was introduced in Nigeria from 2014-2019 which foremost goal to improve maternal and children nutritional status. The program explains nutrition and WASH measures for pregnant mother and parents of under 5 children during pregnancy period visit, vaccination visit and through SMS messaging [12]. Towards begin a National Strategic Plan of Action for Nutrition, there prerequisite to be mutual relation between stakeholders and government funding procedures together and improvement in community-based treatment choice in Nigeria with the intention of reduce children undernutrition (wasting and stunting)[1].
1.3.1 Strategies related to decrease burden of SCD
The prevalence of sickle cell trait and SCD remain high in African region around ranges between 10-45% whereas in Nigeria SCT contribute approximately 20-30% and SCD affect 2-3 % of the Nigerian population [13].
1) Newborn /Neonatal screening and Comprehensive Care:
Early diagnosis of SCD decrease the risk of child morbidity and mortality. Timely provide proper preventive measure for SCD including penicillin treatment, vaccination against bacteria,
13 management of fever, family education, identify splenic sequestration assistances to improve children nutritional status with SCD. Newborn screening require resources : equipment and reagents, mobile units, research/ clinical trial infrastructure ,Laboratories and clinic .All the resources are funded by Government health institutions, private sector ,charitable clinics, NGOs and north-south and south-south partnerships with foreign universities and hospitals. These all procedure are accomplished in every state of united states but infrastructure necessary for these procedures are not available in every state in Nigeria [14].
2) Comprehensive Health Care Management:
Resources require for these management procedures are health care infrastructure, health care personnel, educational resources, clinical and laboratory services. All these resources are funded by Governments-Ministry of Health, Local media, and web-based education, Tertiary and Regional Hospital Schools [14].
1.4 Literature review study
Sickle cell disease in children boasts many adverse consequences on growth due to increased energy requirement [15]. A cross-sectional study was conducted at the Pediatrics Sickle Cell Clinic of the Korle BU Teaching Hospital in Ghana and it has shown that underweight and stunting were extremely significant among Sickle cell disease children than wasting [15]. Sickle cell disease one of the most common hematological disorder in Brazil also. Sickle cell disease Brazilian children faced with diminished growth and hindered development in their life. As a consequent, some researcher has been advocated to observing their nutritional state by applying modified growth chart. Most frequent developmental delays are sexual development, bone maturation and epiphysis fusion during puberty. Due to decline appetite and lower dietary intake in Sickle cell disease children leads to develop different micronutrient deficiency [16]. Chronic blood transfusion and hydroxyurea (HU) therapies are beneficial in reduction in morbidity and mortality and improve nutritional status in children with Sickle cell disease in Brazil. Many Brazilian children improves their nutritional status with this drug but in compare with Nigerian children these drug therapies are not available in every health sector in Nigeria [16].
Comparative study of socio-economic class and nutritional status of children along with sickle cell disease and without sickle cell disease were performed in Lagos state of Nigeria. The mean height and BMI of SCD children and standard children are mostly similar where weight for height are
14 heavily higher in regular child than SCD children [17]. The mean height is similar in both groups up to 8 years age then fall of height of SCD children. Mean height of SCD female child and standard child is similar in both groups. The mean age-related weight of male and female SCD children are lower than the regular child. On the other hand, the mean weight of regular child is comparatively lower according to NCHS standards [17]. The weight of the SCD children were significantly lower than the standard child group in all social classes. The height of the SCD children were significantly lower than the regular child group in all social classes except class 3.In weight for height, regular children have higher value than SCD children in upper social classes 1 and 2. But in the lower social classes (3,4) regular children had still higher mean values which did not reach statistically significant [17].
1.5 Description about Sickle cell Disease
1.5.1 Historical background of sickle cell disease
Sickle cell disease (SCD) is one form of hematological disorder generally widespread in Nigeria. First time SCD was detected in the blood of an anemic West Indian medical student in 1904 by Dr. JB Henrick .No one can confirmed about that when or how or where sickle cell gene mutation ascends but there is many discussion decided that SCD introduced in the Middle East amongst the Veddoids in the Arabian peninsula .Greatest number of the sickle cell gene then spread into Africa ,Southern Europe and India. Lehman and Nwokolo in 1959 reported that ,SCT occurrence of 24.3% in Nigeria and the two most common hemoglobin variant discovered in Nigeria are hemoglobin S (HbS) and hemoglobin C ( HbC).Hemoglobin S (HbS) is observed largely of the region of Nigeria but HbC is usually discovered in western Nigeria. From previous history, it has shown that in 1902 about 30,000 infants are born each year with SCD. Kaine et al found that, in Eastern Nigeria among pre-school children there is prevalence of 22.5% AS ,1.6% SS and 0.1% AC variants [18].
1.5.2 Pathophysiology of sickle cell disease
Red blood cells (RBC) are essential for body mechanism because they carry oxygen to whole body. Normal life span of red blood cells is 120 days but in SCD sickle cell usually dies in 10 to
15 20 days. In Sickle cell disease there is scarcity of red blood cells discovered. One of the vital components of red blood cells is iron rich compound which form hemoglobin. As a result, there is breakdown of hemoglobin occur in SCD which cause anemia which result from lack of iron deposition. In Sickle cell disease red blood cells become rigid and sticky due to abnormal structure of hemoglobin [19].
Figure 1: Shows a normal red blood cells and an abnormal red blood cells in Sickle cell disease (20).
Sickle cell disease (SCD) is one kind of hemoglobinopathy in which there is replacement of amino acid in the beta chain of adult hemoglobin. Heterozygous inheritance of an abnormal Hb combine with ordinary Hb causes symptomless clinical state called ‘Sickle Cell Trait’. On the other hand, inheritance of Hemoglobin S (HbS) combine with other irregular Hb like beta-thalassemia, HemoglibinC, HemoglobinS causes symptom and called SCD. Another name of these homozygous inheritance HbSS also called Sickle cell anemia.[18].
1.5.3 Types of Sickle cell disease
In Sickle cell disease, the bigger number of hemoglobin disorder type is HbSS. In African region 70% of sickle cell disease cases contain HbSS variety. HbSS occurs when two beta globin S alleles comes from both parents congenitally. HbSS is the most severe pattern among the other variety of sickle cell disease and the children suffering from HbSS may experience severe complication in life and develop short life expectancy later.
16 Hemoglobin SC is the second common variant in sickle cell disease and 30% people in African region affected HbSC .Hemoglobin SC is designed from one inheritance HbS gene from one parent and HbC gene from another parent .Severity of HbSC is equivalent with HbSS but here anemia is less in compare with HbSS . Here (figure 4) displays that, if together parents are carrier then there is nearby 25% chance of one baby detected with sickle cell disease and 25% chance of one baby identified without sickle cell disease and sickle cell trait. On the reverse, if one parent is healthy and one parent is carrier then there is 50% chance of detected baby come about sickle cell trait and 50% are healthy without sickle cell disease and sickle cell trait.
Thalassemia is other type of hemoglobinopathy disorder which occur due to imbalance between alpha and beta synthesis and anemia. Some other genotype is hemoglobin SE, hemoglobin SO, hemoglobin SD and hemoglobin SG and others. [21]
Figure 2: Shows percentage of children affected sickle cell disease and trait from their parents (21).
Source: Sickle Cell Disease Foundation
1.5.4 Clinical sign and symptom of sickle cell disease
Vaso-occlusive events: The truly painful incidents and vascular organ complications take place in vaso -occlusive events. These are stroke, acute chest syndrome, dactylitis and priapism.
17 • Dactylitis is the prior presentation of pain in SCD children.
• Acute Chest Syndrome is one of the crucial life threating condition in children and adults with SCD. In Nigeria and other low-income countries acute chest syndrome is the cause of high mortality.
• Splenic sequestration is one of the critical hurdles when blood pool rapidly through the spleen. Patients present with sign of reduce level of hemoglobin correlated with large spleen or liver (more than 2 cm increased from the usual level) and increase level of reticulocyte count from the average range. Splenic sequestration usually linked with other infection or malaria.
• Stroke- neurological problem are common in SCD children. Children may possibly suffer from overt strokes and silent cerebral infarcts which marks high morbidity and mortality. Approximately children before 14 years age with SCD might chance of stroke and without proper treatment it will recurring within 2 years of the initial stroke [21].
1.5.5 Diagnosis of sickle cell disease
1) Hemoglobin electrophoresis is the common test to diagnose SCD.
2) Complete blood count, differential count, reticulocyte count, peripheral blood smear, serum electrolyte, pulmonary function test, serum creatinine, transcranial ultrasound- these tests are done according to complications of SCD.
3) Prenatal diagnosis of SCD can be done with various method. For example,
Amniocentesis-It is one of the screening tests done between 15th to 20th week of gestation period. During the test, a small thin needle inserted into abdominal wall through ultrasound guided procedure and reach the amniotic sac around fetus and collect small amount of amniotic fluid for this test.
Chorionic villus sampling- Collect small sample of cells from placenta, which link mother to baby in womb and use for test for diagnosis of early SCD in children. And another test is fetal blood sampling.
When HBSS is diagnosed in prenatal baby then mother can be decided to terminate baby or if continue then take challenges for management of SCD in children.
18 1.5.6 Treatment option of sickle cell disease
1) Bone marrow transplant-permanent treatment for SCD. 2) Medications
• Antibiotics- given in children for life threatening infections by encapsulated organisms • Analgesics-used for relieving pain
• Hydroxyurea-decrease the frequency of blood transfusion
• Nitric oxide-used in increased wideness of blood vessels and decreased in tightness of red blood cells.
• Statins-used to increased blood circulation through the tissue in SCD [21]. 1.6 Problem statement
Undernutrition one of the major public health problem in children in Nigeria when it occurs due to Sickle cell disease (SCD) .Sickle cell disease in children lead to stunting and wasting complies of higher resting energy expenses, recurrent infections, endocrine dysfunctions, micronutrient shortage and chronic anemia [22]. With increasing age with SCD children indicates to build more complications due to a reduced amount of energy intake. In addition, male children are more susceptible to experience in SCD because they perform extra outdoor physical activity compare to girls leads to more energy expenses occurred in male children. Furthermore, male children have elevated background inflammation and erythroid hyperactivity which further reasons for higher rate of undernutrition in male children with SCD [22]. Many studies suggest that, progress of standard of living and quality of care has a valuable effect in nutritional status of children with SCD. Poor socio-economic status has a deleterious consequence of nutritional status of children with SCD in Nigeria. So, there should be improvement basic health services, other amenities among rural area in Nigeria. Genotype test has played a vital part in SCD with nutritional status of children in Nigeria [22]. In Spite Of high importance of this test , there is no routine genotype testing was performed in Nigerian children .It is therefore ,to obtain the best results for enhancement of nutritional status in children with SCD in Nigeria, several studies and various procedures ought to be done in future[17].
19 1.7 Research question
What is the relationship between the sickle cell disease and nutritional status of the children under 5 years age in Nigeria?
1.8 Objectives
1) To evaluate the nutritional status of children (under 5 years age) along with sickle cell disease in Nigeria.
2) To identify other socio-economic factors associated with nutritional status of children along with Sickle cell disease (SCD) in Nigeria.
1.9 Justification
Examining the nutritional status of children with SCD in Nigeria make easier to distinguish the factors responsible for stunting and wasting. This research aims to fill up the knowledge gap about exposure which are strongly linked with outcome and how other socio-economic characteristics relate to nutritional status of children under 5 years age along with sickle cell disease in Nigeria.
2.0 Conceptual framework
2.1.1 Mechanism of poor nutritional status in children with sickle cell disease
Poor growth and undernutrition are common measures occur in children with SCD. Sickle cell disease is one of the congenital blood disorders occur in children in Nigeria. Reduced dietary intake is one of the common phenomenon arise in children with SCD which consequences in development of poor nutritional status in children[23] .Children with SCD suffer from both micronutrient and macronutrient deficiencies[23] .Poor neurocognitive function is one of the adverse effect of children with SCD which leads to develop poor academic performance in later life[24].
2.1.2 Causal pathway of anemia
According to 2018 Nigeria Demographic and Health Survey data, specified that, 10% of children had severe anemia diagnosed with sickle cell anemia under 5years age children. In Kinshasa study
20 reported that,5% children with severe anemia had remain undiagnosed sickle cell anemia (SCA)[25].Constant connection with macronutrient and micronutrient deficiencies, different types of emerging toxin from environment and infection are upsurges risk of anemia in children with SCD[26].
Anemia in children occur in different reasons. Most common anemia occur in children in Nigeria owing to nutritional deficiency and infectious diseases (helminthiasis and malaria). When these type of diseases and nutritional deficiency along with anemia co-existence with SCD leads to increase risk of childhood morbidity and mortality [26].
2.1.3 Potential confounders
Manifestation of SCD start in early childhood associated with poor nutritional status in later lifecycle. The prevalence of stunting and wasting are fluctuate in different age group .Stunting is a sign of chronic malnutrition and the prevalence of stunting is more in older children while wasting is more prevalence in younger group children because wasting is a sign of acute malnutrition. In SCD, height become low in children have been associated with lower concentration of circulating hemoglobin, delayed epiphyseal fusion of long bones and late puberty. Male children have higher risk of stunting and wasting as they perform more outdoor physical activity. Socio-economic status is one of the significant factors affect the improvement of nutritional status of children with SCD. Access to frequent health care and follow up visits are often difficult to accomplished in low income family consequently develop poor nutritional status in children [27].
Growth failure in children with SCD interrelated with other endocrine dysfunction, specific nutrition deficiencies and metabolic disorders. Total white cell count (WBC) and fetal hemoglobin (HbF) are most prominent in SCD. Fetal (HbF) hemoglobin has great advantage in SCD as it hinders the polymerization of HbS. As a result, SCD children with fetal hemoglobin has less severe complication and leads to longer life. However, higher number of total white cell count (WBC) has adverse effect in children with SCD. Its increased inflammation and acts as a causative factor for development of stroke, acute chest syndrome and early mortality in SCD [28]. Hydroxyurea is one of the therapeutic treatment options used in SCD children which maintain all the hematological parameter and decreases the risk of child mortality and morbidity. All these confounding factors applicable to nutritional status of children with SCD [29].
21
Figure 3 : Below represents a diagrammatic representation Conceptual framework.
.
Children with sickle cell
disease
Child nutritional status Low height for age (stunting<-2 SD) Low weight for height (wasting<-2 SD) Causal pathway
22 2.0. MATERIALS AND METHODS
2.1 Study design
This was a cross-sectional study conducted by a secondary analysis of Nigeria Demographic and Health Survey (2018 NDHS) data. The NDHS survey was conducted in different state of Nigeria from August to December 2018.
Sources of Data: All data in this study extracted from Nigeria Demographic and Health Survey (2018 NDHS) data. In Conjunction With the help of the National Population Commission (NPC) in association with the National Malaria Elimination Program (NMEP) of the Federal Ministry of Health, Nigeria the 2018 Nigeria Demographic and Health Survey (2018 NDHS) was executed. United States Agency for International Development (USAID), World Health Organization (WHO), the United Nations Population Fund (UNFPA), Bill and Melinda Gates Foundation (BMGF), Global Fund were jointly provided fund for the 2018 NDHS. Technical support and assistance were provided for NDHS,2018 through ICF, a USAID project which mainly support in the execution population and health surveys in countries globally (1).
2.2 Study setting
Officially, another name of Nigeria is known as the Federal Republic of Nigeria, is a most populous country which is situated on the western coast of Africa. According to the United Nation data, the population of Nigeria is 186 million people in 2016(UNICEF 2017).Roughly 923,768 square kilometers are the total surface area of Nigeria[30,31] .Corresponding to density of every individual person in Nigeria per square kilometers is around 212.04 in measure of nearby 200 million population. These zones are North Central, North East, North West, South East, South South and South West. A huge quantity of population is inhabiting in the south and southwestern areas. Nigeria holds 5 cities in total and Lagos is undoubtedly the largest one with the population of around 17.5 million. The second municipalities are Kano, third Ibadan, fourth Benin City and fifth Port Harcourt graded corresponding to population. Nigeria has total 36 state,774 Local Government Areas and its capital zone is known as Abuja. Nigeria first declared its liberation on Oct 1,1960 from United Kingdom and it has over five hundred racial groups and different languages [30,31].
23
Figure 4: Geographical location of Nigeria according to world map (32).
In contrast with other countries of Western Africa, Nigeria holds the lowest life expectancy rate around 54.5 years agreeing to WHO data. Nigeria retains high child and maternal mortality rate. As a result of numerous health hazards, there is extreme danger of one out of every five children will die before reach their fifth birthday. Nigerian pregnant women be affected by upsurge risk of dying during childbirth is 1 in 13 because they were unaware to get professional medical treatment. Nigerian children have devoted study period in school is total 9 years and national literacy rate is 59.6%. Nigerian citizen exists largely in young group roughly 18.4 years age. Male and female have been residing in Nigeria approximately parallel in number, about 1.04 in male in compare with 1 in female. Over half of the population in Nigeria dwelling in rural areas around 52%. Birth rate in Nigeria is around 37.01, death rate approximately 11.42, growth rate 2.24% and fertility rate 5.25. Gross domestic product (GDP) per capita is $2.406.73 in Nigeria. English is the official language of Nigeria, but they have unique multiple local language. Concerning the religious aim Nigerian people belongs two religion Christian and Islam. Nigerian health care system suffered many downfalls. Nigerian health care system operated by three tiers of Government. One is Local Government; another is state and final one is the federal. 774 local government areas controlled the primary health care system and the ministry of health at the state level conducted the secondary health care system [30, 31].
24 2.3 Study Population
The present study’s population were total 11,243 children who were eligible for height, weight, hemoglobin test and genotype testing for sickle cell disease had being calculated between 6-59 months children [1]. With the assistance of the trained nurses and laboratory technician and proper tools and equipment’s were used to gathered information about nutritional status of children.
2.4 Sampling
2.4.1 Sampling Design
The sampling framework used for NDHS,2018 was the Population and Housing Census of the Federal Republic of Nigeria (NPHC) which was done by National population commission 2006. A two -stage stratified, cluster sampling was applied in NDHS data. By splitting the each of the 36 state of Nigeria and Federal capital region into urban and rural area, stratification have been accomplished. About 74 sampling strata were labeled from which samples were carefully chosen separately via two stage selection method. Nigerian each state split up into local government areas (LGAs) and each LGAs was again partitioned into wards. Census enumeration areas (EAs) was defined as while every single locality was sub-divided according to convenient areas. Before sample assortment all localities were divided into urban and rural areas according to cut point of population size which entailed more than a minimum population size of 20,000 specified as urban. Among the two-stage selection, in the first stage 1,400 EAs were selected and in the second stage with equal probability systematic sampling method a static number of 30 households was selected. As a result, total 42,000 household was recognized [1].
2.4.2 Sample size
From NDHS 2018, approximately 42,000 households were nominated according to nature of household member, birth registration, housing integrity and usage of mosquito nets. In NDHS, they were not writing in specific how they calculated the sample size. Women age group (15-49), men age group (15-59) and children age group (0-59) were brought in the data. Two third of household comprised only female group and one third of household get hold of male, female, and children group. Through prepared of table, household member quantity was listing and through computer programming household member have being selected randomly. Interviews only
25 presented in the pre-selected households. To decline the chance of bias, no modifications and no alterations of the pre-selected households were permitted in the implementing stages. There have being variations in the proportion of sample in different state of Nigeria and avoid the probable discrepancies in the result, sample weights were the safest technique. But in the present study, we did not utilize weighted data as we do not demonstrate complex analysis with the weighted data [1].
2.5 Data collection tools and techniques
2.5.1 Questionnaire
There were four categories questionnaire used in NDHS, 2018 data: The Woman’s Questionnaire, the Man’s Questionnaire, the Household Questionnaire, and the Biomarker’s Questionnaire. The questionnaire was structured according to different health issue and reveal the population in Nigeria. The survey procedure was authorized and assessment by the National Health Research Ethics Committee of Nigeria (NHREC) and the ICF Institutional Review Board. All the questionnaire was published in the end in English, but these questionnaires were also translated into Hausa, Yoruba, and Igbo languages. Computer-assisted personal interviewing (CAPI) technique applied for NDHS, 2018 data collection. The household questionnaire included all the listed members and their basic demographic information. For example, age, sex, education, marital status, information about housing dwelling unit, survival history of under 18 children informed by their parents etc. [1].
Woman’s Questionnaire encompassed all the woman aged between 15-49 years old and covered topics resembling background characteristics, delivery procedure, breastfeeding history, marriage and sexual history, domestic violence, fistula, maternal mortality etc. The Man’s Questionnaire covered all the man aged between 15-59 years old selected household in the subsample men’s survey. It contained all the information identical to the woman’s survey but bit shorter than the woman’s survey as they were not providing detailed reproductive history.
The biomarker questionnaire was utilized to calculate the anthropometric measurement of woman and children below 5 years of age and diagnosis of other biomarker test result of woman and children between 6-59 months old age. All biomarker data were collected from the one third of households selected under the heading of male survey in NDHS 2018.Fieldworker questionnaire
26 was another sector used in NDHS where basic background information of the people were noted who involved in data collection .For example the biomarker team, field editor, team supervisor and interviewers[1].
2.5.2 Techniques
Height measurement: Children age below 1 year were measured in lying position/ (recumbent length) and children above 1 year were measured in standing position. It was measured with a Shorr Board measuring board.
Weight measurement: All children weight measurement was carried using SECA scales with a digital display (model number SECA 8780).
Hemoglobin testing: Blood sample was brought from children aged 6-59 months finger prick (heel prick for children age 6-11 months). Blood drop then placed in microcuvette and hemoglobin was measured by HemoCue analyser. When blood hemoglobin level measured below 8 g/dl in children was diagnosed, immediately advised parents of the children to take their child to clinic for observation.
Genotype testing for sickle cell disease
Sickle cell disease in children is most prevalent in Nigeria. Genotype testing one of the important testing for diagnosis of sickle cell disease in children in Nigeria. It was done by blood collection from children age 6-59 months. It was used with the same finger prick or heel prick blood used for Hb testing. Then a drop of blood was tested using the Sickle SCAN rapid diagnostic test kit. Results were come within 5 minutes. The results must be informed the children’s guardian /parents .If the blood test result came with positive genotype SCD in children ,immediately advised the parents to take their children to health facility clinic for early treatment of SCD and follow up care .The result also recorded in Biomarker questionnaire[1].
2.6 Variables
2.6.1 Dependent variables (Anthropometric measurement)
There were different indices used as anthropometric measurement indices. Such as Height for age, Weight for height, Weight for age, Body mass index (BMI) and Mid-upper arm circumference (MUAC).In this present studies, according to 2018 NDHS data and researched in different articles
27 two indices were greatly correlated with nutritional status of SCD children. These were height for age for stunting and weight for height for wasting as outcome or dependent variables. All these measurements were calculated in standard deviation units (Z -score) from the median of the reference population.
Stunting (Low height for age) and No stunting /Outcome
Stunting was defined as when children height for age Z score was less than minus two standards deviations (-2SD) from the median of the WHO standards population were termed as stunting or short height for their age [33]. Stunting was a sign of chronic undernutrition that suggests a children failure to receive adequate nutrition for a long period of time. The important cause of stunting was chronic disease or recurrent infection that caused less food intake and decreased absorption.
The measure height for age Z score was calculated according to new WHO child growth standards method. New WHO child growth standards method included motor development of children and evaluating the physical progress nutritional status under five years children. To obtain the accurate value in the analysis, this variable was divided by 100.Towards created no stunting and stunting group under five children, height for age Z score was again set up in visual binning method , cut point was < -2 for stunting group and < -2+ for no stunting group.
Wasting (Low weight for height) and No wasting /Outcome
Wasting was defined as children whose weight for height Z score was less than minus two standard deviations (-2SD) from the median of the standards population were termed as wasted children [33]. It was a sign of acute undernutrition. It entails that children had suffering from recent infection or recent illness. For this recent infection children failed to intake adequate nutrition which result in weight loss or wasted.
The measure weight for height Z score was calculated according to new WHO child growth standards method analogous to height for age. To achieve the accurate value in the analysis, this variable was also divided by 100. Towards created no wasting and wasting group under five children, height for age Z score was again set up in visual binning method, cut point was < -2 for wasting group and < -2+ for no wasting group.
28 2.6.2 Exposure and Independent Variables
Genotype variation result (Exposure)
There were five types of genotype identified in the Nigerian children under five years age for the purpose of diagnosis of SCD. These were genotype AA, AS, AC, SC, SS, and another group. Genotype AA contained regular genotype, AS contained sickle cell carrier group, SS contained SCD group which were very much common in number, AC and SC were also included in SCD group which were less common than genotype SS .In the present study ,genotype variation were again re-categorized into three groups. Among the three groups, first group encompassed genotype AA (reference group), second group included genotype AC and third group covered genotype SS, SC, AC, and another group.
2.6.2 Co-variates
The following independent variables were applied to reveal their association with stunting and wasting. There were significant number of independent variables identified from literature articles and the NDHS data which all were plotted in conceptual framework.
Age in months of children
Age in months existed in NDHS 2018 data from 6-59 months. To better analysis ages were categorized into three group (6-20): reference group, (21-40) and (41-59) months.
Sex of the children
Sex of the children have been categorized into male (reference group) and female group.
Children hemoglobin level
Hemoglobin level was measured by g/dl with 1 implied decimal.
Children anemia level
Children anemia level was categorized into four categories such as severe, moderate , mild and not anemic (reference group).Hemoglobin level below 7.0 g/dl were identified as severe anemia, between 7.1-9.9 g/dl were described as moderate anemia and between 10.0-10.9 g/dl judged as mild anemia.
29
Mother’s educational level
Mother’s educational status were categorized in to four categories such as no education (reference group), primary, secondary, and higher education.
Duration of breastfeeding
Categorized into three group. Ever breastfeed (reference group), never breastfeed and still breastfeeding.
Wealth index quintiles
The wealth index was a composite measure of household’s living standards. The wealth index was computed by utilizing household’s own assets. Assets which were included were television, car, dwelling characteristics, type of drinking water source, toilet facilities etc. In the present analysis, wealth index categorized into five groups poorest (reference group), poorer, middle, richer, and richest group.
Place of residence
Residence was categorized into urban (reference group) and rural area. According to UNSD recommendation residence was categorized depending on the population density. In addition, some other criteria also engaged in separate the residence. For example, number of populations involved in agriculture, the accessibility of electricity or piped water, available school, transportation, and health care facilities etc.
2.7 Statistical method
The present study analysis was conducted using IBM SPSS statistical (version 25) software. Bivariate association between continuous variable were assessed using Spearman’s rank correlation coefficient (rs). Mann Whitney U-test, Kruskal–Wallis nonparametric test, or χ2 test were used to test for difference between independent groups. We used logistic regression with estimated odds ratios (ORs) and 95% confidence intervals (CIs) to explore the association between SCD and nutritional status of the children. We adjusted the regression models for variables that were significantly associated with the exposure and outcome in the bivariate
30 analyses (P <0.05). Variables were statistically significant when p value<0.05 in both bivariate and multivariate analysis.
2.7.1 Data cleaning and variable management
NDHS’s household members (or Persons) recode file:PR file in SPSS. SAV format comprised all the required variable except breastfeeding variable. Breast feeding history variable were taken from birth recode file in SPSS. SAV format. Most of the variable history carried from under five children and mother’s educational history brought in addition. To improved analysis result variable were re-categorized when needed which were described in variable section above.
2.7.2 Descriptive statistics
Relative and absolute frequencies were introduced to reveal the total participant number and their characteristics. In the present study, both numerical and categorical variables were plotted in table, although final all the variables were categorical. Numerical variable were age ,height, weight, months of breastfeeding summaries like mean, standard deviation ,histogram ,bar graph ,pie chart and categorical variable included total percentage(%) also .All the variables normality test was performed by measured of mean, median ,skewness and kurtosis Z value, shapiro wilk test ,normal q-q and box plot.
2.7.3 Inferential statistics
All the categorical variable had selected for chi-square test and logistic regression bivariate analysis to find association with outcome. All the numerical variable had selected for Pearson’s Correlation test to show the significant association with each other .Initially, in chi square test , all the explanatory variable were cross tabs with dichotomous outcome variable (stunting and no stunting) and (wasting and no wasting) where variable found significant and positive relation when p value < 0.05 and other value df (degree of freedom) ,Cramer’s value, total percentage(%) and total number plotted. In Pearson’s Correlation showed any association between anthropometric measures and biochemical parameters when p value < 0.05.
Firstly, in simple logistic regression model each exposure was analyzed with both outcome variable separately and find association with crude odd ratio, 95%confidence interval (CI) and p value. Regression model followed Hosmer and Lame show test which suggested the best model
31 fit for the analysis when p value > 0.05.Then in multivariate analysis in logistic regression model all the exposure were adjusted and compared with outcome variable and measured by adjusted odd ratio,95% confidence interval (CI) and p value <0.05 to find significant association .Breastfeeding history and children anemia level were not included in logistic regression model because anemia itself involved in causal pathway and breast feeding history showed no significant association with outcome in chi -square test.
2.8. Ethical consideration
All the survey protocol reviewed and approved by the National Health Research Ethics Committee of Nigeria (NHREC) and the ICF Institutional review board. Prior to data collection, well-informed verbal consent was carried from all the participants and clarified them in detailed all the procedure about data collection .Every questionnaire(household and biomarker) form required about 20-30 minute to accomplish and ensured all the participant that all information kept confidential and not disclose to anyone outside of the survey team. As our study population were below 5 years old so informed consent of every child’s parents would take [1].
32 3.0 RESULTS
3.1 Participant flow
A total number of around 11,243 children were nominated for the present thesis analysis available from the NDHS, 2018 data. Nevertheless, for this present study 1/3rd of households was selected deprived of disability module. All biomarker information consists of height, weight, hemoglobin, and sickle cell disease testing for children age 6-59 months were analyzed.
33
Figure 5: Flow chart displaying household member allocation and a selection of household for biomarker information in children from 2018 NDHS (21).
34 3.2 Descriptive Analysis
3.2.1 Demographic characteristics of the study population
The demographic characteristics of the children along with their mother who were involved in this study analysis are shown in Table 1.A total number of 11,243 children were selected for height, weight, genotype test and hemoglobin test measurement with mean age of 32 months. The minimum age was 6 months and maximum age was 59 months. Children age group were divided into three categories with the youngest group fell between 6-20 month recorded 29.1%, middle group fell between 21-40 month documented 32.6% and oldest group range between 41-59 month verified 31.2%.The prevalence of male and female children almost equivalent documented 50.6% and 49.4%.According to the study ,among the four categories in anemia in children moderate group had the larger prevalence around 38.6% compared to other group. In the different genotype study, sickle cell disease (SS, SC, AC) verified 2.7% and sickle cell trait (AS) noted 19.6% and no SCD verified 77.7%.
Mother’s factor also included in this study for better analysis of the result. Mother’s educational status were categorized into four groups named and documented no education (38.5%), primary (16.7%), secondary (35.6%), higher (9.1%) shows in Table 1. Since, wealth index is documented as quintiles and divide into five categories. In each wealth index category nearly 20% study population were logged.
Table 1: Demographic Characteristics of study children with SCD and their mothers
CHARACTERISTICS N % Mean (SD)
Child age in month
6-20 month 21-40 month 41-59 month 3378 4201 4011 29.1 32.6 31.2 32.15(15.619) Sex Male Female 6508 6359 50.6 49.4 Children anemia level
Severe Moderate Mild Not anemic 356 4340 3012 3.2 38.6 26.8
35
3522 31.4
Genotype variation Result
No SCD (AA) Sickle cell trait (AS) SCD (SS, SC, AC) 8741 2201 301 77.7 19.6 2.7 Duration of breastfeeding children Ever breastfed Never breastfed Still breastfeeding 22781 1172 9971 67.2 3.5 29.4 Mothers anemia level
Severe Moderate Mild Not anemic 229 4309 4072 6234 1.5 29.0 27.4 42.0 Educational status of mother No education Primary Secondary Higher 4613 2005 4263 1094 38.5 16.7 35.6 9.1 Region Urban Rural 72703 115307 38.7 61.3 Wealth index quintiles
Poorest Poorer Middle Richer Richest 39607 38588 39784 37675 32356 21.1 20.5 21.2 20.0 17.2 Stunting Yes No 4512 8014 36.0 64.0 Wasting Yes No 823 11718 6.6 93.4
36 3.2.2 Nutritional status indicators
The prevalence of stunted and non-stunted children was approximately 36% and 64%, respectively. The small percentage of children were wasted around 6.6%. The prevalence of underweight and overweight children about 21.6% and 3.2%.
3.3 Inferential statistics
3.3.1 Factors associated with nutritional status of children
3.3.1.1 Stunting
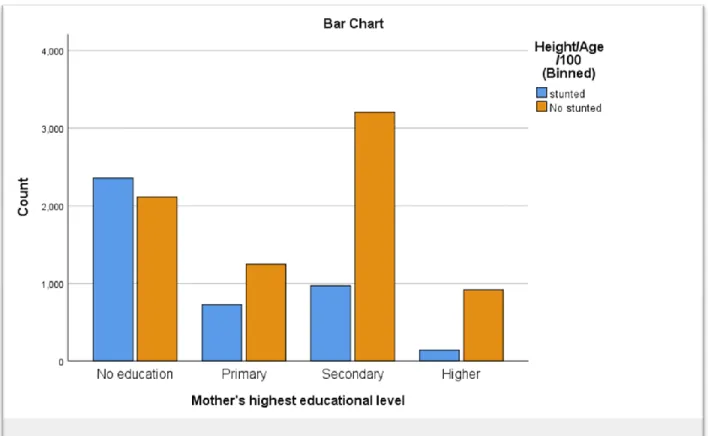
There was very strong evidence of a relationship found between stunting with genotype variation outcome, age of the children, sex, children anemia level, wealth index and mother’s educational status displays in the bivariate analysis with Chi-square (table 2). In the genotype variation outcome, stunting was found depended with genotype variable (chi-square =8.278, df=2, p value=0.016). Stunting was found dependent with sex (chi-square = 33.754, df =1, p value< 0.05) and according to odds ratio for sex(male/female) = 1.24 which means that male children were 1.2 times greater risk for stunting than female .Age of the children and children anemia level had significant association with stunting where both (p value = 0.000 )were found . In the five groups of wealth index, children existing in poorest, poorer and middle group had greater percentage of stunting 53.9%,46.3%,36.2% in compare with richer and richest group 24.8% and 16.2%.According to (Cramer’s value = .276) between wealth index combined and stunting means that there were moderate relation found between these two variable .Mother’s highest education level (chi-square = 1078.527 , df =3 , p value =0.000,cramer’s value =.304 ) had significant association with stunting and according to Cramer’s value mother’s educational status had strong relation with stunting. Duration of breastfeeding were not associated significant with stunting where (p value = 0.165) found.
Table 2: Bivariate analysis illustrating relationship between nutritional status and potential socio-economic characteristics of under 5 years age children available from 2018 NDHS data.
VARIABLE Stunting n (%) No Stunting n (%) P Value Wasting n (%) No Wasting n (%) P Value
37
Genotype variation outcome
No SCD (AA) Sickle cell trait (AS) SCD (SS, SC, AC) 3260(37.4) 861(39.2) 134(44.5) 5466(62.6) 1335(60.8) 167(55.5) 0.016 562(6.4) 153(7.0) 23(7.6) 8177(93.6) 2046(93.0) 278(92.4) 0.502 Age 6-20 21-40 41-59 1023(31.0) 1816(44.3) 1450(37.3) 2279(69.0) 2286(55.7) 2435(62.7) 0.000 410(12.4) 189(4.6) 142(3.6) 2892(87.6) 3918(95.4) 3753(96.4) 0.000 Sex Male Female 2438(38.5) 2074(33.5) 3897(61.5) 4117(66.5) 0.000 492(7.8) 331(5.3) 5851(92.2) 5867(94.7) 0.000 Anemia level Severe Moderate Mild Not anemic 219(61.7) 1969(45.4) 1024(34.1) 1049(29.9) 136(38.3) 2368(54.6) 1983(65.9) 2462(70.1) 0.000 48(13.5) 329(7.6) 205(6.8) 157(4.5) 308(86.5) 4011(92.4) 2805(93.2) 3362(95.5) 0.000 Duration of breastfeeding Ever breastfed Never breastfed Still breastfeeding 595(43.1) 39(41.9) 245(41.0) 786(56.9) 54(58.1) 353(59.0) 0.679 88(6.4) 7(7.5) 48(8.0) 1296(93.6) 86(92.5) 550(92.0) 0.392 Residence Urban Rural 2744(37.7) 1768(33.7) 4534(62.3) 3480(66.3) 0.000 492(6.8) 331(6.3) 6793(93.2) 4925(93.7) 0.310 Wealth index quintiles Poorest Poorer Middle Richer Richest 1343(53.9) 1166(46.3) 1011(36.2) 653(24.8) 339(16.2) 1150(46.1) 1355(53.7) 1783(63.8) 1976(75.2) 1750(83.8) 0.000 253(10.1) 185(7.3) 174(6.2) 129(4.9) 82(3.9) 2242(89.9) 2336(92.7) 2626(93.8) 2502(95.1) 2012(96.1) 0.000 Mother’s educational status Higher Secondary Primary No education 140(13.2) 970(23.2) 725(36.7) 2359(52.7) 917(86.8) 3207(76.8) 1248(63.3) 2115(47.3) 0.000 44(4.2) 206(4.9) 100(5.1) 424(9.5) 1014(95.8) 3971(95.1) 1875(94.9) 4052(90.5) 0.000
Pearson’s Chi-square test is significant at p value<0.05, Pearson’s Chi-square test is not significant at p value>0.05
38
Figure 6: Cluster Bar graph indicating the relationship between mother’s educational status with stunting in children under 5 years age available from the data 2018 NDHS.
3.3.1.2 Wasting
In the bivariate analysis with the chi-square (table 2), sex of the children, age of the children, children anemia level, wealth index and mother’s educational status had significant association with wasting where p value = <0.05.However, genotype variation outcome, currently breastfeeding children ,duration of breastfeeding factors were not associated with wasting and p value found > 0.05.
39 3.3.2 Regression Analysis
3.3.2.1 Stunting
Children with sickle cell disease had significantly higher odds (aOR =1.47;95% confidence interval (CI): 1.13-1.91) of stunting compared children with non-sickle cell disease and analysis showed 95% confident that the true odds ratio lies between 1.13 to 1.91.Added that ,children with SCD had 47% more risk of develop stunting compared with non-SCD children. However, children with sickle cell trait had higher odds (aOR=1.06; 95% confidence interval (CI): 0.95-1.17) of stunting compared children with non-sickle cell disease showed statistically non-significant value (p value >0.05).
For an additional months in age group,(21-40) months age group signified (aOR = 1.99 ,95% confidence interval(CI) : 1.79-2.22) and (41-59) months age group signified (aOR=1.40,95% confidence interval (CI) :1.25-1.56) advocated 99% and 40% of higher odds of being stunted compared with 6-20 months age group .In addition, analysis showed 95% confident that the true odds ratio lies between 1.79 to 2.22 for (21-40) months age group and 1.25 to1.56 for (41-59) months age group. Female children were less likely to be stunted than male children (aOR=0.74, 95% confidence interval (CI): 0.68-0.81).In addition, female children had 26% of lower odds of being stunted compared with male children and it showed 95% confident that the true odds ratio lies between 0.68 to 0.81.In compared with different categories of mother’s educational status, primary, secondary and higher group had respectively 39%,62% and 77% lower odds of stunting compared with no education group.
In wealth index quintiles, Richest group had 66% (aOR=0.34; 95% confidence interval (CI) : 0.28-0.41) inferior odds of stunting associated with reference group and it showed 95% confident that the true odds ratio lies between 0.28 to 0.41. .Richer ,middle and poorer group had approximately 52%,33% and 14% lower odds of stunting contrasted with poorest group .Children residing in rural area were less likely to be stunted than urban area(aOR=0.81;confidence interval(CI) :0.74-0.89).Added that, children in rural area had 19% lower odds of being stunted compared with the urban area and it found 95% confident that the true odds ratio lies between 0.74 to 0.89.
Table 4: Crude and multivariable adjusted logistics model for the association between sickle cell disease and stunting (Text inscribed in bold specify that values are statistically significant at p <0.05)