i
NUMERICAL MODELING AND
ANALYSIS OF SMALL GAS TURBINE
ENGINE
PART I: ANALYTICAL MODEL AND
COMPRESSOR CFD
NAWAZ AHMAD
MSC THESIS Stockholm, Sweden 2009
Reference to this publication can be referred as: Ahmad, N. 2009. Numerical Modeling and Analysis of Small Gas Turbine Engine: Part I: Analytical Model and Compressor CFD. MSc Thesis, EGI-2009-001MSC EKV1128, 139 p.
iii
Numerical Modeling and Analysis of Small Gas Turbine Engine
Part I: Analytical Model and Compressor CFD
Nawaz Ahmad
MSc Thesis
2009
Department of Energy Technology Division of Heat and Power Technology
Royal Institute of Technology 100 44 Stockholm, Sweden
iv
MSc Thesis
EGI-2009-001MSC EKV1128
Numerical Modeling and Analysis of
Small Gas Turbine Engine
Part I: Analytical Model and Compressor
CFD
Nawaz Ahmad
Approved Examiner
Prof. Torsten H. Fransson
Supervisor
Doc. Damian M. Vogt
Commissioner Contact person
ABSTRACT
The thesis work aims at devising analytical thermodynamic model and numerical modeling of the compressor of a small gas turbine to be operated on producer gas with lower heating contents. The turbine will serve as a component of “EXPLORE-Biomass Based Polygeneration” project to meet the internal electrical power requirements of 2-5 KW. The gas turbine engine is of radial type (one stage radial compressor, one stage radial turbine). Small gas turbines give less electrical efficiencies especially when operated with lower heating contents fuels like producer gas. This necessitates for optimum designing of components of the entire machine.
Detailed analytical thermodynamic modeling of the engine has been analyzed for both internally and externally fired gas turbine cycles. Efforts are put on optimum utilization of energy available in the cycle and to enhance the efficiency thereby including various components.
Numerical modeling of compressor using CFX has been performed for both steady and unsteady states. First different mesh sizes have been investigated followed by study of RMS residual targets on the results. Compressor performance has been studied for various speed lines. Thereafter, detailed steady state and unsteady simulations are performed for various cases including compressor single blade passage, 360 degree complete compressor, compressor connected with straight inlet pipe and for the compressor connected with 90 degree bended pipe.
The operating point of the entire engine is analyzed. The numerical results are compared with each other and then to the ones from the 1D modeling. A good agreement has been found between the numerical results. Compared to 1D modeling, CFD presents higher performance at higher mass flow rates. However, for lower mass flow rates both 1D model and CFD present a similar performance.
v
ACKNOWLEDGEMENTS
I would like to express my gratitude to Professor Torsten H. Fransson at the Chair of Heat and Power Technology at the Royal Institute of Technology, Stockholm, for giving me the chance to perform this thesis work.
Special thanks go to my supervisor Dr. Damian M Vogt for his continuous guidance and time out of his busy schedule whenever I needed.
I also want to thank, Higher Education Commission of Pakistan for granting me the scholarship. Also special thanks to my employer, Ministry of Petroleum and Natural Resources of Pakistan for deputing me in Sweden for higher education. Also special thanks go to my wife who not only provided me a great and continuous moral support throughout this thesis work but also taken care of new born daughter and provided me the opportunity to work for long hours. Very special thanks to my 9 months old daughter Imaan Fatima who always welcomed me at home with great smile. I am deeply grateful to the rest of my family members especially my old and sick Mother in Pakistan for their great moral support for staying in Sweden.
vi
TABLE OF CONTENTS
ABSTRACT ... IV ACKNOWLEDGEMENTS ... V TABLE OF CONTENTS ... VI LIST OF FIGURES ... IX LIST OF TABLES ... XIII NOMENCLATURE ... XV1 BACKGROUND ... 1
1.1 MICRO GAS TURBINE ... 3
1.2 MICRO GAS TURBINE AND BIOMASS ... 5
1.3 INTERNALLY FIRED MICRO GAS TURBINE ... 7
1.4 EXTERNALLY FIRED MICRO GAS TURBINE ... 7
1.5 COMPRESSOR ... 9
1.6 REGENERATOR ... 13
1.7 COMBUSTION ... 15
1.7.1 Micro-Combustor Challenges ... 15
1.7.2 Combustion of Low LHV Fuels ... 16
1.7.3 Gas Turbine Combustor Configurations ... 17
1.7.3.1 Combustion Separated Zones ... 17
1.7.3.2 Catalytic Combustion ... 17
1.7.3.3 Engine size ... 18
1.7.3.4 Lean Premixed-Prevaporized (LPP) combustion ... 18
1.7.3.5 Lean Premixed Combustion ... 19
1.7.3.6 Rich Burn- Quick Mix-Lean Burn (RQL) Combustor ... 21
1.7.4 Micro Gas Turbine Combustors ... 22
1.7.4.1 The Annular Combustor Scaled for MGT applications ... 22
1.7.4.2 The Lean-Premixed Combustor ... 23
1.7.4.3 Rich Burn- Quick Quench-Lean Burn (RQL) Combustor ... 24
1.7.4.4 Comparison between the Combustors for MGT ... 24
1.8 EMISSIONS ... 25
1.9 GENERATOR AND POWER ELECTRONICS ... 25
1.10 MODELING TECHNIQUES ... 26
2 OBJECTIVES ... 28
3 METHOD OF ATTACK... 29
4 BOUNDARY CONDITIONS ... 30
4.1 FUEL FOR THE GAS TURBINE ... 30
5 THERMODYNAMIC LAYOUT ... 31
5.1 INTERNALLY FIRED MICRO GAS TURBINE CYCLE ... 31
5.1.1 Compressor ... 32
5.1.1.1 Conditions at inlet of impeller ... 40
5.1.2 Regenerator ... 40
5.1.3 Combustor ... 42
5.1.4 Turbine ... 46
5.1.4.1 Conditions at rotor inlet ... 47
5.1.4.2 Conditions at rotor outlet ... 50
5.1.5 Exhaust Heat Recovery ... 54
5.1.6 Fuel Compression ... 54
5.2 EXTERNALLY FIRED MICRO GAS TURBINE (EFGT)CYCLE ... 55
5.2.1 High Temperature Heat Exchanger ... 56
5.2.2 Exhaust Heat Recoveries ... 58
5.2.2.1 Gas-to-Water Heat Exchanger ... 58
5.2.2.2 Air-to-Water Heat Exchanger ... 59
5.2.3 Fuel Compression ... 60
vii
6 NUMERICAL STUDIES ... 61
6.1 CONVERGENCE STUDY-INFLUENCE OF MESH SIZE ... 63
6.2 CONVERGENCE STUDY-INFLUENCE OF RMS RESIDUAL TARGET ... 68
6.3 COMPRESSOR PERFORMANCE... 69
6.4 STEADY STATE COMPRESSOR SIMULATIONS ... 72
6.4.1 Single blade passage (inlet, impeller and diffuser) ... 72
6.4.2 360 degree compressor model (inlet, impeller and diffuser) ... 73
6.4.3 360 degree compressor model (inlet, rotor and diffuser) connected with inlet straight pipe ... 75
6.4.4 Complete compressor-360 degree model (inlet, rotor and diffuser) connected with inlet 90 degree bended pipe ... 80
6.5 TRANSIENT COMPRESSOR SIMULATIONS ... 84
6.5.1 Single blade passage (inducer, impeller and diffuser) ... 84
6.5.2 Complete compressor-360 degree model (inlet, rotor and diffuser) ... 85
6.5.3 Complete compressor-360 degree model (inlet, rotor and diffuser) connected with inlet straight pipe ... 86
6.5.4 Complete compressor-360 degree model (inlet, rotor and diffuser) with connected inlet bended pipe ... 87
6.6 ANALYSIS OF NUMERICAL SIMULATIONS ... 89
7 RESULTS AND DISCUSSIONS ... 90
7.1 INTERNALLY FIRED GAS TURBINE CYCLE-1.749KWEL FOR ROTATIONAL SPEED OF 120000RPM ... 90
7.2 INTERNALLY FIRED GAS TURBINE CYCLE-2.388KWEL FOR ROTATIONAL SPEED OF 130000RPM ... 92
7.3 EXTERNALLY FIRED GAS TURBINE CYCLE-0.64KWEL FOR ROTATIONAL SPEED OF 120000RPM ... 95
7.4 EXTERNALLY FIRED GAS TURBINE CYCLE-0.986KWEL FOR ROTATIONAL SPEED OF 130000RPM ... 98
7.5 PARAMETRIC STUDIES/ANALYSIS OF THE SYSTEM COMPONENTS ... 101
7.5.1 Compressor ... 101
7.5.2 Exhaust heat recovery heat exchangers ... 101
7.5.3 Turbine ... 102
8 CONCLUSIONS AND FUTURE WORK ... 103
9 REFERENCES ... 105
10 APPENDICES ... 109
10.1 APPENDIX-A ... 109
Derivation of relation for specific fuel consumption (β ) ... 109
10.2 APPENDIX-B ... 110
Explore-Biomass based Polygeneration Flow Chart ... 110
10.3 APPENDIX-C ... 111
OVERALL SYSTEM LAYOUT FOR INTERNALLY FIRED GAS TURBINE CYCLE ... 111
10.3.1 Compressor (COMPR-air compression) ... 111
10.3.2 Regenerator ... 112
10.3.3 Combustor ... 112
10.3.4 Turbine ... 112
10.3.5 Exhaust Heat Recovery-Heat Exchanger (HEATREC)... 113
10.3.6 Compressor (BIOCOMP-fuel compression) ... 113
10.4 APPENDIX-D ... 115
OVERALL SYSTEM LAYOUT FOR EFGTCYCLE ... 115
10.4.1 Compressor (MAINCOMP-air compression in the internal flow path) ... 116
10.4.2 High Temperature Heat Exchanger ... 116
10.4.3 Turbine ... 116
10.4.4 Regenerator ... 117
10.4.5 Air-to-Water Heat Exchanger (HEATREC1) ... 117
10.4.6 Compressor (AIRCOMP-air compression in the external flow path) ... 118
10.4.7 Compressor (BIOCOMP-fuel compression) ... 118
10.4.8 Combustor ... 119
10.4.9 Gas-to-Water Heat Exchanger (HEATREC2) ... 119
10.5 APPENDIX-E... 120
10.5.1 Excel calculations-Internally fire gas turbine cycle (2.388kWel) ... 120
10.6 APPENDIX-F ... 124
10.6.1 Matlab code- Compressor (2.388kWel machine-Internally fired gas turbine cycle) ... 124
viii
10.7 APPENDIX-G ... 129
10.7.1 Excel calculations-Externally fired gas turbine cycle (0.986kWel) ... 129
10.8 APPENDIX-H ... 134
10.8.1 Matlab code-Compressor (0.986kWel machine-Externally fired gas turbine cycle) ... 134
ix
LIST OF FIGURES
Figure 1.1: Gas Turbine Unit & Brayton Cycle [Available from URL
<http://commons.wikimedia.org/wiki/File:Brayton_cycle.svg>(accessed 2009.08.17)] ... 1
Figure 1.2: Gas turbine Brayton cycle, showing effect of departure from ideal behavior in compressor and the turbine [Available from URL<web.mit.edu/.../thermodynamics/notes/node85.html>(accessed 2009.08.26)] [Z.S. Spakovszky; Thermodynamics and Propulsion] ... 2
Figure 1.3: Mechanical Power vs speed and Turbine Inlet Temperature (TIT) (without recuperator) [Available from URL<powerMEMS;www.powermems.be/gasturbine.html>(accessed May 2009)] [Ultra Micro Gas Turbine Generator] ... 2
Figure 1.4 : Micro Gas turbine Layout [Peirs J. et al; 2003] [Availabe at URL<http://www.esat.kuleuven.be/electa/publications/fulltexts/pub_1470.pdf> (accessed 4 May 2009] ... 4
Figure 1.5: Schematic of Micro gas turbine [Sann and Palanisamy; 2008] ... 4
Figure 1.6: Contribution of biomass producer gas, by volume and energy, to total micro gas turbine fuel input as function of output power[Rabou et al; 2007] ... 6
Figure 1.7: Scheme of a plant with a MGT coupled with a gasifier [Matteo et al; 2008] ... 7
Figure 1.8: Simple indirectly/externally fired gas turbine [Gauthier; 2007] ... 8
Figure 1.9: Compressor flow path [howstuffworks, 2008] ... 9
Figure 1.10: Compressor Map [Garrett by Honeywall, Turbo Tech 103(Expert)] [Available at URL < http://www.turbobygarrett.com/turbobygarrett/tech_center/turbo_tech103.html>( accessed May 2009)] ... 10
Figure 1.11: Compressor Operating Point [Available at URL< http://www.cheresources.com/compressor_surging_under_control.shtml>(accessed May 2009)] ... 11
Figure 1.12: Compressor Surge Phenomenon [Available at URL< http://www.cheresources.com/compressor_surging_under_control.shtml>(accessed May 2009)] ... 11
Figure 1.13: Shift of Surge line by use of Ported Shroud ... 12
[Garrett by Honeywall, Turbo Tech 103(Expert)][Available at URL< http://www.turbobygarrett.com/turbobygarrett/tech_center/turbo_tech103.html>(accessed May 2009)] ... 12
Figure 1.14: A Ported Shroud Compressor ... 13
[Garrett by Honeywall, Turbo Tech 103(Expert)][Available at URL< http://www.turbobygarrett.com/turbobygarrett/tech_center/turbo_tech103.html>(accessed May 2009)] ... 13
Figure 1.15: Regenerative Gas Turbine Cycle [Available at URLhttp://www.cospp.com/display_article/273000/122/ARTCL/none/TECHS/1/Gas-turbine-efficiency/(accessed March 2009)] ... 14
Figure 1.16: The influence of the recuperator performance on the thermal efficiency of the cycle [Shih et al; 2006] ... 15
Figure 1.17: Staged Annular Combustor[Tuccillo and Cameretti; 2005] ... 17
Figure 1.18: Small Engine’s Reverse-Flow Combustor [Tuccillo and Cameretti;. 2005] ... 18
Figure 1.19: Lean Premixed Pre-vaporized Combustion Configurations [Tuccillo and Cameretti; 2005] ... 19
Figure 1.20: Mechanism of DLN (Dry-Low-NOx) Pre-mixed Combustion scheme [Tuccillo and Cameretti; 2005] ... 19
x
Figure 1.22: Sequential gas turbine combustion technique [Döbbeling et al; 2005] ... 21
Figure 1.23: Thermodynamic cycle for the sequential combustion process versus the conventional combustion process [Döbbeling et al; 2005] ... 21
Figure 1.24: Air and Fuel Flow Paths in a RQL type Combustor [Tuccillo and Cameretti; 2005] ... 22
Figure 1.25: The schematic of the full size and the scaled annular combustor [Tuccillo and Cameretti; 2005] ... 22
Figure 1.26: Overview of the whole Lean-Premixed Combustor [Tuccillo and Cameretti; 2005] ... 23
Figure 1.27: Axial development of the Lean-Premixed Combustor [Tuccillo and Cameretti; 2005] ... 23
Figure 1.28: Schematic of RQL Combustor [Tuccillo and Cameretti; 2005] ... 24
Figure 5.1: Schematic for the Internally Fired Micro Gas Turbine [Aspen software] ... 31
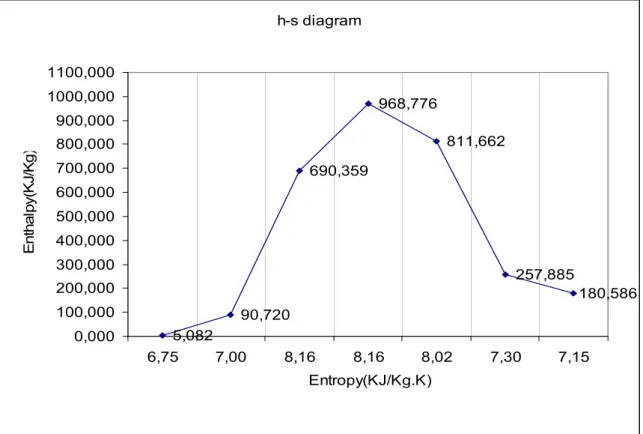
Figure 5.2: h-s diagram for overall cycle of 2.388kW internally fired gas turbine ... 32
Figure 5.3: View of compressor single blade passage [ANSYS-CFX] ... 33
Figure 5.4: Impeller Inlet flow directions [Dixon; 1998] ... 33
Figure 5.5: Impeller exit flow directions [Dixon; 1998] ... 34
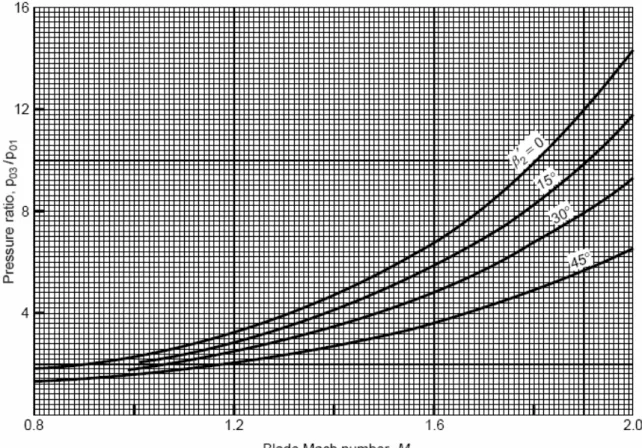
Figure 5.6: Variation of pressure ratio vs blade Mach number of a centrifugal compressor for selected back-sweep angle (γ =1.4,ηc =0.8,σ =0.9,φ2 =0.375)[Dixon; 1998] ... 36
Figure 5.7: Variation of impeller exit Mach number vs blade Mach number of a centrifugal compressor for selected back-sweep angles (γ =1.4, σ =0.9, φ2 =0.375) [Dixon; 1998] ... 37
Figure 5.8: Mollier diagram for compressor stage [Dixon; 1998] ... 38
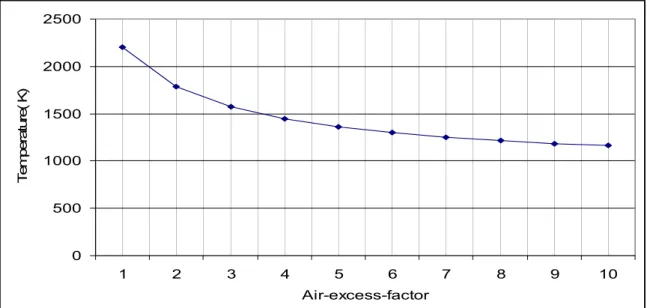
Figure 5.9: Variation of adiabatic flame temperature with varying air-excess-factor for air and fuel temperature at 298K ... 45
Figure 5.10: Variation of adiabatic flame temperature with varying air-excess-factor for air temperature at 418K and fuel temperature at 955K ... 46
Figure 5.11: Layout of radial turbine[Dixon; 1998] ... 47
Figure 5.12: Mollier diagram for 90 degree Inward Flow Radial turbine and diffuser [Dixon; 1998] ... 48
Figure 5.13: Velocity diagrams for radial turbine [Dixon; 1998] ... 49
Figure 5.14: Schematic for EFGT cycle [Aspen software] ... 55
Figure 5.15: h-s diagram for overall cycle of 0.986kWel machine-EFGT ... 56
Figure 6.1: view of single blade passage (Inlet, Impeller and Diffuser) ... 61
Figure 6.2: Blade-to-blade plane (inlet, impeller and diffuser) of a coarse mesh (node counts 20000) ... 64
Figure 6.3: Blade-to-blade passage (inlet, impeller and diffuser) of a coarse mesh (node counts 20000) ... 64
Figure 6.4: Shroud and Hub Layers of a coarse mesh (node counts 20000) ... 65
Figure 6.5: Shroud plane of a coarse mesh (node counts 20000) ... 65
Figure 6.6: Hub plane of a coarse mesh (node counts 20000) ... 66
Figure 6.7: CFD results for various mesh sizes-influence of mesh size ... 67
Figure 6.8: convergence study-influence of RMS residual target ... 68
Figure 6.9: Compressor performance (variation of pressure ratio with mass flow rate) .... 70
Figure 6.10: Compressor performance (variation of efficiency with mass flow rate) ... 70
Figure 6.11: Comparison of 1D and CFD results ... 71
Figure 6.12: Steady state compressor performance (variation of pressure ratio with mass flow rate) for a single blade passage at rotational speed of 120000rpm ... 72
Figure 6.13: Steady state compressor performance (variation of efficiency with mass flow rate) for a single blade passage at rotational speed of 120000rpm ... 73
xi
Figure 6.15: Steady state compressor characteristics (variation of pressure ratio with mass flow rate)-comparison between single blade passage and 360degree complete compressor ... 75 Figure 6.16: Steady state compressor characteristics (variation of efficiency with mass flow rate)-comparison between single blade passage and 360degree complete compressor ... 75 Figure 6.17: View of 360 degree compressor model connected with inlet straight pipe ... 76 Figure 6.18: Mesh surfaces (wall and face) of a straight inlet pipe ... 77 Figure 6.19: Contour of total pressure at inlet of the compressor (interface S2-S1 side 2) . 78 Figure 6.20: Contour of static pressure at inlet of the compressor (interface S2-S1 side 2)78 Figure 6.21: Contour of Mach number at inlet of the compressor ... 78 (interface S2-S1 side 2) ... 78 Figure 6.22: Steady state compressor characteristics (variation of pressure ratio with mass flow rate) for a 360 degree compressor with connected inlet straight pipe ... 79 Figure 6.23: Steady state compressor characteristics (variation of efficiency with mass flow rate) for a 360 degree compressor with connected inlet straight pipe ... 79 Figure 6.24: View of 90 degree bended pipe connected at inlet of the compressor ... 80 Figure 6.25: Mesh of 90 degree bended pipe ... 81 Figure 6.26: Contour of total pressure at inlet of the compressor (interface S2-S1 side 2) . 82 Figure 6.27: Contour of static pressure at inlet of the compressor (interface S2-S1 side 2)82 Figure 6.28: Contour of Mach number at inlet of the compressor ... 82 (interface S2-S1 side 2) ... 82 Figure 6.29: Steady state compressor characteristics (variation of efficiency with mass flow rate) for 360 degree compressor model with connected inlet 90 degree bended pipe ... 83 Figure 6.30: Steady state compressor characteristics (variation of efficiency with mass flow rate) for 360 degree compressor model with connected inlet 90 degree bended pipe ... 83 Figure 6.31: Comparison of unsteady simulations with steady state simulations for single blade passage (variation of pressure ratio with mass flow rate) ... 84 Figure 6.32: Comparison of unsteady simulations with steady state simulations for single blade passage (variation of efficiency with mass flow rate) ... 85 Figure 6.33: Comparison of unsteady simulations with steady state simulations for 360 degree compressor model (variation of pressure ratio with mass flow rate) ... 85 Figure 6.34: Comparison of unsteady simulations with steady state simulations for 360 degree compressor model (variation of efficiency with mass flow rate) ... 86 Figure 6.35: Comparison of unsteady simulations with steady state simulations for 360 degree compressor model connected with inlet straight pipe (variation of pressure ratio with mass flow rate) ... 87 Figure 6.36: Comparison of unsteady simulations with steady state simulations for 360 degree compressor model connected with inlet straight pipe (variation of efficiency with mass flow rate) ... 87 Figure 6.37: Comparison of unsteady simulations with steady state simulations for 360 degree compressor model connected with inlet 90 degree bended pipe (variation of
pressure ratio with mass flow rate) ... 88 Figure 6.38: Comparison of unsteady simulations with steady state simulations for 360 degree compressor model connected with inlet 90 degree bended pipe (variation of
efficiency with mass flow rate) ... 88 Figure 7.1: h-s diagram for overall cycle of 1.749kW internally fired gas turbine ... 91 Figure 7.2: Compressor-turbine combined characteristics for 1.749kW internally fired gas turbine ... 92 Figure 7.3: h-s diagram for overall cycle of 2.388kW internally fired gas turbine ... 94 Figure 7.4: Compressor-turbine combined characteristics for 2.388kW internally fired gas turbine ... 95
xii
Figure 7.5: h-s diagram for overall cycle of 0.64kW-EFGT ... 97 Figure 7.6: Compressor-turbine combined characteristics for 0.64kW-EFGT ... 98 Figure 7.7: h-s diagram for overall cycle of 0.986kWel machine-EFGT ... 100
Figure 7.8: Compressor-turbine combined characteristics for 0.986kWel machine-EFGT101
Figure 10.1: Biomass based Polygeneration Flow Char [Design of EXPLORE-Biomass based polygeneration platform, Jahns Frederick; 2008] ... 110 Figure 10.2: Schematic for Internally Fired Micro Gas Turbine [Aspen software] ... 111 Figure 10.3: Schematic for EFGT cycle [Aspen software] ... 115
xiii
LIST OF TABLES
Table 1.1: Effect on cycle performance with varying pressure drop and recuperator
efficiency [Shih et al; 2006]. ... 14
Table 4.1: Fuel properties [Jahns Frederick; 2008, (b)- Brusson Nicolas, Project Report; 2008 (Modelling of a gas cleaning system for EXPLORE project downdraft gasification unit)] ... 30
Table 5.1:Variation of adiabatic flame temperature with varying air-excess-factor for air and fuel temperature at 298K ... 45
Table 5.2: Variation of adiabatic flame temperature with varying air-excess-factor for air temperature at 418K and fuel temperature at 955K ... 45
Table 6.1: Geometry of impeller of the compressor ... 61
Table 6.2: Mesh information of a coarse mesh (node counts 20000) for a single blade passage (Inlet, Impeller and Diffuser) ... 62
Table 6.3: Detailed mesh information for various mesh sizes ... 63
Table 6.4: Boundary conditions for a single blade passage-influence of mesh size ... 66
Table 6.5: CFD results for various mesh sizes-influence of mesh size ... 67
Table 6.6: Mesh information of a coarse mesh for single blade passage (Inlet, Impeller and Diffuser)-used to study the compressor performance ... 69
Table 6.7: Compressor performance indicators ... 69
Table 6.8: Boundary conditions for 360 degree compressor model (inlet, rotor and diffuser) with connected inlet straight pipe ... 78
Table 6.9: Boundary conditions for 360 degree compressor model (inlet, rotor and diffuser) connected with 90 degree bended inlet pipe ... 81
Table 7.1: Geometry information of 1.749kWel machine-internally fired gas turbine ... 90
Table 7.2: 1D results from Excel for 1.749kWel machine-internally fired gas turbine ... 91
Table 7.3: Geometry information of 2.388kWel machine-internally fired gas turbine ... 93
Table 7.4: 1D results from Excel 1.749kWel machine-internally fired gas turbine ... 93
Table 7.5: Geometry information of 0.64kWel machine-EFGT ... 96
Table 7.6: 1D results from Excel ... 96
Table 7.7: Geometry information of 0.986kWel machine-EFGT ... 99
Table 7.8: 1D results from Excel for 0.986kWel machine-EFGT ... 99
Table 7.9: Parametric analysis of the compressor ... 101
Table 7.10: Parametric analysis of heat recovery heat exchangers ... 101
Table 7.11: Parametric analysis of the turbine ... 102
Table 10.1: Air compressor description (indices and control points) ... 112
Table 10.2: Regenerator description (indices and control points) ... 112
Table 10.3: Combustor description (indices and control points) ... 112
Table 10.4: Turbine description (indices and control points) ... 113
Table 10.5: Heat Exchanger description (indices and control points) ... 113
Table 10.6: BIOCOMP-Compressor description (indices and control points) ... 114
Table 10.7: Compressor description (indices and control points) for air compression in the internal flow path ... 116
Table 10.8: High temperature heat exchanger description (indices and control points) ... 116
Table 10.9: Turbine description (indices and control points) ... 117
Table 10.10: Regenerator description (indices and control points) ... 117
Table 10.11: Air-to-water heat exchanger description (indices and control points) ... 118
Table 10.12: Compressor description (indices and control points) for air compression in the external flow path ... 118
Table 10.13: Compressor description (indices and control points) for fuel compression . 119 Table 10.14: Combustor description (indices and control points) ... 119
xiv
xv
NOMENCLATURE
Latin Symbols
A Area [m2]
Cp Specific heat at constant pressure [J kg-1 K-1]
D Diameter [m] P Power [W] h Specific enthalpy [Jg-1] m mass [g] p Pressure [N m-2] T Temperature [K]
u Impeller tip Velocity [m sec-1]
M Mach Number [ ]
R Specific Gas Constant [J/kg. K]
c Absolute velocity of the fluid [ms-1]
w Relative Velocity of the fluid [ms-1]
cθ Tangential component of absolute velocity [ms-1]
cr Radial component of absolute velocity [ms-1]
n Number of Impeller blades [ ]
s entropy [J/K]
b Impeller outlet width [m]
r Impeller radius [m]
f
m Fuel flow rate [g/s]
air
m Air flow rate [g/s]
Greek Symbols
ρ Density [kg m-3]
c
η Compressor isentropic efficiency [°]
β Relative flow relative angle with impeller [degree] α Absolute flow angle with the impeller [degree]
φ Flow co-efficient [°]
σ Slip factor [°]
γ Ratio of specific heats [°]
tt
η Total to total efficiency [°]
comb
η Combustor efficiency [°]
w relative velocity [m/s]
π pressure ratio [°]
Abbreviations
MGT Micro Gas Turbine
LHV Lower Heating Value
EFGT/IFGT Externally fired gas turbine/Indirectly fired gas turbine HPT Division of Heat and Power Technology
xvi
HCV High Calorific Value
TIT Turbine Inlet Temperature CFD Computational Fluid Dynamics KTH Kungl. Tekniska Högskolan
LE Leading Edge
NGV Nozzle Guide Vane
TE Trailing Edge
IFR Inward Flow Radial
AFT Adiabatic Flame Temperature
HC Hydrocarbon
UHC Unburned Hydrocarbon
LPP Lean Premixed-Prevaporized
LP Lean Premixed
DLN Dry Low NOx
RQL Rich burn-quick mix-lean burn
AC Alternating Current
1
1 BACKGROUND
A gas turbine function is to produce mechanical power to drive a pump, compressor or an electric generator etc. Within the gas turbine, fuel chemical energy is converted into heat energy, and is used for producing mechanical energy. Air serves as a working fluid for the engine which is compressed in the compressor, used in combustion in the combustor and resulting combustion gases are fed into the expander for production of mechanical energy. The gas turbine cycle is based on the Brayton cycle, shown below;
Figure 1.1: Gas Turbine Unit & Brayton Cycle [Available from URL
<http://commons.wikimedia.org/wiki/File:Brayton_cycle.svg>(accessed 2009.08.17)] In the P-v and T-s diagram (Figure 1.1) air is compressed in a compressor as is shown in process1-2 and allowed to expand in the turbine as shown in process 3-4. Process 2-3 represents heating of working fluid at constant pressure and process 4-1 is for the cooling to take place at constant pressure. Temperature at point 3 shown in T-s diagram is defined as Turbine Inlet Temperature (TIT). The variation of temperature in the cycle also results in enthalpy (h) variation of the working medium. Due to various types of losses the compression and expansion process stay not ideal. The affects are shown in the h-s diagram (Figure 1.2) below;
2
Figure 1.2: Gas turbine Brayton cycle, showing effect of departure from ideal behavior in compressor and the turbine [Available from
URL<web.mit.edu/.../thermodynamics/notes/node85.html>(accessed 2009.08.26)] [Z.S. Spakovszky; Thermodynamics and Propulsion]
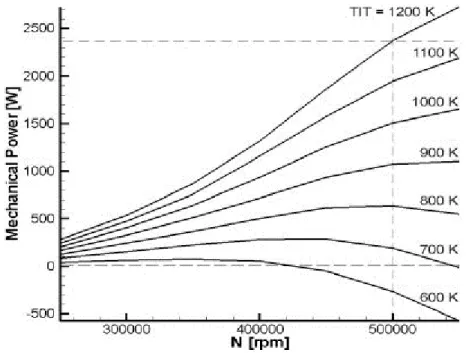
TIT has drastic effect on cycle parameters like work output, specific fuel consumption and overall efficiency. Higher TIT and pressure ratio leads to higher efficiency but at the same time poses challenges to turbine material and aims of reducing the NOx emissions. For a micro gas turbine producing a net mechanical
power output of 1180W, the effect of temperature and speed on the power output is presented below (Figure 1.3);
Figure 1.3: Mechanical Power vs speed and Turbine Inlet Temperature (TIT) (without recuperator) [Available from
URL<powerMEMS;www.powermems.be/gasturbine.html>(accessed May 2009)] [Ultra Micro Gas Turbine Generator]
The overall efficiency of the cycle depends on many factors including compressor efficiency, TIT, temperature of gases leaving the turbine, mass flow through the
3
compressor, pressure drops through inlet air filters, exhaust gas silencers, ducts and stack. In order to increase the cycle efficiency the following techniques are normally employed;
• Increase in turbine inlet temperature • Regeneration
• Compressor inter-cooling • Turbine reheat
• Steam/water injection
However, increase in TIT has become challenging and already reached at a state where it is higher than the melting point of some of the components of the turbine. Therefore, in addition to effective cooling techniques, better materials with improved heat resistance capabilities and improved thermal barrier coating techniques are needed.
Unlike large scale gas turbines, micro gas turbine (MGT) usually consists of one stage employing radial compressor and turbine rotors. Compared with axial turbine, radial turbine gives advantage of producing greater amount of work per stage with ease of manufacture and rugged [Dixon; 1998]. Mostly MGT are single shaft and low pressure ratio gas turbines [Pilavachi; 2002]. However, Peirs et al. (2003) have reported about employing the axial rotor with diameter of 10mm for an MGT which is currently at development stage. Radial flow gas turbines have certain attractive features like simplicity, reliability, low emissions, multi-fuel capabilities and are ideal for small scale electrical power generation applications particularly in the range of 10kW-100kW [Ebaid et al; 2002].
The efficiency of MGT is lower mainly due to profile and tip clearance losses [Shih et al; 2006]. Towards efficiency improvement research efforts are going on employing state of the art latest numerical modeling techniques.
1.1 Micro gas turbine
For power applications above 500kW axial type machines are employed, however, for small power generation applications ranging from 20KW-500KW, MGT is used with having advantages of more compact than axial flow type gas turbine with the ability to handle the small volumetric flows with higher efficiency [Sann and Palanisamy; 2008]. MGT run at higher speeds and is suitable candidate to be employed in combined heat and power systems giving the overall higher efficiencies [Sann and Palanisamy; 2008].
Similar to large size gas turbine, MGT is based on thermodynamic Brayton cycle. The cycle may be simple cycle, with no heat recovered from the exhaust for preheating the air after the compressor or may be the recuperated cycle thus giving better electrical efficiencies. Figure 1.4, below shows the MGT employing the recuperated cycle.
4
Figure 1.4 : Micro Gas turbine Layout [Peirs J. et al; 2003] [Availabe at
URL<http://www.esat.kuleuven.be/electa/publications/fulltexts/pub_1470.pdf> (accessed May 2009]
In the recuperated cycle, the air is compressed in the compressor, passed through the regenerator/recuperator where it extracts the thermal energy from the hot exhaust gases coming from the turbine outlet. Burning of preheated air in the combustor requires less fuel for the same power output and thus offers better cycle efficiency. Before letting the gases go to the atmosphere, maximum possible thermal energy is recovered through employing the recuperator. The exhaust gas after passing through the recuperator still may have recoverable heat energy which is also recovered employing another heat exchanger (Figure 1.5).
Figure 1.5: Schematic of Micro gas turbine [Sann and Palanisamy; 2008]
The efficiency of MGT is lower as compared to large axial gas turbine mainly due to profile and tip clearance losses [Shih et al; 2006]. The authors have reported an electrical efficiency between 25%-30% for micro turbines in the range of 30kW-100kW. An electrical efficiency of 20%, for a micro turbine with a power range of
5
8.5kW-9kW, is considered among the top performing micro turbines [Shih et al; 2006].
With compressor, turbine and the generator fixed on a single shaft gives reduced technical complexity and use of air bearings instead of conventional bearings results in less maintenance requirements for MGT [Sann and Palanisamy; 2008]. New aerodynamic bearings have been developed and successfully tested with stable operation at speeds up to 685000 rpm and are going to be implemented on turbo-shaft set up [powerMEMS].
Also due to inherent characteristics of continuous combustion and continuous rotation, MGT, for small scale power generation, are being preferred over internal combustion engines as friction is one of the difficulties towards downscaling of internal combustion engines [Isomura et al; 2005]. However, electrical efficiency of MGTs is lower than the reciprocating engines. Gillette (2008) has reported electrical efficiencies of 29% and 35.8% for MGTs and reciprocating engines respectively for 65KW electrical power output. For 5 kWel power generating
capacity, overall electrical efficiencies of 33% and 19% for reciprocating engine and MGT respectively have been reported [Moss et al; 2004]. However, compared to reciprocating engines MGT technology requires low maintenance cost [Gillette; 2008].
Through a continuous combustion supported with excess air, a good fuel/air mixture results in clean combustion and less pollutant emissions as compared to the reciprocating engines. Rabou et al. (2007) have reported that as compared to gas engine of same capacity, MGT produces 40 times less CO and 10 times less NO at full power operations running either on natural gas or biomass producer gas.
1.2 Micro Gas Turbine and Biomass
To be feasible for small scale bio-energy power plants, MGTs are commercially available in the power range of 30-200 KWel [Matteo et al; 2008]. MGT cycles have
also additional benefit of utilizing exhaust hot gases from MGT as a source of heat for the gasifier for assisting the endothermic reaction to take place.
Biomass gasification is an appropriate tool to use biomass in environmental friendly ways. Small scale gasification, employing downdraft gasifier, is a promising technology towards utilization of small and distributed potential of biomass with the ability to supply the producer gas with a low tar contents (0.015-0.5g/Nm3) [Matteo et al; 2008]. The authors have reported that small scale gasifiers (upto 500kWth) are usually based on downdraft technology with
satisfactory conversion efficiency. When coupled with MGT also provides the opportunity for co-generation with available exhaust gas heat at medium temperature for biomass drying.
Rabou et al. (2007) have investigated the operation of standard Capstone 30kWel
MGT without modifications, with varying composition of producer gas mixed with natural gas. The authors have reported the possibility of operation of MGT with 100% biomass producer gas with heating value of 6MJ/Nm3 (in our case producer gas heating value is around 5.22 MJ/Nm3). However, insufficient combustion
6
stability was observed for operations longer than one hour when running with 100% producer gas. Stable combustion was obtained when a small amount of natural gas was mixed with producer gas with resulting heating value of 8MJ/Nm3. The authors have therefore concluded that the Capstone MGT would run reliably with a producer gas but with slightly higher heating value. A negligible effect has been observed on the gross efficiency of the MGT with reduction in fuel heating value, which is due to higher power demand for compression of larger fuel volume to get the same heat input. Figure 1.6 below presents the results of the experiments conducted; where the power output considerably decreases with increasing contribution of producer gas [Rabou et al; 2007].
Figure 1.6: Contribution of biomass producer gas, by volume and energy, to total micro gas turbine fuel input as function of output power[Rabou et al; 2007]
Matteo et al. (2008) have investigated on a MGT fed by blends of biomass producer gas and natural gas. For pure producer gas case, the authors have reported an electrical output of 30% lower than for the nominal condition with natural gas feeding. This is due to higher power consumption for the producer gas compression, whereas an increase of 32.9% of thermal output is estimated which is mainly due to increase in exhaust gas temperature.
Barros and Pericles (2004) have analyzed the use of biomass in gas turbine and have reported that gas turbine cycles are most suitable for biomass fuels. Due to gas turbine engines being very much sensitive to fuel quality one of the option is to gasify the biomass. However, in order to utilize gas from the gasifier there is need for cleaning the gas to get rid of unwanted contents like tars, particulates, alkalies and heavy metals. Clogging in valves and filters occurs due to tars condensing on cool surfaces. Alkalis such as Na and K cause corrosion of turbine blades whereas particulates are more critical and even small amount of particulates cause erosion problems [Matteo et al; 2008].
For biomass producer gas having low heating contents, higher fuel flow rate is required which leads to larger size of turbine for the same power output as compared to natural gas based turbine. Also fuel compression is required in order
7
to make it able to be injected in the combustor. Larger flow rate passing through the turbine leads to an increase of the pressure ratio with associated risk of surge.
1.3 Internally Fired Micro Gas Turbine
Direct and indirect firing techniques exist for utilizing biomass in the gas turbine. Under the direct firing techniques, one is Pressurized Fluidized Bed Combustion (PFBC) and the other is Biomass Integrated Gasification Gas Turbine (BIGGT). Figure 1.7, below shows the BIGGT technique wherein gasified gases are directly fired in the internal combustor.
Figure 1.7: Scheme of a plant with a MGT coupled with a gasifier [Matteo et al; 2008] Bohn and Lepers (2003) have investigated the effects of biogas combustion on the operation characteristics of an MGT and have reported that replacing the natural gas with biogas results in decreased turbine efficiency due to the following main reasons;
i) Lower gas temperature at combustor inlet due to higher biogas flow rate which is at lower temperature as compared to the air preheated in the recuperator.
ii) Large exhaust losses due to larger share of CO2 having higher specific
heat.
1.4 Externally Fired Micro Gas Turbine
The indirectly fired gas turbine (IFGT) also called externally fired gas turbine (EFGT) is well suited for direct fuel burning techniques without employing the gasification systems. However, corrosive fuels put difficulties for high temperature heat exchangers. EFGT have a disadvantage of limitations on maximum TIT, due to heat exchanger material incapability of withstanding at the higher temperature, which results in decreased efficiency as reduced TIT has drastic impact on the power output and the efficiency. Figure 1.8 presents the schematic of simple EFGT.
8
Figure 1.8: Simple indirectly/externally fired gas turbine [Gauthier; 2007]
Traverso et al. (2005) have reported that the inlet temperature for heat exchangers cannot go beyond 800 0C which results in limiting the TIT under 750 0C. Chiaramonti et al. (2004) have reported that, for heat exchangers, even with advanced materials the maximum allowable temperature for the entering flow is 1053 K. In order to get highly efficient EFGT cycles the use of super-alloys has not been recommended as 900 0C is the maximum temperature limit for the materials and therefore use of ceramics based heat exchangers have been seen as a most promising option [Barros and Pericles; 2004].
As regards the advantages of EFGT, it offers fuel flexibility with working fluid as clean air resulting in increased engine lifetime. Diesel, landfill gas, industrial off-gases, ethanol, and bio-based liquids and gases are among the other fuel options in addition to the natural gas [Pilavachi; 2002].
Indirect firing technique also allows the biomass to combust in external combustor with the advantage of biomass usage without employing the complex gasification systems. However, the cycle requires an addition of solid fuel burner and the heat exchanger as compared to standard natural gas based turbine. In this thesis work an external combustor is proposed to fire the producer gas and heat from the combustion gases is extracted by employing the heat exchanger thereby passing the air through it.
Chiaramonti et al. (2004) have investigated on EFGT (100kWel) with fuel sources
of solid biomass and natural gas; fired in external and internal combustion systems respectively. The advantage of keeping the share of natural gas has been reported to maintain the maximum cycle temperature same as for the standard natural gas
9
based turbine for getting good electrical efficiency. The authors have reported a decrease in both electrical power output and electrical efficiency, whereas the possibility of heat recovery at the exhaust increased for the externally fired mode as compared to reference gas turbine cycle.
1.5 Compressor
Compressor is used to increase the pressure of air/gas passing through it. A centrifugal/radial-flow type compressor mainly consists of stationary inlet casing, rotating impeller and the stationary diffuser.
Figure 1.9: Compressor flow path [howstuffworks, 2008]
The air enters into the impeller through inlet casing and the impeller by whirling affect, increases the angular momentum of the air. As a result both static pressure and velocity are increased within the impeller. The compressor can operate over a wide range of pressure ratios, speeds and mass flows at varying efficiencies. These characteristics are represented by what is called compressor maps, which is a graph between absolute pressure ratio versus the mass flow rate thereby describing various characteristics including efficiency, speed lines, surge phenomenon and choke line (Figure 1.10).
10
Figure 1.10: Compressor Map [Garrett by Honeywall, Turbo Tech 103(Expert)] [Available at URL < http://www.turbobygarrett.com/turbobygarrett/tech_center/turbo_tech103.html>(
accessed May 2009)]
Pressure ratio is the ratio between the absolute inlet pressure and the absolute outlet pressure. Higher speed of the compressor results in increased mass flow and the pressure ratio. Choking is the condition where the flow reaches the sonic conditions resulting in no further increase in mass flow and rapid increase of compressor speed.
For a certain speed line within the operating range the pressure ratio increases with decrease in the mass flow (Figure 1.11). With further decrease in mass flow, a point reaches where the flow instability occurs resulting in stall and surge phenomenon to take place, which is self oscillation of discharge pressure and flow rate including reversal of flow through the compressor by drop in pressure. Longer operation within the surge condition may lead to severe and premature compressor’s failure.
11
Figure 1.11: Compressor Operating Point [Available at URL<
http://www.cheresources.com/compressor_surging_under_control.shtml>(accessed May 2009)]
Surge occurs due to the unmatched flow conditions; downstream of the compressor, with the current compressor operating point. The surge may also occur if throttle is quickly closed after the boosting. In this case mass flow reduces very rapidly regardless of compressor still working and boosting, which results in driving the operating point to the far left of the compressor map into the surge. A flow reversal takes place thereby also decreasing pressure downstream of the compressor. A stable operating point is again reached after decrease in compressor rotational speed and pressure downstream of the compressor and this completes a surge cycle (Figure 1.12). For single stage compressors with pressure ratio of less than 2 the surge usually initiates in diffuser section whereas surge is usually initiated in the inducer section for single-stage compressors with pressure ratio more than 3 [Boyce and Meherwan; 2007].
Figure 1.12: Compressor Surge Phenomenon [Available at URL<
http://www.cheresources.com/compressor_surging_under_control.shtml>(accessed May 2009)]
12
Surge is avoided by using either the Blow-Off Valves (BOV) or bypass valves. BOV, vents the intake pressure to the atmosphere resulting in smooth decrease in mass flow whereas bypass valve allows recirculation of air through the compressor to keep compressor out of surge [Garrett by Honeywall; accessed May 2009].
Compressor operating range can be widened (Figure 1.13) by use of Ported Shroud (Figure 1.14) incorporated in the compressor housing thereby allowing some air flow to exit from the wheel to avoid surge to occur but with little negative impact on compressor efficiency [Garrett by Honeywall; accessed May 2009].
Figure 1.13: Shift of Surge line by use of Ported Shroud [Garrett by Honeywall, Turbo Tech 103(Expert)][Available at URL<
http://www.turbobygarrett.com/turbobygarrett/tech_center/turbo_tech103.html>(accessed May 2009)]
13
Figure 1.14: A Ported Shroud Compressor
[Garrett by Honeywall, Turbo Tech 103(Expert)][Available at URL<
http://www.turbobygarrett.com/turbobygarrett/tech_center/turbo_tech103.html>(accessed May 2009)]
Related to Biomass Integrated Gasification Gas Turbine (BIGGT); Barros and Pericles(2004) have reported that change in mass balance between the compressor and the turbine causes the pressure ratio to rise which leads towards compressor to surge, therefore, making it necessary to use the bleed valves and/or variable inlet guide vanes or redesigning the turbine nozzle guide vanes. Matteo et al. (2008) have reported that the use of low heating contents gas causes a larger flow to pass through the gas turbine, leading to an increase of the compression ratio with risk of surge.
1.6 Regenerator
The heat energy from the hot gases coming from the exit of the turbine is recovered in the heat exchanger. The heat exchangers are normally of primary surface counter flow type to better recover the heat. The air out of the compressor has lower temperature than the turbine exit gases. Both streams are allowed to pass through the heat exchanger. After this heat recovery unit the temperature of exhaust gases decreases whereas the temperature of air is increased. The hot air is then fed into the combustor for the combustion to take place mixed with the fuel. High temperature air consumes less fuel as compared to low temperature air for the same power output from the combustor, so benefit of higher efficiency is achieved through employing the regenerator (Figure 1.15).
14
Figure 1.15: Regenerative Gas Turbine Cycle [Available at
URLhttp://www.cospp.com/display_article/273000/122/ARTCL/none/TECHS/1/Gas-turbine-efficiency/(accessed March 2009)]
Without the regenerator, MGT have only 15%-20% efficiency whereas employing this component efficiency up to 30-40% can be achieved depending upon the effectiveness of the regenerator [Kang and McKeirnan; 2003]. However, additional cost has to bear in mind for increase of cycle efficiency. Another important factor of consideration, while employing the regenerator, is the lowering of specific power output as a result of additional pressure drop across the regenerator.
Shih et al. (2006) have analyzed the effect of recuperator on the cycle performance for an MGT with power output of 9.3kW in recuperated mode. The authors have reported an increase of thermal efficiency from 12.1% for simple cycle to 19% for the recuperated cycle. The authors’ results are summarized below (Table 1.1);
Pressure drop across the recuperator (%) Efficiency of recuperator (%) Thermal efficiency (%) 10 85 19 less than 5 90 28 over 15 85 12
Table 1.1: Effect on cycle performance with varying pressure drop and recuperator efficiency [Shih et al; 2006].
The pressure drop across the recuperator is very critical to the cycle performance. Shih et al. (2006) have reported a thermal efficiency lower than 12% for recuperator efficiency of 85% with pressure drop of more than 15% across the recuperator. This efficiency is even lower than the simple cycle efficiency of 12.1% The graph below (Figure 1.16) illustrates the role of recuperator on the overall performance of the cycle, wherein thermal efficiency of the cycle increases with increase of recuperative effectiveness and decrease in pressure drop across the recuperator.
15
Figure 1.16: The influence of the recuperator performance on the thermal efficiency of the cycle [Shih et al; 2006]
1.7 Combustion
1.7.1 Micro-Combustor Challenges
Like conventional gas turbine combustors, the functional requirements for micro scale combustors include efficient conversion of chemical energy to fluid thermal and kinetic energy with low pressure loss, reliable ignition and wide flammability limits. However, inadequate residence time for complete combustion and higher heat transfer rates from the combustor are the main constraints for micro combustors [Spadaccini et al; 2002]. Designing of recirculation zones for ignition and flame stability are important factors for micro combustors as the large recirculation zones or the designs which do not initiate reactions in all portions of the flow give reduced power density. It is important to complete the combustion process within shorter combustor through-flow time. Damköhler number provides the relation for residence time and the characteristic chemical reaction as under [Spadaccini et al; 2002]; reaction residence h Da τ τ = (1.1)
For the complete combustion to take place the residence time must be greater than the chemical reaction time. Whereas the characteristic combustor residence time in terms of bulk flows through the combustor volume is presented by the relation [Spadaccini et al; 2002];
16 RT m VP rate flow volumetric volume residence ≈ = _ _ τ (1.2)
The authors have reported that the residence time can be increased by increasing the size of the chamber, reducing the mass flow rate or increasing the operating pressure. Chemical reaction time is primarily a function of fuel properties and the mixture temperature and pressure. To achieve high power density in micro combustor, high mass flow rate is needed through small chamber volumes. Therefore, in order to get the complete combustion without compromising the power density of the combustor for a given operating pressure thus the density and assuming Damköhler number of unity, the only available option is to reduce the chemical reaction time thus the required residence time [Spadaccini et al; 2002].
1.7.2 Combustion of Low LHV Fuels
Due to increased interest towards integration of power generation systems with gasification processes for utilization of biomass, coal or tars, the need for robust, low emission gas turbine combustion systems for syngas is rapidly growing.
Syngas normally contains hydrogen, carbon monoxide and diluents such as nitrogen with varying chemical composition based on feedstock (e.g. biomass, coal or tar) and the employed gasification technique. The combustion properties of sysgas are generally dependent on H2 and CO contents. Sysgas fuels combustion
using low emissions techniques like lean premixed combustion is, however, challenging due to the difficulty in achieving the sufficient mixing of fuel and air before the combustion [Daniele et al; 2008].
Also too low flame temperature and the excessive fuel flow rate impose the problems for combustion of low heating contents fuels. The alternative fuels have relatively more carbon contents than the natural gas which leads to an inefficient combustion development thus giving increased CO production [Tuccillo and Cameretti; 2005].
Daniele et al. (2008) have investigated on Lean Premixed combustion of undiluted syngas; NOx emissions and Lean Blow Out (LBO) limits. Their work focused on studying the properties of four various mixtures of syngas; derived from coal, refinery residues, biomass and co-firing of syngas with natural gas. The authors have reported about zero CO emissions apart from very lean conditions close to the LBO, which is due to low flame temperature with residence time too short for complete oxidation of CO at lower equivalence ratios close to LBO and higher probability of local extinction events. Towards NOx emissions pure syngas mixtures presents more NOx emissions as compared to the CH4 containing
mixture. The residence time for pure syngas mixture has been found more than double as compared to the CH4 containing mixture. The results showed that higher
the H2 contents in the fuel mixture the leaner the equivalence ratio for LBO flame
extinction to occur. This difference is due to the higher laminar flame speeds of hydrogen (H2) compared to CH4. NOx emissions have been found exponentially
17
1.7.3 Gas Turbine Combustor Configurations
Today various combustion schemes exist to achieve an appropriate and wide range ignition with higher combustion efficiency and reduced soot and polluting gases. The new combustion techniques target at low thermal NOx with lower combustion temperature and low CO due to relatively large residence times and minimum cooling air requirements [Tuccillo and Cameretti; 2005]. Available combustion concepts include:
1.7.3.1 Combustion Separated Zones
In this combustion approach separate combustion zones, each with its own separate supply of well-mixed fuel and air is employed to optimize the combustion performance. For example “staged combustor” is employed (Figure 1.17) wherein primary combustion zone operates at low power and equivalence ratio of around 0.8 to get higher combustion efficiency and minimize the production of CO and unburned HC [Tuccillo and Cameretti; 2005]. The primary combustion zone is responsible for high temperature combustion and acts as a pilot source for the main combustion zone downstream, where premixed fuel-air mixture is supplied.
Figure 1.17: Staged Annular Combustor[Tuccillo and Cameretti; 2005] 1.7.3.2 Catalytic Combustion
Towards low NOx emissions, catalytic combustor is an important scheme, wherein the fuel is pre-vaporized (if liquid) and premixed with air at low equivalence ratio and allowed to pass through a catalytic reactor bed. It results in lean mixture combustion with low NOx production due to lower temperature [Tuccillo and Cameretti; 2005]. One of the main developments related to the combustion is the catalytic combustor, which is effective way to reduce the pollutants emissions (NOx and CO) which also provides efficient use of lower heating contents biomass based fuels [Pilavachi; 2002]. In catalytic combustion which is a flameless process, the fuel oxidation takes place at temperature below 1700 0F thus causing low NOx production [Energy Nexus Group; 2002].
18 1.7.3.3 Engine size
Engine size is very critical for a combustor design. For small engines with higher shaft speeds the combustor employed is normally the short of annular reverse-flow type (Figure 1.18) with the main advantage of better utilization of combustion volume and easy maintenance [Tuccillo and Cameretti; 2005].
Figure 1.18: Small Engine’s Reverse-Flow Combustor [Tuccillo and Cameretti;. 2005] 1.7.3.4 Lean Premixed-Prevaporized (LPP) combustion
In lean premixed-prevaporized (LPP) combustion, vaporized fuel (if liquid) is premixed with air before combustion (Figure 1.19). Lean combustion takes place in the primary zone with low reaction temperature thus reducing NOx emissions. A piloting device sometimes becomes necessary to facilitate ignition and sustain combustion at all operating conditions especially at part load conditions which may result in inefficient combustion. Lean-premixed combustion is usually employed for gaseous-fuelled dry-low-NOx (DLN) type combustors (Figure 1.20) [Tuccillo and Cameretti; 2005].
19
Figure 1.19: Lean Premixed Pre-vaporized Combustion Configurations [Tuccillo and Cameretti; 2005]
Figure 1.20: Mechanism of DLN (Dry-Low-NOx) Pre-mixed Combustion scheme [Tuccillo and Cameretti; 2005]
1.7.3.5 Lean Premixed Combustion
Lean premixed combustion has been seen as a favored method for low emission power generation for natural gas based stationary gas turbines. Continued stronger restrictions on NOx emissions from gas turbines require the prompt attention for exploiting this combustion technique to its maximum benefit [Daniele et al; 2008].
20
Towards low NOx combustion, lean premix combustion technique was developed in 1978 with the concept of separate mixing of fuel and air before combustion to take place.
1.7.3.5.1 EV Premix Combustor for Syngas Combustion
For low heating contents gases like syngas it is more important to employ an appropriate injection method since injection of these gases with air inlet slots is no longer feasible due to the higher flame velocities of hydrogen containing fuels and the higher volumetric flow rate, which would distort the incoming air profile. To tackle with this problem fuel injection is made radially inward through a number of circular holes close to the burner end, enabling safe operation of the burner even with high hydrogen content fuels (Figure 1.21) [Döbbeling et al; 2005].
Figure 1.21: EV burner for syngas combustion [Döbbeling et al; 2005]
1.7.3.5.2 Annular Premix Combustor
In the Annular Premix Combustor with intelligent burners’ arrangement it is possible to improve the cross-ignition, the part load stability, the mixing and turbine inlet temperature profile. Also this burner provides the closed loop liner cooling system with all liner cooling air fed back to the air coming from the compressor which is in line with the fact that the maximum benefit of low NOx premix systems can be exploited if the combustor cooling air is redirected back to the premix burner inflow [Döbbeling et al; 2005].
Annular premixed combustor has multi burner arrangement distributed along the circumference with the following several advantages which comes from the communication between the neighboring burners in the circumferential direction;
i) Burner to burner cross ignition without any cross firing tubes.
ii) Excellent part and full load operation with burners running at different flame temperatures or even with some burners switched off. Burners are stabilized by the neighboring burners.
21 1.7.3.5.3 Sequential Combustion Technology
To achieve the low NOx combustion, sequential combustion technology was started in 1990. In this technique the compressed air is first heated in the first combustor (EV combustor) and with partial fuel addition (60% of fuel at full load) the combustion gases are allowed to expand through the first turbine stage. The remaining fuel is added in a second combustion chamber to get the gas heated again to the maximum turbine inlet temperature (Figure 1.22). Thermodynamic cycle for the sequential combustion process is presented in comparison with the conventional cycle (Figure 1.23) wherein it is seen that the same power output is achieved by keeping the temperature lower as compared to the conventional cycle [Döbbeling et al; 2005].
Figure 1.22: Sequential gas turbine combustion technique [Döbbeling et al; 2005]
Figure 1.23: Thermodynamic cycle for the sequential combustion process versus the conventional combustion process [Döbbeling et al; 2005]
1.7.3.6 Rich Burn- Quick Mix-Lean Burn (RQL) Combustor
The RQL (Rich burn-quick mix-lean burn) is a technique which burns the fuel far above the stoichiometric conditions in the first part of the combustor (rich zone) in order to avoid the production of thermal NOx. The CO and unburned HC produced
22
in the rich zone are oxidized in the downstream lean zone at low temperatures (Figure 1.24). This transition from fuel-rich to fuel-lean combustion is achieved through employing air jets which dilute the mixture in the second region (quick mix or quench zone)[Tuccillo and Cameretti; 2005].
Figure 1.24: Air and Fuel Flow Paths in a RQL type Combustor [Tuccillo and Cameretti; 2005]
1.7.4 Micro Gas Turbine Combustors
1.7.4.1 The Annular Combustor Scaled for MGT applications
Originated from aero-derivative gas turbines, and have had demonstrated the capabilities to adapt to different conditions like water or steam injection, shift from the diffusive to the lean-premixed operation, fuelling with different mixtures etc. Tuccillo and Cameretti(2005) have reported a satisfactory behavior of the combustor when supplied with hydrogenated fuels or when operated with variable inlet conditions. The authors are of the view that the combustor can operate satisfactorily when supplied with bio-mass or solid-waste derived fuels. However, resizing of the original combustor is needed in order to fit for particular MGT applications. The Figure 1.25, presents an example of downscaling of the inlet flow areas with preservation of the axial length [Tuccillo and Cameretti; 2005].
Figure 1.25: The schematic of the full size and the scaled annular combustor [Tuccillo and Cameretti; 2005]
23 1.7.4.2 The Lean-Premixed Combustor
Since the thermal NOx formation is a function of both the local temperatures within the flame and the residence time, therefore, in order to reduce the NOx emissions, the focus of combustion improvements have been mainly at lowering the flame local temperature using lean fuel/air mixtures thus avoiding the creation of high local temperatures or “hot spots”. Lean premixed also called dry low NOx (DLN) combustion has been developed combusting lean fuel/air mixture to avoid production of hot spots. However, DLN requires especially designed mixing chambers and mixture inlet zones to avoid flashback of the flame [Tuccillo and Cameretti; 2005].
A typical example is a tubular type chamber (Figure 1.26 and Figure 1.27). A complete fuel and air mixing is done before the combustion to take place. Primary zone operates at lean composition resulting in low reaction temperatures and the elimination of hot spots thus reducing the NOx emissions. However, mixture flammability and self-ignitions are the main difficulties to address with this chamber, which necessitates the use of pilot stoichiometric flame for the mixture ignition.
Figure 1.26: Overview of the whole Lean-Premixed Combustor [Tuccillo and Cameretti; 2005]
Figure 1.27: Axial development of the Lean-Premixed Combustor [Tuccillo and Cameretti; 2005]
24
1.7.4.3 Rich Burn- Quick Quench-Lean Burn (RQL) Combustor
The rich burn-quick quench and lean-burn (RQL) combustor (Figure 1.28) is characterized by having effective and wide operating range for various fuel/air mixing ratios and inlet air temperature while simultaneously having reduced nitric oxides production [Tuccillo and Cameretti; 2005].
In order to limit the high temperature and the oxygen availability which are responsible for NOx production, the fuel is burnt far above the stoichiometric conditions in the first stage of the combustor (rich zone). The CO and unburned HC produced in the rich zone are oxidized in the downstream lean zone at low temperatures. This transition from fuel-rich to fuel-lean combustion is achieved through employing air jets to dilute the mixture in the second region (quick mix or quench zone) [Tuccillo and Cameretti; 2005].
Figure 1.28: Schematic of RQL Combustor [Tuccillo and Cameretti; 2005] 1.7.4.4 Comparison between the Combustors for MGT
While making comparison between RQL combustor and LP combustor; Tuccillo and Cameretti(2005) have concluded that the later type should give lower NOx formation but could encounter problems related to auto-ignition while the former type have more effective response related to auto-ignitions. The authors have also reported the results of CFD campaign for all three types of combustors presented above. Few of the authors’ conclusions are presented hereunder;
i) Annular combustor has been more effective in terms of combustion efficiency but the NOx production is higher than in the lean-premixed chamber.
ii) Annular combustor exhibits an adequate uniformity of temperature distribution at the combustor outlet as compared to LP and RQL combustor.
iii) Both the LP and the annular type chambers exhibit more regular fuel consumption and lower CO production.
iv) A more progressive behavior of axial trends of the temperature and NOx values has been observed in the LP combustor with a smoother decrease to the final levels.
25
Also from the CFD results Tuccillo and Cameretti (2005) have concluded that LP combustor can more properly fit into the combustion requirements for MGT at almost all operating conditions for both conventional and alternative fuels with acceptable levels of pollutant species. Even at the part load operations the LP combustor work effectively although with some increase of pollutants takes place mainly because of the stronger contribution of the pilot line needed to sustain the pre-mixed flame.
Although catalytic combustion has achieved single-digit NOx ppm levels but could not give combustion systems with suitable operating durability. Although catalytic combustion can be applied for MGTs, however, in the presence of low emission dry-low-NOx (DLN) combustors, suitable for MGTs at current operating temperature ranges, it is hard to expect that catalytic combustion will be pursued in the near term for MGT applications[Energy Nexus Group; 2002].
In this thesis work calculations for combustor have been performed based on LP combustion concept with air and fuel premixed before they are fed into the combustor.
1.8 Emissions
All MGTs employ lean premixed (DLN) combustor technology and have the potential for extremely low emissions [Energy Nexus Group; 2002]. The primary emissions form MGTs are oxides of nitrogen (NOx), carbon monoxide (CO) and unburned hydrocarbons also having a negligible amount of SO2. NOx is a mixture
of mostly NO and NO2 in variable composition and is formed by three
mechanisms: thermal NOx, prompt NOx and fuel-bound NOx. Thermal NOx is the most associated mechanism with gas turbines, which is the fixation of atmospheric oxygen and nitrogen occurring at high combustion temperatures.
CO and unburned hydrocarbons are the result of incomplete combustion process. CO production results from insufficient residence time at high temperature. CO emissions also vary with operation loads as for example low loads operating conditions give incomplete combustion and thus a source of increased CO production.
NOx emissions below 9 ppmv at 15% of O2 have already been achieved utilizing
lean premixed combustion technology in MGTs at full power mode [Energy Nexus Group; 2002].
1.9 Generator and Power Electronics
MGTs may consist of two-shaft models with separate expansion and power turbines to drive the compressor and the generator respectively. In two-shaft version, the generator is connected to the power turbine through a gearbox to produce power at 60 Hz or 50 Hz. Single-shaft models normally have speeds over 60000rpm and generate high frequency electrical power in the form of alternating current (AC). The power is rectified to direct current (DC) and then inverted to a frequency of 60 hertz (Hz); United States market applications. MGTs units are also

![Figure 1.10: Compressor Map [Garrett by Honeywall, Turbo Tech 103(Expert)] [Available at URL < http://www.turbobygarrett.com/turbobygarrett/tech_center/turbo_tech103.html>(](https://thumb-eu.123doks.com/thumbv2/5dokorg/5427383.139897/26.892.185.713.105.724/figure-compressor-garrett-honeywall-expert-available-turbobygarrett-turbobygarrett.webp)
![Figure 1.13: Shift of Surge line by use of Ported Shroud [Garrett by Honeywall, Turbo Tech 103(Expert)][Available at URL<](https://thumb-eu.123doks.com/thumbv2/5dokorg/5427383.139897/28.892.125.769.339.739/figure-shift-ported-shroud-garrett-honeywall-expert-available.webp)
![Figure 1.16: The influence of the recuperator performance on the thermal efficiency of the cycle [Shih et al; 2006]](https://thumb-eu.123doks.com/thumbv2/5dokorg/5427383.139897/31.892.144.757.126.575/figure-influence-recuperator-performance-thermal-efficiency-cycle-shih.webp)