I
N T E R N A T I O N E L L AH
A N D E L S H Ö G S K O L A NHÖGSKOLAN I JÖNKÖPING
N e w s i g n i f i c a n t p l a y e r i n
t h e o i l m a r k e t
What is the response on China’s oil consumption from changes in oil
price and income growth?
Filosofie Magisteruppsats inom Nationalekonomi
Författare: Gustav Håkansson
J
Ö N K Ö P I N GI
N T E R N A T I O N A LB
U S I N E S SS
C H O O LJönköping University
N y s i g n i f i k a n t a k t ö r p å
o l j e m a r k n a d e n
Hur påverkas Kinas konsumtion av olja utav förändringar i pris och
ekonomisk tillväxt?
Master Thesis within Economics
Author: Gustav Håkansson
Magisteruppsats inom Nationalekonomi
Titel: Ny signifikant aktör på oljemarknaden, hur påverkas Kinas konsumtion av olja utav förändringar i oljepris och ekonomisk tillväxt?
Författare: Gustav Håkansson
Handledare: Per Olof Bjuggren, Daniel Wiberg
Datum: 2006-02-16
Ämnesord: Efterfrågan på olja, oljekonsumtion, tillväxt, oljepris, Kina
Sammanfattning
I den här studien analyseras hur Kinas konsumtion av olja påverkas av förändringar i oljepris och inkomst. Resultat visar att deras konsumtion av olja i förhållande till BNP per capita är relativt låg samt att deras fordonskoncentration är låg. År 2004 konsumerade Kina 14 procent mindre olja per capita än vad genomsnittligt land gör vid samma BNP per capitanivå. Fordonskoncentration år 2003 var 25 fordon per 1000 invånare, denna studie visar att om de hade haft en genomsnittlig fordonskoncentration skulle denna siffra varit 40 samma sätt till att vara på Deras ovan nämnda relativt låga fordonskoncentration och konsumtion av olja, kan peka mot att en fortsatt konsumtionsökning.
År 2004 var den globala konsumtionen av olja i genomsnitt 81 miljoner fat dagligen (mb/d) och Kinas uppgick till 6.7 mb/d (BPstats1). Ett antal prognoser finns gjorda angående Kinas framtida konsumtion av olja. Enligt EIA2 2005, kommer den att uppgå till 12.3 mb/d år 2020 och enligt IEA3 2005 till 11.2 mb/d år 2020.
Den empiriska undersökningen i denna studie belyser med signifikanta resultat hur Kinas konsumtion av olja påverkas utav pris- och inkomstförändringar. De ekonometriska resultaten i denna studie indikerar att deras konsumtion av olja är mer känslig för inkomst- än prisförändringar. Den långsiktiga inkomstelasticiteten uppmättes i den här studien till 1.317 och den långsiktiga priselasticiteten till -0.633. Med hänvisning till detta och ceteris paribus, kan en inkomstökning på 100 procent över perioden 2005-2020 leda till att Kina år 2020 konsumerar 17.6 mb/d. Således kan prognoserna från EIA (2005) och IEA (2005) vara underestimerade.
De inkomst- och priselasticitet som är estimerade i denna studie konfirmerar Dargay och Gatelys resultat från 1994 att ett mindre utvecklat lands konsumtion av olja påverkas mer av förändringar i inkomst än i pris.
1 British Petroleum’s statistics
2 Energy Information Administration publikation Internatinal Energy Outlook 3 International Energy Agency publikation World Energy Outlook
Master’s Thesis in Economics
Title: China’s Oil Demand, What is the response of oil price changes and income growth?
Author: Gustav Håkansson
Tutor: Per Olof Bjuggren, Daniel Wiberg Date: 2006-02-16
Subject terms: Oil demand, income growth, oil prices, China,
Abstract
In this study, it is analyzed how China’s consumption of oil is affected by changes in oil price and income. The results show that their consumption of oil in relation to GDP per capita is relatively low and that their vehicle concentration is low. In year 2004, China consumed 14 percent less oil per capita than what an average country consumes in the same GDP per capita level. The vehicle concentration in China of 2003 was 25 vehicles per 1000 inhabitants; this study shows that if they have had an average vehicle concentration, this figure should have been 40 vehicles per 1000 inhabitants. China’s above mentioned relatively low vehicle concentration and consumption of oil may point at a prevailed consumption increase of oil.
In year 2004, the global oil consumption was on average 81 million barrel daily (mb/d) and China’s was 6.7 mb/d (BPstats). Some forecasts are done regarding China’s consumption of oil. According to EIA (2005), their consumption will be 12.3 mb/d by 2020 and according to IEA (2005) 11.2 mb/d by 2020.
The empirical analysis of this study enlightens with significant results how China’s oil consumption responds to changes in price and income. The econometric results in this study indicate that their consumption of oil is more responsive to income- than price changes. In the long run, this study estimates the income elasticity to 1.317 and the long run price elasticity to -0.633. With regards to that and ceteris paribus may an income increase of 100 percent over the period 2005-2020 lead to that China by 2020 consume17.6 mb/d. Thus the forecasts of EIA (2005) and IEA (2005) may be underestimated
Those income and price elsticity estimated in this study confirm Darhay and Gatelys (1994) results of 1994 that a less developed country’s oil consumption is to a larger extent affected by changes in income than price.
Innehåll
1
Introduction... 4
1.1 Purpose... 5
1.2 Outline... 5
2
Oil demand factors ... 6
2.1 Economic growth... 6
2.2 Oil price ... 8
2.3 The link between the oil price and GDP ... 10
2.4 The oil price behavior ... 9
2.5 Oil supply and reserves... 11
2.6 Oil substitution... 11
3
Transport- and non-transport oil consumption ... 14
3.1 Vehicle rates ... 15
4
China’s oil consumption ... 17
4.1 Credibility of Chinese statistics... 19
5
Empirical analysis ... 20
5.1 Variables and selected years ...Fel! Bokmärket är inte definierat. 5.2 Hypothesis formulation... 21
5.2.1 Regression results ... 21
5.3 Projections of China’s oil demand ... 22
5.4 Oil consumption per capita... 23
5.5 Vehicle rates ... 25
6
Conclusion and suggestions to further research... 27
Figures
Figure Description Page
1 Projections of world oil consumption by 2020 5 2 Historical trends of World economic
growth and oil demand
6
3 Relationship between China’s GDP per capita growth (USD2004) and per capita demand of oil
7
4 Oil price development for the period 1970-2004 10 5 Development in world energy consumption by
sector
14
6 Percentage sector distribution of China’s energy consumption in 2002
15
7 Vehicle stock projections by region 16 8 Yearly per capita changes in China’s
economic growth (USD 2004) and oil
17
9 China's vehicle stock 1978-2004 18 10 The diversification of China's energy
consumption in 2004
19
11 Average values of oil consumption per year and GDP, expressed in USD 2004
25
12 Average value of GDP and vehicle concentration 26
Tables
Table Description Page
1 Income and price elasticity in UK 9 2 World energy sources’ share and growth 13 3 Doubtful Chineese statistics 19 4 Definitions of variables used in equation 1 20 5 Regression results of equation 1 21 6 Hypothetical growth scenarios of China’s total oil
consumption by 2020
23
7 Comparisons of oil consumption per capita over the period 1970-2004
24
8 Yearly estimations of vehicle concentration in 34 countries
1 Introduction
China’s economy has over the last 15 years had an annual GDP growth of about eight percent (UNstats4) expressed in USD2004. With the world’s largest population and the world’s seventh largest economy, it is indeed an economy to take into consideration when discussing future economic outcomes. An increased GDP is normally followed by a stronger purchasing power. In this case, the results of the economic boom have been an expanded industry and that more Chinese people are possessing cars (Sandklef 2004). A natural outcome of that is that China’s oil demand has strongly increased lately, over the years 1970-2004 the consumption increased with 1100 percent (BPstats). The Chinese consumption of oil may continue to increase, because China has not yet imposed any oil taxes and that the oil price has been subsidized (Sandklef 2005).
Crude oil is the world’s most traded and consumed commodity (Global Security 2005). Therefore, oil prices and oil consumption play a pivotal role for the world’s economic condition. At the time of writing, one is frequently surrounded by news regarding the oil price. High oil prices may slow down world growth and cause new preferences in all cohesions where the use of oil is a necessity (see Hamilton 1983, Morck 1989, Barsky and Kilian 2004). Because of that, it is interesting to identify players and factors that constitute crucial determinants for current and future oil prices. China, with the world’s largest population and a rapid economic growth (UNstats), has on a nation basis become a large oil consumer (BPstats). The thought of the Chinese population possessing cars to a larger extent than at the time of writing, may be of concern with regards to oil price, since China in many articles and reports is held responsible for the last years’ steady increase in oil- demand and prices.
Seen from a relative GDP per capita perspective, the China’s vehicle concentration is undersized. Comparisons in this study show that the Chinese vehicle concentration of 2003 may have been undersized with 37.5 percent. OPEC5 (2004) estimates the rate of vehicle ownership in China by year 2025 to amount 74 per 1000 habitants, or a total vehicle fleet of roughly 100 million
Throughout the literature, economic growth and oil price are frequently used to explain and estimate levels of oil consumption. In 1994, Dargay and Gately analyzed how world oil and energy consumption depends on income growth and oil prices. The 1994 study was based on annual data over the period 1970-1991 and covers 84 countries ranging from low to high income countries. Their results showed that less developed countries are less responsive to oil price movements and more responsive to changes in income. Three years later, in 1997 the same authors analyzed the oil market from a transport perspective. By estimating a vehicle per population ratio as a function of per-capita income, they made projections until 2015 of growth in the car and vehicle stocks.
This thesis briefly describes the situation on the oil market and analyzes the relationship between oil consumption, oil prices and economic growth. Due to the rapid increase in China’s oil consumption, a case study is done to analyze the driving forces behind this increase. Additionally, China is compared to other countries with the intention of indicating a future path of China’s future oil consumption.
4 United Nation’s statistical database
Note: All GDP figures in this study are expressed in USD2004 given by US Department of Labour (www.bls.gov)
1.1 Purpose
To analyse how China’s per capita consumption of oil responds to changes in economic per capita growth and oil prices. In addition, China is from a wealth perspective compared to other countries in order to see if the Chinese are average oil consumers or not.
1.2 Outline
This paper is divided into seven parts. In chapter 2, factors that drive oil consumption are considered. Chapter 3 considers different types of oil consumption. Thereafter, chapter 4 describes the situation in the Chinese oil market. In chapter 5, the oil consumption in China is analyzed to see how oil consumption is affected by changes in economic growth and oil prices. Also, projections of China’s oil consumption until 2020 are done. The final sixth chapter is dedicated to conclusions.
2
Oil demand factors
With the aim of enlightening what drives the oil demand in general, the following chapters consider the most crucial factors. The factors are discussed in by IEA (2003) where all energy sources are regarded, but since oil is the world’s biggest energy supplier with 43 percent of all energy consumption, it is a relevant for oil consumption as well (IEA, Key World Energy Statistics 2004). Moreover Banks (1993) stated “that the oil price sets the tone for the entire energy market, and often in the most direct way”.
2.1
Economic growth
Adnan, Hamel and Brennand (2004) point out that a key driver for future levels of oil demand is the rate of economic growth, which is expected to prevail. It is difficult to predict future oil consumption, but to secure several outcomes, consumption forecasts in the literature are made on different GDP paths. For the reference case with a three per cent world growth, the most well known energy organizations forecast world oil consumption by year 2020 in figure 1.
Projections of world oil demand by 2020
88 90 92 94 96 98 100 102 104 106 108
CGES EIA IEA OPEC SHELL
M ill io n b a rr e ls d a ily
Figure 1 Projections of world oil consumption by 2020, CGES: Centre for Global Energy Studies Source Key World Energy Sources (KWES 2004)
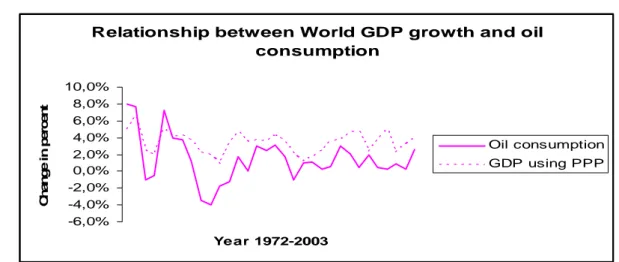
EIA (2004) underlines the relationship between GDP and energy consumption –“The economic development and the standard of living of individuals in a given region strongly influence the link between economic growth and energy demand”. The relationship between world oil demand and world GDP growth is visualized in figure 2.
Relationship between World GDP growth and oil consumption -6,0% -4,0% -2,0% 0,0% 2,0% 4,0% 6,0% 8,0% 10,0% Year 1972-2003 C h ange i n per cent Oil consumption GDP using PPP
Figure 2 Historical trends of World economic growth and oil demand Source: International Energy Outlook (2004)
EIA (2005) considers economic growth to be among the most crucial factors when forecasting future energy consumption and uses therefore GDP growth as the benchmark for future energy demand in their regional forecasts to year 2025.
Dargay and Gately (1994) analyzed the link between economic growth and oil demand, which they specified as the standard way to analyze oil consumption. In a GDP per capita perspective, oil demand in the OECD countries was over the period 1970-1991 less responsive to income growth than Less Developed Countries (LDC). Income increases in LDC correspond to a larger proportional increase in oil consumption than OECD countries do. In turn, income decreases in LDC did not necessarily mean decreased consumption, explained by that at lower stages of economic development; oil is a necessity hard to give up even in times of declining income. Higher levels of income were said to be equal to higher level of technology and alternatives to oil may be more available in OECD countries than in LDC.
The transition from a low- to a high income country is explained with regards to energy consumption: “Economic development is initially accompanied by an increasing energy/income ratio,
which at some point reaches a maximum, and then declines as income continue to increase. In the initial stage, the mechanization of agriculture and the shift from an agrarian economy to an industrial will require larger inputs of energy per unit output. At the same time, larger and larger segments of the society are replacing non-commercial with commercial energy supplies, especially with growing urbanization. During this phase, energy demand increases more rapidly than income. However as the economy continues to grow, the relative importance of heavy industry diminishes, the sector share of services increases, and household energy consumption reaches saturation limits. The energy requirements of increasing income will diminish, so that energy consumption will increase less rapidly than GDP” (p16, Dargay and Gately 1994).
Furthermore, Dargay and Gately stated that the relationship between energy demand and income growth is further explained by the stage of economic development, state of technology, energy endowments and energy pricing policy.
IEA (2003) expects the link between economic growth and energy demand to prevail, but its significance hinges upon future consumption patterns. Besides, overall income growth is expected to be slower than the past century and the developing countries will face the highest growth rates. The current growth in oil consumption will continue but it is likely to slow down in the next fifty years. Largest oil consumption growth will take place in developing countries.
Sandklef (2004) points out that the relation between energy consumption and economic growth are closely linked to each other due to the fact that energy is one of the chief inputs for economic growth along with capital, labor and technology.
In figure 3, the relation between oil demand per capita and economic growth per capita in China is visualized. The trend confirms that they are related to each other, but from a time perspective, one can see that the consumption does not increase immediately when income is growing. Oil consumption seems to need some adjustment time to increse, which will be considered in chapter five. Anyhow, figure 3 gives support to that there is a relationship in China between economic per capita growth and changes in oil consumption per capita.
Re lationship be twe e n China's GDP and oil consumption -30,0% -20,0% -10,0% 0,0% 10,0% 20,0% 30,0% 40,0% Year 1970-2004 Y e ar ly ch an g e
Oil cons um ption GDP (USD2004)
Figure 3 Relationship between China’s GDP per capita growth (USD2004) and per capita demand of oil Source: BP stats, UNstats
2.2 Oil
price
Dargay and Gately 1994 analyzed in the same article as they analyzed income growth, the oil price effects on world energy demand. Their main conclusion was that between oil price and oil consumption is non reversibility among OECD countries but not really among LDC countries. In other words, among OECD countries, an oil price decrease was not compensated by an equal oil consumption increase. In addition, they predicted that a new oil price shock will not cause oil demand to decrease as much as it did in the late 1970’s since it will be difficult to increase efficiency as much as was done in the 1970’s.
In 2004, Dargay analyzed an area close to the relationship between oil price and oil consumption. Dargay analyzed United Kingdom’s car use and possession with regards to fuel prices and income over the period 1976-1995 using a survey of panel data including 7200 households. In the survey, asymmetry was found between the effects of decreasing and increasing income among car- travel and possession. The results in table 1 show how car- use and ownership were affected by changes in income, price of cars and fuel prices. Car traveling is to a larger extent affected by changes in income and fuel prices than car ownership. Changes in fuel prices have a relatively small effect on car travel and car ownership. Dargay explains this by that once a car is purchased; its use becomes a necessity hard to give up. Though he reserves his results with that it would take a “substantial rise in fuel prices to have a significant effect of motoring”, to what level though it does not say. Anyways, the figures show that an increase in fuel price does not necessarily imply a large decrease in fuel consumption, which is also by Dargay is considered as “transport oil consumption”.
Table 1 Income and price elasticity in UK
Variable Car travel asymmetry Car ownership asymmetry Income increase/decrease 1.09/-0.86 0.84/-0.55
Price increase of car purchase -0.46 -0.12 Fuel price increase -0.14 -0.02 Source Dargay 2004
2.3
The oil price behavior
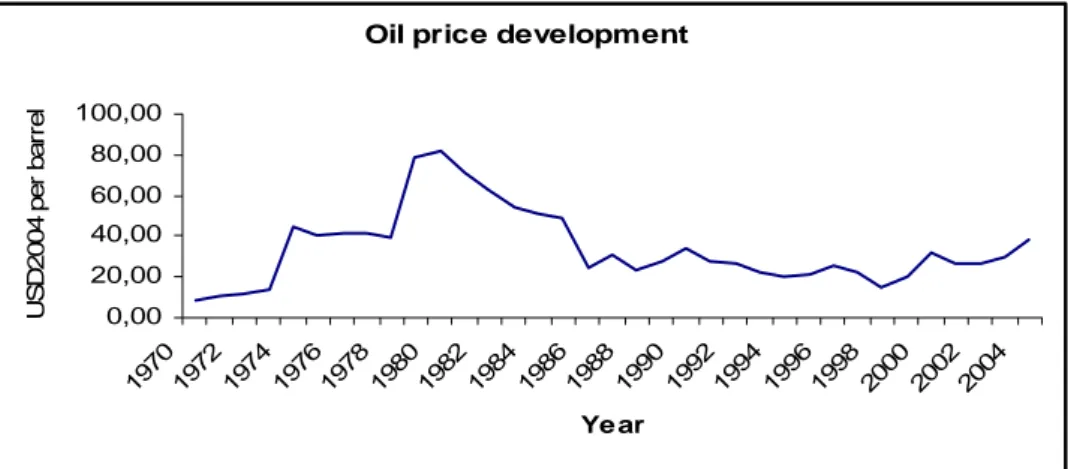
Over the last 35 years, the oil price has been highly volatile, which can be seen below in figure 4. Due to many uncertainties regarding economical outcomes, natural resources and political circumstances, that volatile trend may continue. On the oil market, output may be extended to more than the average production in 2004 81 mb/d (BPstats), but there are forces counteracting an increased production. The OPEC cartel may have that as one of its primary tasks. In the 1970’s, when primarily the US faced an oil demand, that could not be covered by domestic production, OPEC managed to restrict its supply and the world faced an oil price shock in 1973 and then again in 1978. If the cartel did not exist, the member countries could supply oil after their own preferences and the world oil supply would not be regulated. Such a scenario would lead to a more competitive market, which was experienced in the mid 1980’s when the OPEC collapsed and could not control the world oil supply. The OPEC countries of the mid 1980’s, feared a decreased oil price and increased its respective oil supply (beyond OPEC agreements), to ensure payments for their oil. With that outcome, it was no longer possible for OPEC to keep up prices (Carlton and Perloff 2000).
It can be seen in figure 5 that the crude oil price dropped to 24.79 (USD2004) per barrel. One reason for this outcome except for the supply cheating was the high oil prices of the late 1970’s, which was followed by declining oil demand and increased investments with increased production capacity (Carlton and Perloff 2000).
At the time of writing (2005), the oil price is again at historical high levels. Except for the fact that the world’s largest oil consumer USA is yet increasing its consumption as well as other countries have become large consumers. These consumers are mainly developing countries; most of all China, which represented 36.2% of world oil consumption increase in 2004 (BPstats).
Oil price development
0,00 20,00 40,00 60,00 80,00 100,00 1970 1972 19741976 1978 198019821984 198619881990 19921994 1996 199 8 2000 2002 200 4 Ye ar U S D 200 4 per b a rr e l
Figure 4 Oil price development for the period 1970-2004 (USD2004) Source BPstats
IEA and EIA have different opinions about future global oil consumption when considering the reference case with three percent annual growth. Global future oil consumption, will according to IEA (2004) increase annually with 1.6 percent, and by 2020 the consumption is estimated to be 105 mb/d against the average 81 mb/d (BPstats) in 2004. EIA (2004) expects the consumption level by 2020 to 111 mb/d. That is an expected increase on roughly 40 mb/d from the 2004 level and implies that the production has to be increased.
If oil demand increases further and supply is restricted, one may when considering microeconomic theory, expect an upward pressure on oil prices as an answer to a demand increase. Among analysts though, there are different opinions of what the future oil price will be. Energy analyst, Marion Radetzki is one who expects a decreasing oil price. Radetzki (2005) points out that the decreasing production- and extraction costs as well as large reserves will unable a sustained high oil price. Exploitation costs and other investments have over the period 1981-1999 decreased with 75 per cent from 21 to five dollars per barrel simultaneously as the production prices in some regions have decreased with 50 percent from eight to four dollars per barrel (Radezki 2005).
2.4
The link between the oil price and GDP
There is a large body of research done on this topic and conclusions are drawn that there is some correlation between the oil price and GDP growth with the notion that correlation differs significantly between different researches. The literature discusses if the oil price is the engine of economic development or not. In most cases, it is pointed out that GDP is more responsive to oil price increases than decreases.
Barsky and Kilian (2004) analyzed if oil price shocks have been responsible for US recessions since the 1970s. They found that the timing of oil price increases and recessions are consistent with the notion that oil price shocks may contribute to recessions, without necessarily being pivotal.
Hamilton (1983) studied the correlation between oil price shocks and US recessions for the period 1948-1980. He stated that since World War II, all US recessions, except for one, were preceded by oil price shocks. By using an auto regression he found a negative relationship between oil price hikes and recessions. Hamilton’s results indicated a linear relationship between oil prices and GDP growth. Moreover, he rejected that there is a third variable causing both oil price changes and recessions.
Hamilton’s study has been criticized in the sense that it did not cover the years with decreasing oil prices, like the oil price collapse in the mid 1980’s (see figure 5). Therefore, Mork (1989) extended Hamilton’s study into a version including the years up to 1988 and discovered that an oil price decrease did not cause economic expansion. Though, he affirmed that there was a significant relationship of declining GDP in times of rising oil prices, hence a non linear relationship was found.
Abeysinghe (2001) analyzed the rising oil prices’ impact on GDP for the following twelve economies: Indonesia, Malaysia, Philippines, Thailand, Hong Kong, South Korea, Singapore, Taiwan, China, Japan, USA, and the rest of OECD as a group. Abeysinghe used an Auto Regression model and suggested a hypothetic scenario with an oil price increase of 50 percent. The outcome was a long run negative but not strong GDP effect on the entire twelve region’s growth. Notable is that even the oil net exporters Indonesia and Malaysia faced a lower growth. The slowdown in China’s growth was 0.3 percent per year.
Jiménez-Rodrígues and Sanchez (2004) analysed how real GDP growth is affected by oil price shocks growth in OECD countries for the period 1972-2001. In order to pursue the study, they used multivariate vector regressions estimating both linear and non-linear models. The linear approach saying that oil price fluctuations affects GDP growth was rejected since GDP was not as influenced by oil price decreases as by oil price increases. Instead the result with the non-linear model proved more significance. Thus Mork’s (1989) findings were confirmed.
2.5
Oil supply and reserves
IEA estimates in 2003 that there are enough resources to meet the demand oil for the next 50 years. The critical point is if world producers manage to extract it, depending on the pace and direction of technological change and on the environmental concerns. Location of the energy and the accessibility of these are important for the world’s supply. Finally the rate of success of the OPEC cartel will be important for the future oil supply.
EIA 2005 says that there are enough energy resources to cover the expected increase in energy demand until year 2025.
There are different opinions about how long the oil resources may last, according to BPstats, in 2004, the proved reserves were sufficient to cover another 40 years’ consumption at the 2004 oil consumption rate. In BPstats, the findings of new sources are excluded.
To be underlined here is that the world’s supply of oil will never be exhausted. The reason for that is that if supply decreases and ceteris paribus, price will increase until nobody has enough money to buy the last barrel. Of course, this is microeconomic theory and the forecasts above may consider oil consumption to take place at price levels where people can consume oil without going bankrupt.
Worth mentioning though, is that over the last years new oil findings have decreased. In the OPEC, over the decade 1963-1972 it was found about 187 new billion barrels compared to 16 billions over the years 1993-2002 (IEA 2005).
2.6 Oil
substitution
The future oil consumption depends on people’s behavior, but will also to a large extent depend on the rate of environmental concerns from governments. Rate of taxation on energy sources and the number of environment laws will also be crucial. Interventions of these kinds will probably be more common in industrialized countries, where income growth not may be as vulnerable as in developing countries, because of their lower oil dependence. In the EU, energy commitments are already done. In 1998 ACEA (European Automobile Manufacturers Association) and EU agreed that new cars average fuel efficiency must in year 2008 be down to 5.8 litre/100 kilometer. This will result in a daily oil demand decrease by one mb/d by 2020 (Brennand and Rezki 2002).
IEA 2005 points out that persistently higher oil prices will have strong impact on fuel mix and technological change. Alternative resources become with a higher oil price commercially more attractive. This was seen during the two oil price peaks in the 1970’s when many countries reduced their oil consumption.
Dargay and Gately (1994) argues that fuel substitution away from oil is far easier for non-transport than non-transport uses: in space heating, in water heating, and as inputs for industrial
processes and electric power generation. Over the period 1970-1991, it was found that transport oil was less price responsive than non transportation oil demand. This was explained by that oil in the transport sector is yet such a superior fuel, that it does not face much competition. Furthermore fuel switching, which was done in response to the price increases of the 1970’s, but not un-done by the price declines of the 1980’s may have difficulties to be re-done by future oil price recoveries (Dargay and Gately 1994).
Most vehicles today run on oil and Brennand and Rezki (2002) expect the oil share in the transport sector to be constant until 2020.
EIA 2005 expects the use of alternative sources in the transport sector to be relatively modest through 2025.
KWES (2004) expects oil consumption to increase to 121 mb/d by year 2025 and transport oil is the share expected to increase the most. In the non transportation sector on the other hand, oil demand has declined in the OECD countries since the oil crises in the late 1970’s (Dargay and Gately 1994).
One may suspect that today’s high oil demand is affected by a slow energy source substitution in the transport sector along with difficulties in making the oil consumption more efficient. The substitution away from oil may probably be speeded up by compulsions, like the EU efficiency agreement in 1998. With higher oil prices though, incentives to develop new energy sources increase. That is, there will be a large profit for the one that comes up with a competitive vehicle fuel. In figure six below, OPEC estimates the future consumption of oil demand and its substitutes.
Whether and to what extent new energy saving technology will be adopted or not will determine the amount of future energy consumption (IEA 2003). In global electricity consumption, oil will most likely decrease its market share, because of the available alternatives such as nuclear, coal and natural gas (EIA 2004).
The future development of nuclear energy is also to be noted when estimating future energy consumption. According to Brennand and Rezki (2002) the global nuclear energy may not be a pivotal future energy source, they even forecast a decline in global nuclear energy output after 2010. EIA (2003) on the other hand, does for the reference case project global increase in nuclear energy consumption on 0.4 percent annually over the period 2000-2025.
EIA (2003) projects hydro power to grow rapidly in developing countries, most of all in China. Hydropower in the industrialized world is expected to remain constant, because too many sources are already utilized and an expansion is not possible.
Worldwide consumption of natural gas will be almost doubled by 2030, mostly at the expense of coal. Nevertheless, coal will continue to be a key energy source and expects to meet 22 percent of all energy needs in 2030. Around 68 percent of the increase of coal demand is expected to come from China and India. Energy intensity, the amount needed to produce a dollar’s worth of GDP, will continue to decline over the period 2002-2030. This is explained by that the energy efficiency will improve and world economy will rely less on heavy industry. The technical progress may be a factor that preserves the current living standard and at the same time cuts energy consumption (IEA 2004).
Table 2 below shows the diversification on the energy market with forecasts until 2025. OPEC (2002) expects of the energy sources gas to contribute to the fastest consumption increase until 2025.
Table 2 World energy sources’ share and growth
% Growth per year % Fuel share
2000-2010 2010-2020 2020-2025 2000 2010 2020 2025 Oil 1.6 1.8 1.7 40.1 38.7 37.6 36.9 Solids 1.9 2.0 1.8 26.0 25.8 25.5 25.2 Gas 2.9 3.1 3.2 23.3 25.7 28.3 29.9 Hydro/nuclear/ renewable 1.1 0.8 0.7 10.6 9.8 8.6 8.0 Total 1.9 2.1 2.0 100 100 100 100 Source: OPEC (2002), Oil Outlook to 2025
3
Transport- and non-transport oil consumption
Oil consumption is usually divided into different regions and sectors in order to categorize consumption. Two sectors used are transport- and non transport oil consumption. Transport oil is said to be less price responsive than non transport demand of oil. Over the period 1970-1991, world transport oil consumption grew in all regions about as rapidly as income (Dargay and Gately 1994).
Dargay and Gately (1997) analyzed the growth in car and vehicle ownership, explained as a function of per capita income. Transport oil consumption was found to be closely linked with the number of cars and other road vehicles in use, thus projections of future growth in the vehicle stock can provide an insight into future oil consumption. In the same article, demand on transport oil is expected to grow especially rapid amongst low- and middle-income countries outside the OECD until year 2015. These countries will probably face high growth rates and high income elasticity of car and vehicle ownership.
EIA (2004) estimates that of the expected oil consumption of 121 mb/d in year 2025, transport oil is the share expected to increase the most, since alternative energy sources for transport are yet not competitive enough. In opposite to the transport sector, the non transport sector has competitive alternative energy sources such as nuclear, coal and natural gas, which enable the expected decrease in oil consumption by this sector.
IEA (2004) states that oil will face little competition as road-, sea- and air transport fuel. The transport sector is also expected to be the largest contributor to the increased energy consumption over the period 2002-2030.
In number of vehicles, over the period 1970-2000, the world vehicle fleet increased with 309 percent to 803 million vehicles in year 2000 (Adnan, Hamel and Brennand 2004). When comparing energy consumption in figure 5, it is clear that the transport sector has had the strongest consumption increase over the period 1973-2002.
Figure 5 Development in world energy consumption by sector Source: Key World Energy Sources (KWES 2004)
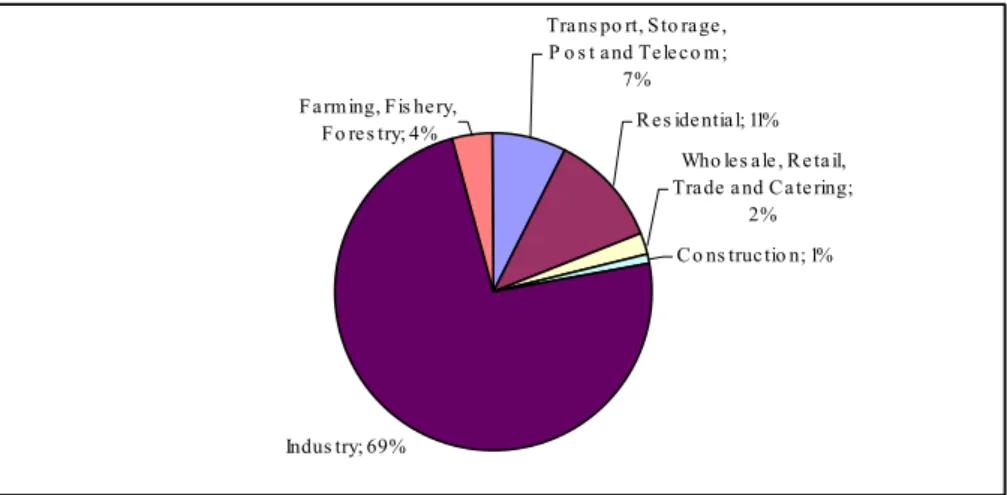
In China 2002, the industry sector contributed to 69 percent of total energy consumption and the transport sector contributed to seven percent. When comparing figure 5 and 6, one can see that China’s transport sector is relatively small. EIA (2004) expects the oil use in China’s transport sector to grow annually with 5.3 percent over the period 2001-2025.
Trans po rt, Sto rage, P o s t a nd Tele co m;
7%
R es ide ntial; 11% Who les ale , Re ta il, Trade a nd Ca te ring;
2% C o ns truc tio n; 1%
Indus try; 69% Farming, Fis hery,
Fo re s try; 4%
Figur 6 Percentage sector distribution of China’s energy consumption in 2002 Source: Sandklef 2004
3.1 Vehicle
rates
In figure 7 below, it is highlighted that the vehicle stock will increase relatively more in the Non-OECD region than in the OECD region until year 2030. As some of the OECD countries reach the level of vehicle saturation, the increase may come from the Non-OECD countries where the vehicle concentration is far from saturation, which is illustrated in figure 7.
Figure 7 Vehicle stock projections by region Source WEO 2004
According to Dargay and Gately (1997), the vehicle saturation is reached when 85 percent of the population possesses a vehicle. Most of the vehicle increase in the Non-OECD countries is expected to come from the highly populated countries, where China is expected to stand for the largest increase. The level of vehicles is said to be dependent on the rate of economic growth.
In 2003, the estimated amount of vehicles in China per 1000 inhabitants was 25 (Sandklef 2004). Seen from a GDP per capita perspective, the Chinese vehicle concentration is relatively low (see chapter 5.5). According to this thesis may a Chinese vehicle concentration of 40 vehicles per 1000 inhabitants be more rational than the given number
of 25. OPEC6 (2004) estimates the rate of vehicle ownership in China by year 2025 to amount 74 per 1000 habitants, or a total vehicle fleet of roughly 100 million
4
China’s oil consumption
Over the period 1970-2004, China’s oil consumption increased with 1097 percent or in per capita terms it increased with 660 percent (BPstats). Over the same period measured in USD2004, China’s GDP increased with 270 percent or in per capita with 135 percent (UNstats). In view of that, China’s oil consumption is increasing faster than its income. When looking at figure 8, the relationship between oil consumption and income growth is confirmed. The trend indicates that the consumption reaction is a bit lagged with regards to income increases. That will be object of discussion in chapter 5.2.
Relationship between China's GDP and oil consumption -30,0% -20,0% -10,0% 0,0% 10,0% 20,0% 30,0% 40,0% Year 1970-2004 Y e a rly c h a n g e Oil consumption GDP (USD2004)
Figure 8 Yearly per capita changes in China’s economic growth (USD 2004) and oil consumption Source: BPstats & UNstats
A crucial growth trigger to China’s strong economic development may be China’s gradual transition from planned economy to market economy. The world’s largest populated country has had a relatively rapid growth and it does not seem to slow down. As globalization is expected to continue, many companies consider moving their production to China in order to utilize China’s low labor cost. Moreover in 2001, China became a member of the WTO. After the WTO membership, China became an even more important player on the world market, since China was opened up for a further integration with the oil market (Kiesow 2004). With regards to the considered situation of China in this chapter, one may suspect a continuing increase in China’s oil consumption.
Over the last years, China’s oil consumption increased very rapidly, certainly in 2004 when China’s increase contributed to 36.2 percent (BPstats) of the World’s total increase in oil consumption. The question is if this was just a temporarily increase or such a pattern may be expected over the coming years as well. In chapter 5.4, China will be compared with other countries to see if they on average are small consumers.
According to IEA (2005), China’s oil demand will rise from 6.7 mb/d to 11.2 mb/d over the period 2004-2020 and EIA (2005) expects their oil demand to be 12.3 mb/d by 2020. The crucial factor in both cases for how China’s oil consumption will develop is their economic growth. Besides, IEA (2003) expects the oil use in the Chinese transport sector to grow annually with 5.3 percent over the period 2001-2025.
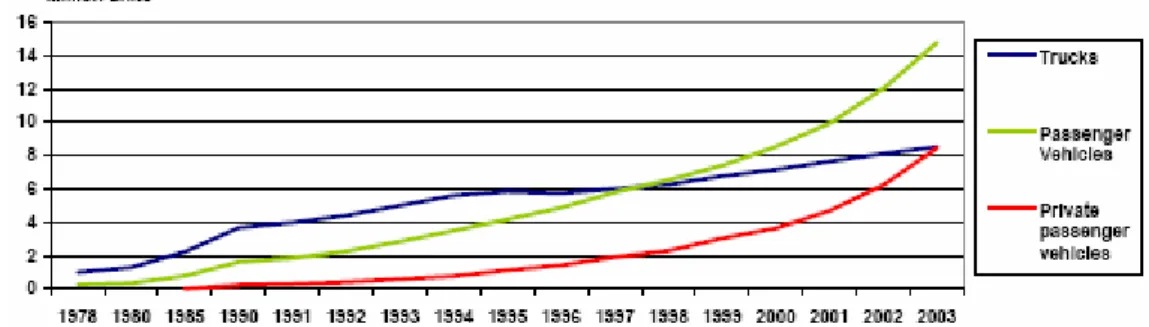
“Today” the Chinese industry account for 69 percent of total oil consumption and the Chinese transport sector in turn, accounted for 10 percent in 1978 and 25 percent in 2002 (Sandklef 2004). A benchmark to that is that the world transport sector in 2002 consumed 57.2 percent of world oil consumption (KWES 2004). Remarkable is that in 2003, annual car sales in China increased with 75 percent. In 2004, the car concentration was 20 cars per
1000 Chinese compared with the global average of 120 cars per 1000 inhabitants (Sandklef 2004). Figure 9 below shows how China’s vehicle park has developed over the years 1978-2004.
Over the period 1970-1992, vehicles per capita in China increased on average with eleven percent annually. If this growth rate would increase to 16 percent, China’s vehicle stock may even surpass the US vehicle stock by 2015 (Dargay and Gately 1997).
EIA (2005) states that the number of cars in China is increasing with 20 percent annually. Thus if vehicle growth continues at this rate it may be the world’s largest car and vehicle market by 2015.
Figure 9 China's vehicle stock 1978-2004 Source: Sandklef (2004)
China’s energy consumption is relatively high in the industry sector, mainly due to their high coal consumption (an inefficient energy source), but also because of their relatively low fixed price on oil and coal. Fixed prices on energy is a residue of the plan economy which leads to wasteful energy use. In addition, their vehicle park is not very fuel efficient and consumes 10-20 percent more petroleum per vehicle than average vehicles in developed countries do. In 2003-2004, China experienced energy shortages followed by an expansion of the energy sector implementation of macroeconomic controls to decrease investments in energy intensive industries. The expansion of the energy sector has been focused on expanding the use of coal (Sandklef 2004). In 2005, Sandklef also underlined that the oil price in China is subsidized by the government and that may be an explanation of the rapid increase in oil consumption.
Kiesow (2004) believes that China’s main energy source for the foreseeable future will continue to be coal and it would be possible since their reserves can cover its present consumption for another 1000 years (BP). China’s energy consumption spread is depicted in figure 10 below.
China's energy consumption 2004 0 0,1 0,2 0,3 0,4 0,5 0,6 0,7 0,8
Oil Gas Coal Nuclear Hydro
Energy source C o n s um p ti on shar e
Figure 10 The diversification of China's energy consumption in 2004 Source: BPstats
4.1
Credibility of Chinese statistics
To protect this study against criticism regarding unreliable data, this chapter shows that the author is aware of the problems with Chinese statistics.
In research about China one may be careful about drawing conclusion from results based on Chinese data because of the fact that China during many years has been a plan economy. Since 1978, China has been undergoing a gradual process of transition from a centrally planned economy to an economy where resources are allocated primarily through the market mechanism (Mina and Perkin 2001).
Given that China not yet may be a total market economy, the state has among other things, the possibility to control statistical figures about the country’s economic wellbeing. This is mainly done by the state ruled “National Bureau of Statistics” (Rawski 2001).
Rawski pointed out some shortcomings of the Chinese statistics. Over the years 1997-2001, inconsistency was found among the Chinese growth data reported. In comparison with other countries, China had in some areas an unlikely development in relation to their economic development. To illuminate, a comparison with other countries with equal economic development was made, which can be seen in table 3. With an economic growth on 34.5 percent over the period 1997-2001, it is according to most other growth cases, doubtful to have a negative growth in energy consumption and consumer prices as the case of China. The ten years before 1997, China had substantial GDP growth rates, which coincided with increased energy use, higher employment and rising consumer prices (Rawski 2001). Furthermore, the Chinese energy sector is not considered as an efficient one (Sandklef 2004). In 1998, the Chinese “total efficiency of energy conversion” was no better than in 1983 (Rawski 2001). What also contradicts a decreased energy use is that the vehicle fleet, as well as the oil and coal consumption has increased steadily over 1997-2001.
Table 3 Doubtful Chineese statistics
Episodes of Growth in Asian Economies 1957-2001 (cumulative change in percent)
Change in: Japan 1957-1961 Taiwan 1967-71 Korea 1977-81 China 1987-91 China 1997-2001
Real GDP Official 52.8 49.7 21.6 31.8 34.5 Energy Consumption 40.1 85.2 33.6 19.8 -5.5 Employment 4.6 17.0 9.4 23.2 0.8 Consumer prices 10.6 20.6 111.7 46.6 -2.3 Source: Rawski 2001
5 Empirical
analysis
In order to analyse what drives China’s oil consumption, an Ordinary Least Square (OLS) regression is run. The OLS regression is supposed to explain how oil price and GDP per capita affect China’s per capita consumption of oil. Furthermore, with the aim of giving a hint about how China is consuming oil, a comparison to other countries is done. The comparison shows from a GDP per capita perspective how China is consuming oil. The same type of comparison is also done for the vehicle possession to further indicate if the Chinese population possesses cars in a relatively large extension or not. All values are measured in USD2004.
In chapter two, it is discussed that oil consumption is driven and explained by different variables of different significance levels. In this analysis two variables are included; price and income. Total world oil supply would be useful to include, but is excluded due to lack of appropriate data. Besides, the oil supply differences are obtained by the price and including supply may lead to multicollinearity. Oil reserves are also excluded because of a too large uncertainty in the statistics.
Of the variables (see table 4), GDP is said to be the most significant variable in earlier research and is included in the regression. Furthermore a lagged variable is included to see how much of the previous year’s change in oil consumption that explains the current year’s change in oil consumption. The lagged consumption per capita is included because there is an adjustment need in time series analysis (Ramanathan 2002). That is, it takes time for people to react on changes in their consumer preferences, in this analysis with regards to changes prices and income. All variables are expressed in logs to get hold of elasticity. The variables used in this thesis are the same as Dargay and Gately used in 1994 and 2001. For the model, the time period 1970-2004 is analyzed; a longer historical time period is disregarded because of statistical inconsistency.
Table 4 Definitions of variables used in equation 1
αt: Intercept at time t
Consumption/Popt Barrels of yearly oil consumption per capita at time t
GDPt/Popt: GDP per capita at time t
Pricet: Average oil price at time t
θ Consumptiont-1/Popt-1: Barrels of yearly oil consumption per capita at time t-1
ε t: Error term at time t
The model used in the analysis is a Koyck-lag model and is identical to the one used by Dargay and Gately (1994) and by Gately and Huntington (2001). Implicitly this model assumes perfect reversibility, thus a price increase will lead to a consumption decrease and a price decrease will lead to a consumption increase. The Koyck-lag model also assumes income increases to create consumption increases and income decreases to create consumption decreases. Another imperfect reversibility model is used by Dargay and Gately, because according to their study perfect reversibility is not always considerable. Perfect price reversibility is said to be more valid for LDC than OECD countries and the purpose is to analyse China, a LDC, hence the perfect reversible model is applied.
5.1 Hypothesis
formulation
In the Ordinary Least Square regression in equation 1, yearly Chinese per capita consumption is depending on the yearly level of GDP per capita, the yearly average price of a barrel of oil, and a lagged value of consumption per capita.
Equation 1 log (Consumption/Popt) =αt + γ log (GDPt/Popt) + β log (Pricet)+ θ log (Consumptiont-1/Popt-1) + ε t
The null hypothesis represents no effects from the variables on the oil consumption.
H0 : γ , β , θ = 0
H1 : γ , β , θ ≠ 0
In a model where a lagged dependent variable is used as an explanatory variable, the Durbin Watson (D-W) test for autocorrelation is not applicable. Instead, Breusch and Godfrey’s Lagrange Multiplier test (LM) is used (Equation 2) to detect autocorrelation (Ramanathan 2002). Equation 2 below says that if the residual at time t (μt) is affected by
lagged residuals, there is higher order autocorrelation among the residuals. Therefore ρ
needs to be zero to reject the presence of higher order of autocorrelation.
Equation 2 μt =ρ t-1 μ t-1 + ρ t-2 μ t-2 + …. ρ t-n μ t-n + ε t μt: Residual at time t
ρ t-1: Coefficient of autocorrelation at time t-1
ε t: Error term at time t
The null hypothesis represents no higher order of autocorrelation.
H0 : ρ = 0 or seen by that LM > 0.05
H1 : ρ ≠ 0 or seen by that LM < 0.05
5.2 Regression
results
Table 5 Regression results of equation 1
Variables Coefficient t-value
Intercept: α -0.621 (0.313) -1.987
Income: γ 0.137 (0.044) 3.08
Price: ß -0.069 (0.016) -4.41
Lagged consumption: θ 0.896 (0.027) 33.13
Durbin Watson’s test (D-W) 1.647 Lagrange Multiplier test (LM) 0.636
Rate of explanation R2 0.99
Observations (N) 35
Equation 1 is run at the 0.05 level of significance
The results in table 5 from Equation 1 show a significant relationship between economic growth and changes in oil consumption. Income change has a coefficient of 0.137. Changes in oil price are negatively significant with a coefficient of -0.069. The lagged value or the adjustment variable of consumption is also significant with a coefficient of 0.896. Thus the expectations of the perfect reversibility model holds and the significance of the variables of oil consumption are confirmed. When looking at the coefficients, it is to see that most of the changes in oil consumption are explained by changes in the lagged consumption. Accordingly, it takes time for consumption to respond on changes in price and income. At the five percent level of significance, higher order autocorrelation is rejected by the LM test (0.636). The high rate of explanation (R2) may indicate that there are shortcomings with the model. Most likely, it is explained by that it is a time series analysis and that the variables are explained by the time factor and therefore the regression’s rate of explanation increases.
5.3
Projections of China’s oil demand
In order to forecast China’s oil demand, the income and price elasticity are required. These elasticities are obtained below in the same way as Gately and Huntington did in 2001. The figures used those obtained by equation 1 (see table 5).
The long run income elasticity is given by equation 3 where.
γ: Income coefficient
θ: Lagged consumption coefficient
Equation 3 Income elasticity = γ / (1- θ) 0.137 / (1-0.896) = 1.317
The long run price elasticity is given by equation 4
β: Price coefficient
θ: Lagged consumption coefficient
Equation 4 Price elasticity = β / (1- θ) -0.069 / (1-0.896) = - 0.633
As can be seen above, the long run income elasticity estimates 1.317. That is a fictitious situation is assumed; where income increases with 5.0 percent and ceteris paribus, per capita consumption increases with 6.575 percent. The long run price elasticity in turn was estimated to -0.633. For another fictitious situation assumed and ceteris paribus, a price increase with 10.0 percent corresponds to a consumption per capita decrease of 6.33 percent. In order two visualize some hypothetical scenarios; forecasts will be done with regards to the elasticity given from equation 3 and 4. Four different projections of China’s oil demand will be done until 2020 with equation 5.
Equation5 Consumption2004 = ((γ / (1- θ))*∆Income2004-2020 + (ß / (1- θ))*∆Price2004-2020) * Consumption2004
The estimates in Equation 5 are given by the elasticities from equations 3 and 4, the changes in income per capita and in oil price. The projections in table 6 assume four different economic growth and oil price scenarios over the period 2004-2020. All forecasts use the situation of 2004 as a benchmark year. In other words; the oil price of 2004 will be the object of changes in the forecast, likewise for China’s per capita income. Of course, it is not possible to forecast different outcomes of oil price and GDP growth in a credible way,
but it is interesting to apply the model and highlight hypothetical outcomes. A more detailed forecast would be necessary to be able to draw any conclusion about the forecast in the table. Nevertheless Table 6 shows, large increases in consumption may take place if all else is equal beside of the changes in income and price. In the first two cases over the period 2005-2020, a total growth in China of 100 percent is assumed, which corresponds to approximately four percent average growth per year in real terms. A total growth on 150 percent corresponds to an average annual growth of about six percent. To keep it simple, constant population is assumed. Table 6 shows that oil consumption responds more strongly to changes in income than price.
Table 6 Hypothetical growth scenarios of China’s total oil consumption by 2020
Case Growth in GDP per capita
2005-2020 Oil price change 2005-2020 (Million barrels) by 2020 Total daily consumption
1 100 % 0 % 17.604 (6.684)*
2 100 % 100 % 9.160 (6.684)*
3 150 % 0 % 22.006 (6.684)*
4 150 % 150 % 15.669 (6.684)*
Source: BPstats*
Note: Figures in parenthesis represent China’s daily consumption of 2004
In this chapter, a high growth of China’s oil demand is assumed to be a likely outcome. To find some explanations for that, analysis are done in the following sections, where China is compared to other countries in order to find out if their per capita consumption of oil is different from a GDP per capita perspective.
5.4
Oil consumption per capita
In order to verify the econometric results in the previous chapter, China’s oil consumption per capita is compared to other countries7. This may give a hint about if the Chinese are consuming oil on an average level with regards to their GDP. In Equation 6 below, yearly oil consumption per capita is estimated for 56 countries over the years 1970-2004.
Equation 6 Oil Barrels Consumed per Capitat = Consumptiont/ Populationt
The different results of Equation 6 are shown in Table 4 below. Again, a positive relation between oil consumption and GDP is exposed. For the observations at the lowest level of GDP (500-1500 dollars) one can observe the most rapid consumption increase. The following GDP groups do also enhance a consumption growth, however at a lower rate, until a GDP per Capita level of 25000 dollars is reached. At even higher GDP rates, the consumption growth pattern is different. Increasing GDP per capita does thereafter not necessarily mean increased per capita oil consumption. As a benchmark, USA, the world’s largest oil consumer, faced in 1979 at a GDP per capita of 29157 USD2004 decreased per capita consumption of oil, probably as a result of the high oil prices in that year (see figure 6). In 1973, the year of the first oil crisis, eight OECD countries (Finland, France, Japan,
7 Countries compared: Algeria, Argentina, Australia, Austria, Bangladesh, Belgium, Brazil, Bulgaria, Canada,
Czech, Chile, China, Colombia, Denmark, Egypt, Ecuador, Finland, France, Germany, Greece, Hungary, Hong Kong, India, Indonesia, Iran, Ireland, Italy, Japan Kuwait, Malaysia, Mexico, Netherlands, New Zeeland, Norway, Pakistan, Peru, Philippines, Poland, Portugal, Qatar, Romania, Russia, Saudi Arabia, Singapore, Slovakia, South Africa, South Korea, Spain, Sweden, Switzerland, Thailand, Turkey, United Arab Emirate, United Kingdom, United States and Venezuela
Italy, Netherlands, Sweden, Switzerland and United Kingdom) peaked their per capita consumption. It is difficult to conclude that the peak of per Capita consumption of oil takes place at a certain GDP level, though one may conclude that the oil price plays a central role when determining per Capita consumption for OECD countries. Only one less developed country peaked its consumption in 1973, Venezuela.
In 2004, China’s level of per capita oil consumption was 1.898 barrels per year and their GDP per capita was 1283 USD2004 per capita (UNstats). On average Table 7 says that a GDP of 1250 dollars correspond to a consumption of 2.2 barrels per year. Thus the consumption in China is relatively low with regards to their GDP. In other words, China did on average consume about 14 percent less oil than the average country would do at the same level of GDP. For hypothetical purpose, one may with regards to Table 7 assume China after 2004 to consume oil as an “average consumer” and that a GDP per capita level of 1750 dollars will be reached, their oil consumption would in such case increase with approximately 60 percent or around four mb/d to a total consumption of eleven mb/d. Thus at low GDP levels, where China is situated, economic growth seems to be strongly affected by the rate of oil consumption. The comparison in table 7 may give some explanations to the rapid oil consumption growth in China.
Table 7 Comparisons of oil consumption per capita over the period 1970-2004. GDP is expressed in USD2004
Group
GDP Groups Observations Average group GDP
Average consumer of the GDP group: Barrel/Capita % Change Between GDP Groups 1 0-500 45 250 0.3 - 2 500-1000 129 750 0.8 141% 3 1000-1500 83 1250 2.2 167% 4 1500-2000 79 1750 3.1 42% 5 2000-2500 90 2250 3.4 11% 6 2500-5000 353 3750 4.6 35% 7 5000-10000 264 7500 8.2 77% 8 10000-15000 134 12500 14.1 72% 9 15000-20000 140 17500 15.9 13% 10 20000-25000 170 22500 19.6 23% 11 25000-30000 187 27500 17.3 -12% 12 30000-35000 105 32500 19.7 14% 13 35000-40000 50 37500 19.1 -3% 14 40000-45000 27 42500 17.0 -11% 15 45000-50000 5 47500 19.5 15% 16 50000-60000 12 55000 19.9 2% 17 60000-70000 6 65000 23.6 18% 18 70000-80000 3 75000 21.7 -8% Total 1882 10.3
Source: Oil consumption; BPstats & GDP; UNstats
The average consumption of oil from table 7 may be easier visualized in Figure 11, where one can see that the rapid growth take place at low GDP levels and that the peak around 25000 dollars is followed by a weak decrease in consumption. However, the consumption increases again at GDP levels above 60000 USD. At this level though, the low number of observations should be considered.
Total Sample 0,0 5,0 10,0 15,0 20,0 25,0 0 10000 20000 30000 40000 50000 60000 70000 80000 $ GDP per Capita B a rrel s p e r C a p it a
Figure 11 Average values of oil consumption per year and GDP, expressed in USD 2004 Source: BP and UN statistics
5.5 Vehicle
rates
As vehicle concentration is considered to be tightly correlated with both GDP levels and oil consumption by Dargay and Gately (1997), this paper extends the comparison analysis to verify the relation between GDP levels and the vehicle concentration. That may give further explanation to the relatively low oil consumption per capita in China, which was highlighted in the previous section.
In table 8, vehicle concentrations are compared against the GDP levels in the same way as it is done in table 7. The comparison represents 34 different countries8 over the period 1970-2004 and shows average vehicle concentration at different levels of GDP. Vehicle concentration is increasing most rapidly in the range of 1000-1500 USD (group 3), which was the GDP group location of China in year 2003.
In 2003, China had a GDP per capita of 1142 USD2004 (unstats) and 25 vehicles per 1000 inhabitants (Sandklef 2004). According to table 8, that is a relatively low vehicle concentration. This can be seen by that the average number of vehicles per 1000 inhabitants in the GDP group of China in 2003 (group 3), where the average country in that GDP situation has about 44.8 vehicles per 1000 inhabitants. China’s GDP per capita in year 2003 was not 1250 USD as the average GDP in group 3 but 1142 USD, therefore a vehicle concentration of 40 vehicles should be more likely than 44.8 vehicles. In other words, table 8 points out that in terms of income, China’s vehicle concentration is undersized with 37.5 % against the average country. Hence with regards to that, it may be difficult not to expect their vehicle fleet to increase further in the future, which also will drive up oil consumption.
As a benchmark, in 2003, car sales in China increased with 75 percent compared to 2002 (Sandklef 2004), maybe as a response to their relatively low vehicle concentration.
8 Argentina, Australia, Belgium, Bolivia, Bulgary, Brazil, Chile, China, Costa Rica, Colombia, Denmark, Egypt,
France, Germany, Greece, Hong Kong, Hungary, India, Indonesia, Italy, Japan, Malaysia, Netherlands, Poland, Portugal, Romania, Russia, Thailand, Turkey, Tunisia, South Korea, Spain, Sweden, United Kingdom and United States
Table 8 Yearly estimations of vehicle concentration in 34 countries over the period 1970-2004 compared to their GDP per capita expressed in USD2004
Group GDP per Capita Average GDP in Group Observations Average Vehicles per 1000 inhabitants
% Change in vehicle concentration between the GDP groups
1 0-500 250 8 6.2 - 2 500-1000 750 42 7.6 23% 3 1000-1500 1250 38 44.8 490% 4 1500-2000 1750 40 88.5 97% 5 2000-2500 2250 70 78.1 -12% 6 2500-5000 3750 117 94.1 20% 7 5000-10000 7500 112 120.5 28% 8 10000-15000 12500 91 254.6 111% 9 15000-20000 17500 57 355.8 40% 10 20000-25000 22500 73 381.4 7% 11 25000-30000 27500 78 434.2 14% 12 30000-35000 32500 48 511.9 18% 13 35000-40000 37500 24 471.5 -8% 14 40000-45000 42500 8 478.7 2% 15 45000-50000 47500 4 543.7 14% 16 50000-60000 55000 1 536.6 -1%
Source UNstats & World Road Statistics
In figure 12 below, one can follow the trends from table 8. Initially at low GDP levels, vehicle concentration grows rapidly. Around a GDP per capita level of 35000 USD2004, the vehicle growth slows down and the increasing trend disappears.
Total Sample 0 100 200 300 400 500 600 0 10000 20000 30000 40000 50000 60000 GDP per Capita $ 2004 V e h ic le p e r 1 000 Inha bi ta nt s
Figur 12 Average value of GDP and vehicle concentration
6
Conclusion and suggestions to further research
According to the expectations, the results shows with significance that China’s oil consumption responds more to income growth than to changes in oil price. The conclusions follow Dargay and Gately’s (1994) that a LDC responds more to income- than price changes. The results show that for China’s oil consumption, long run income elasticity is 1.317 and that their long price elasticity is -0.633. With regards to the elasticity and ceteris paribus an income increase of 100 percent over the period 2005-2020 will lead to that China by 2020 consume 17.6 mb/d. Thus the forecasts of EIA (2005) and IEA (2005) may be underestimated. However, it is not the purpose of this study to make a credible forecast with definite figures of future growth and oil price, but to give a model that may be applicable if such figures were available beforehand.
This study explains the high income elasticity of oil consumption in China by that they in a wealth perspective consume relatively small amounts of oil per capita. Another indirect explanation of China’s relatively low oil consumption may be their low concentration of vehicles.
Furthermore, an explanation of the lower price- than income elasticity may be that oil is an important necessity at low GDP levels. It may be an essential input in the industrialization as Dargay and Gately (2004) stated. Therefore the Chinese people may partly disregard price increases because the consumption of oil is such a necessity. Another explanation may be that the subsidizations on oil prices over the analyzed period 1970-2004 by China’s government have to a degree played out the role of the oil price by subsidizing it.
In order to capture more parts of the oil market, forecasts of other LDC with increasing oil consumption could be done as well as forecasts of those countries with increasing income and decreasing oil consumption. As a suggestion, that could be the object of interest for further research. Alternatively, it would be of interest to analyze if the oil market will manage to meet the expected demand increases from China or if the oil price will increase even further.
References
Books
Adnan S.-E., Hamel M. and Brennand G. (2004), Oil outlook to 2025, OPEC Review Paper, OPEC, Vienna.
Banks F. E. (1993), Some Basic Analytics of the World Oil Market, Department of Economics, Uppsala University.
Carlton D. W. and Perloff J. M. (2000), Modern Industrial Organization, third edition, Addison Wesley, USA.
Daly H. E. Ecological Economics: Principles and Applications. Covelo, CA, USA: Island Press, 2003. p 150.
EIA (2004), International Energy Outlook (2004), U.S Department of Energy, Washington EIA (2005), International Energy Outlook (2005), U.S Department of Energy, Washington IEA (2003), Energy to 2050 – Scenarios for a sustainable future, Paris
IEA (2004), World Energy Outlook (2004), Paris IEA (2005), World Energy Outlook (2005), Paris IMF (2005), World Economic Outlook
Jehle A.G. and P. J. (2001) Advanced Microeconomic Theory, 2nd edition.
Kahn J.R. (1998) The Economic Approach to Environmental and Natural Resources, 2nd edition,
University of Tenesse at Knoxville Oak Ridge National Laboratory, USA. Lounnas and Brennand (2002), Oil Outlook to 2020, OPEC, Vienna
Ramanathan R. (2002) Introductory Econometrics with Application 5thedition, University of
California-San Diego Databases
IEA (2004), Key World Energy Statistics (2004), Paris UN Statistics Division (2005)
Articles
Barth M. and Shaheen S. A. (2003) The Potential for Shared-Use Vehicle Systems in China, Institute of Transportation Studies, Univerity of California Davis, California. Dargay J. and Gately D. (1994) The Response of World Energy and Oil Demand to Income Growth and Changes in Oil Prices, Economic Research Reports New York University
RR#94-31, New York.
Dargay J. and Gately D. (1997) Income’s Effect on Car and Vehicle Ownership,
Gately D. and Huntington G. H. (2001) The Asymmetric Effects of Changes in Price and Income on Energy and Oil Demand. The Energy Journal 2002, # 23, Cleveland, Ohio. Huber P., Mills M. (2005) Oil, Oil, Everywhere . . , The Wall Street Journal, January 27 (2005) Kiesow I. (2004) China's Quest for Energy; Impact upon Foreign and Security Policy,
Defense Analysis, Swedish Defense Research Agency, Stockholm.
Mina G. and Perkin F. (1997) China’s Transitional Economy -Between Plan and Market,
East Asia Analytical Unit, Department of Foreign Affairs and Trade Australia.
Nordhaus D. W. (1980) Oil and economic performances in industrial countries, Sachs
Brookings papers on Economic Activity, pp 341-399, Yale University.
Pindyck S. R. (1978) The Optimal Exploration and Production of Nonrenewable Resources, The Journal of Political Economy 1978, pp 841-861.
Rawski T. G. (2001) What’s happening to China’s GDP statistics? China Economic Review December 2001.
Sandklef K. (2004), Energy in China: Coping with Increasing Demand, Defense Analysis, Swedish Defense Research Agency, Stockholm.
Sandklef K. (2005), China’s Growth and Challenges, Konjukturinstitutet, Stockholm Stiglitz J. E. (1976) Monopoly and the Rate of Extraction of Exhaustible Resources, The
American Economic Review 1976, pp 655-661.
Seminar
Jeddi A. (2005), Statements on the 11th International Monetary and Financial Committee Meeting,
April 2005, Washington.
Lee J. and Radetzki M. (2005), Can oil supply meet long term demand?”, NOG – seminar 10th February 2005, Stockholm.
NOG – seminar (2004), China, Seminar 4th November 2004, Stockholm Internet
Online December 5 2005 <www.wto.org>
Online November 25 2005 <http://data.bls.gov/cgi-bin/cpicalc.pl>