Working Paper 2007:9
Department of Economics
Effects of decentralization on
school resources: Sweden
1989-2002
Department of Economics Working paper 2007:9
Uppsala University January 2007
P.O. Box 513 ISSN 1653-6975
SE-751 20 Uppsala Sweden
Fax: +46 18 471 14 78
E
FFECTSOFDECENTRALIZATIONONSCHOOLRESOURCES:
S
WEDEN1989-2002
Å
SAA
HLINANDE
VAM
ÖRKPapers in the Working Paper Series are published
on internet in PDF formats.
Effects of decentralization on school resources:
Sweden 1989–2002
*Åsa Ahlin and Eva Mörk#
January, 2007
Abstract
Sweden has undertaken major national reforms of its school sector which, con-sequently, has been classified as one of the most decentralized ones in the OECD. This paper investigates whether school resources became more un-equally distributed across municipalities in connection with the reforms and if local tax base, grants, and preferences affected local school resources differently as decentralization took place. Using municipal data the paper studies how per pupil spending and the teacher-pupil ratio has evolved over the period 1989– 2002, separating between three different waves of decentralization. As nothing much has happened with per pupil spending, the teacher-pupil ratio has become more evenly distributed across municipalities. Municipal tax base affects per pupil spending in the same way regardless of whether the school sector is cen-tralized or decencen-tralized, but has a smaller effect on teacher-pupil ratio after the reforms. The less targeted grants are, the fewer teachers per pupil do the mu-nicipalities employ. The results for local preferences are less clear cut.
Keywords: school resources, school finance reform, decentralization, grant re-form
JEL: H40, H52, H70
* We are grateful for comments from Sören Blomquist, Erik Mellander, Mikael Sandström, Björn
Öckert, two anonymous referees for Economics of Education Review, and seminar participants at Department of Economics, Uppsala University.
# Corresponding author, Institute for Labour Market Policy Evaluation (IFAU) and Department
of Economics, Uppsala University, Box 513, SE-751 20 UPPSALA, Sweden. E-mail: eva.mork@ifau.uu.se.
1 Introduction
While the trend in many U S states has been to centralize school funding in or-der to avoid inequalities in school district spending, Sweden has unor-dertaken na-tional reforms to decentralize the responsibility and funding of the school sector to lower level government (municipalities). In 1991, the responsibility for com-pulsory and upper secondary school provision was transferred to the local level along with a less centralized system of targeted grants to schooling. In 1993, a major grant reform transformed the system of targeted grants into a general grant system. The latter reform implied a fundamental change of the organiza-tion of school funding. In 1996, teacher wages, that until then had been set through central negotiations implemented nationwide, started to be set at the lo-cal level. Cross-country comparisons undertaken after the implementation of these reforms rank Sweden as having one of the most decentralized schooling sectors in the OECD (OECD, 1998).
The main objective with the Swedish reforms was to better adjust schooling to local economic and demographic conditions, and thereby increase efficiency and accountability. Adjusting supply to local conditions (economic as well as political) is indeed one of the main theoretical arguments for decentralizing public tasks to lower level governments (see, e g, Oates, 1972). However, as is discussed by, e g, Boadway & Mörk (2004), fiscal decentralization inevitably gives rise to differences in the capacity of local governments to provide public services. Given that there also are national objectives of equal opportunities – as in Sweden – some state influence may still be called for. The challenge is to ac-complish this without unduly compromising the efficiency and accountability of public service production. In the decentralized school setting of Sweden, pupils’ equal access to a high standard of compulsory education was intended to be as-sured by, on the one hand, centrally formulated curricula and a stipulated mini-mum number of teaching hours for each subject, and, on the other hand, an am-bitious equalizing grant program constructed to compensate local governments with unfavorable structural conditions.
The purpose of this paper is to empirically investigate whether the reforms that decentralized the school sector affected local school resources and, if so, in what way. Two complementary measures of school resources are used in the analysis; per pupil spending and the teacher-pupil ratio. We focus our analysis entirely on the compulsory school sector, since the objectives of efficiency and equality of opportunities are most vital at that level, compulsory school being the stepping stone for further education. The following questions are analyzed: i) Did school resources become more unequally distributed across municipali-ties in connection with the reforms? ii) To what extent does the impact of local
tax capacity on school resources differ before and after decentralization? Study-ing the different effects of tax base is clearly a relevant issue since, as argued above, the drawback of decentralization is the risk of creating inequalities in school resources and thereby give pupils different chances for the future de-pending on where they attend school. Furthermore, iii) does it matter in what form (general or targeted) grants are delivered? Whether general and targeted grants have different effects is of great importance for all countries with more than one level of government. Finally, iv) what is the impact of local prefer-ences, and did it change in connection with the reforms? Theoretically, we would expect a more disparate pattern and a higher influence of local prefer-ences in the decentralized regime, but the effects may be neutralized by the common curricula and the equalizing grant system.
Employing a panel of 277 out of 290 municipalities, we study the period 1989–2002 a period covering observations from both before and after the im-plementation of the three key reforms in 1991, 1993, and 1996. There exists only one other quantitative study of the decentralization of the Swedish school system: Björklund, Edin, Fredriksson & Krueger (2004). They investigate whether the distribution of the teacher-pupil ratio changed following decentrali-zation. Their primary focus is, however, on the effects of resource changes on student achievement. Also, Björklund et al treat 1993 as the reform year and do not study the different reforms separately.
The paper is organized as follows: in the next section the institutional back-ground and, specifically, the two different regimes are described. Section 3 gives an overview of earlier empirical literature on the effects of school finance reforms. Section 4 presents the empirical strategy as well as the data used, and is is followed by the results in Section 5. Finally, Section 6 gives some concluding remarks.
2 Institutional
background
Since the 1960’s Sweden has a nine years tuition-free compulsory education starting at age seven. During the studied period, the number of pupils in com-pulsory education has been growing from slightly below 900,000 in 1989 to slightly above 1,000,000 in 2002. The share of pupils attending private schools has traditionally been low; in 1989 it was less than 1 percent. This share has however been growing during the 1990’s and in 2002 it was slightly below five percent, which still must be considered low in an international comparison.
Swedish municipalities, that in 1991 were given the responsibility for schooling, account for 20–25 percent of the total consumption in the economy. Besides schooling, they are responsible for supplying many other important
welfare services such as child care, care for the elderly (since 1992), individual and family care, infrastructure, culture, etc. They finance their activities through a proportional income tax, intergovernmental grants from the central govern-ment, user fees and rents. Furthermore, they are allowed to borrow.
Sweden’s system for organizing compulsory schooling was for a long time one of the most centralized ones in the OECD. Since the national reforms of the early 1990s, it has been classified as being one of the most decentralized ones (OECD, 1998). In this section we will describe the main features of the different school regimes.
2.1
The centralized regime
Prior to 1991, the Swedish school system was characterized by central govern-ment regulations and controls, centrally employed teachers and school leaders, and a system of central government grants that were targeted to specific catego-ries of school spending. Teacher wages were determined through central nego-tiations that were implemented nationwide. The wage level was a strict function of seniority and the stage that the teacher taught in. The maximum wage was achieved after 18–23 years of teaching.
The overriding policy objective was pupils’ equal access to education and to a certain standard of schooling irrespective of social background or place of residence. A general system of equalization grants was used in order to com-pensate municipalities with high structural costs, such as sparsely-populated ar-eas, and those with less than average tax capacity. In addition, municipalities received targeted grants to their different activities, including the school sector.
Grants targeted to the school sector were set by the county board of educa-tion. They assessed the local need for different types of resources and set the size of the targeted grants according to detailed formulas. Most of the grants were then distributed directly to the schools. The major parts of grants to schooling were targeted towards teaching costs (50 percent), costs for special education/remedial teaching and extra-curricular activities (25 percent), and payroll tax expenses (16 percent). The municipalities contributed with local in-come tax revenues to provide for school premises, textbooks and teaching aids, school lunches, school bussing, and costs for non-pedagogical staff such as counselors and school health services.
By construction, the targeted grant system determined the teacher-pupil ratio as well as the number of teaching hours (grants to teaching were determined as a function of the allocation of pupils across schools, the number of teaching hours per pupil, and the wage costs for teachers). Since teachers were central government employees, local governments did not have the possibility to hire more teachers than allowed by the grants in order to, for example, increase
teaching time or reduce class sizes. Grants were also to cover costs for substi-tute teachers. However, they were not based on actual outlays, but allocated as a percentage of the number of teachers. If this amount did not cover the actual cost in a municipality, local revenues had to be used to cover additional hiring expenses. During the two years preceding decentralization, 1989–90, the mu-nicipal grant dependence in school funding varied between 50 and 80 percent.
2.2
The decentralized regime
The decentralization of the school sector did not happen over one night. Instead it took place gradually through several reforms. Below we will present the three reforms we consider to be the most significant.
2.2.1 The 1991 reform: shifting responsibility to the local level
Gradually, public sector efficiency became an important policy objective. Along with a general trend of public sector decentralization and deregulation, it was considered necessary to deregulate the schooling sector to make it possible to better adjust to local economic and demographic conditions. On January 1, 1991, the formal responsibility for compulsory, upper secondary and adult
edu-cation was transferred from the national to the local government level.1 At the
same time, teachers and school leaders became municipal employees. Teacher wages continued however to be set in central negotiations. The role of the cen-tral government became limited to setting the national achievement goals to be met by the municipalities and their schools, and making sure that national evaluations were performed.
Equality in education standards remained an important national objective. The central government was still to have the overall responsibility for guaran-teeing that the financial prerequisites of the various municipalities were as equal as possible. At the same time, it was realized that the municipal responsibility needed to be accompanied by a local capacity to affect and allocate school re-sources. Therefore, the various grants targeted to specific school costs were abolished and a single lump sum grant to the local compulsory school sector as a whole was introduced. Thus, the grant system remained targeted but on a less detailed level than before; the municipalities could now allocate grants freely between teaching hours, textbooks and teaching aids, school lunches, school bussing, school premises, and costs for non-pedagogical staff such as counselors and school health services. The size of the new grant was to a certain extent based on the amount of grants received in the old system. Thereafter, grants
were to be adjusted according to local changes in the number of school-aged children. The change in grants targeted at schooling meant that the municipali-ties became able to allocate compulsory school resources as they saw fit. Also, as teachers were now municipal employees it became possible to adjust the number of teachers, either through reallocations of existing resources or by add-ing local tax revenues to the grants. However, national regulations specifyadd-ing the minimum amount of teaching time to be spent on different subjects re-mained.
2.2.2 The 1993 grant reform: replacing targeted grants with general
A second step in public sector decentralization was taken only two years later when the overall system of central government grants was changed, affecting the school funding system as well. One aim of the reform was to clarify the re-sponsibility at the local and national level. The reform, which took place in 1993, replaced the system of targeted central government grants to all municipal services (education, child and elderly care, social services and infrastructure) by a general lump sum grant. Thereby, local governments received considerably more flexibility also in their school spending decisions.
To avoid inequalities in municipal spending due to different structural condi-tions such as demography and tax base across municipalities a new grant sys-tem, also of lump-sum type, was introduced, compensating municipalities with high cost of providing services due to these conditions. During this period (1993–95), grants from the national government constituted approximately 20 percent of total municipal revenues. This figure varied however much be-tween municipalities. Tax revenues made up approximately 50 percent. As an-other way of obtaining some degree of equality in education across municipali-ties, the national government level retained the responsibility for formulating a common curriculum and educational goals that the local governments were to achieve.
2.2.3. The 1996 wage reform: decentralized wage setting for teachers
Even after decentralization took place in 1991, teacher wages continued to be set in central negotiations implemented nationwide. In 1995, it was decided that the wage setting procedure was to be decentralized, allowing and aiming for a large degree of individual variation. The new wage setting practice was first used in 1996. How it was implemented in practice for public school teachers varied depending on the municipal organization. In principle, wages were set by the school leader in negotiations with the municipality.
Also in 1996, the system for intergovernmental grants was slightly changed taking into account some criticism that has been raised at the 1993-system. The
new system consisted of income equalization, cost equalization, general grants and transitional grants. The major change was that municipalities with a tax base above a certain level, which had been excluded from the income equaliza-tion system before 1996, now had to contribute to the system.
2.3
Other important economic conditions
In order to understand how these reforms might affect school resources, it is necessary to know some more facts about the Swedish economy and some other institutional changes that were implemented during the same period as the de-centralization took place.
First, at the same time as the school sector was decentralized, the Swedish economy plunged into a deep recession in the first half of the 1990s. The reces-sion put several financial restrains on the municipalities, both since the tax base decreased and since, as a means of reconstructing the central finances the cen-tral government reduced the intergovernmental grants to municipalities dramati-cally (average grant dropped, in 2001 prices, from 12,800 in 1992 to 8,000 in 1995). These restraints might imply that we find smaller effects of the decen-tralization than would have been the case under better economic conditions.
Second, during the first years of the decentralization (1991–93), the possibil-ity for municipalities to raise local revenues through an increase in the local in-come tax rate was temporarily restricted through national regulations. In 1994 the formal restriction was lifted, but municipalities that choose not to raise their tax rates were premiered. A consequence of this cap on tax rates could be that municipalities, during the first half of the nineties, were unable to adjust school resources to local tax base as much as they might have desired.
Third, another national reform that contributed to decentralization – but at the student and parent level – was the introduction of public funding to inde-pendent schools. Implemented in the second half of 1992, it greatly increased the opportunities for students to choose another school – public or independent – than the one in the neighborhood. It also became easier to choose school in a municipality different from the one where the student lived. The school choice reform was followed by a growth of private schools which in 1991 were situ-ated in only 33 out of 288 municipalities. In 1992, the share of students attend-ing a private school (in the home municipality or in another area) varied in be-tween 0 and 7.8 percent across municipalities. By 1995, the private school share had increased to at most 9.6 percent. About 40 percent of the municipalities had,
however, not yet any students attending private schools, making us less worried
that this reform will affect our results.2
3
Empirical literature on the effects of
school finance reforms on school
re-sources
As far as we are aware of, there is only one previous quantitative study analyz-ing the effect of the Swedish decentralization on compulsory school resources: Björklund et al (2004, ch 4). Their study differs from the one in this paper in several ways; it focuses on the teacher-pupil ratio alone and treats 1993 as the key date in the decentralization process rather than separating between the 1991, 1993 and 1996 reforms. Studying whether teacher resources changed in relation to the 1993 grant reform, and whether such a change affected student
perform-ance (grades in the final year of compulsory school)3, Björklund et al find that
the median teacher/pupil ratio decreased by 1.7 percentage points during the pe-riod 1990/1991 to 1999/00 but rebounded somewhat in the beginning of the 2000s. They also find a trend of widening differences in teaching resources, mainly at the bottom of the distribution. Regressing teacher-pupil ratio on the average municipal income and comparing 2001 with the 1991–93 period, they conclude that decentralization seems to have had little effect on the relationship between school inputs and income but that municipalities seem to have changed positions in the distribution of resources over municipalities.
Just like Sweden, Chile decentralized part of the school finance system from the national to the local level. Winkler & Rounds (1996) study the Chilean case. They compare the spending equality and cost-efficiency across rich and poor municipalities before and after the reform. The conclusion of their study is that spending inequality increased after decentralization, but that the effect on cost-effectiveness was ambiguous.
The school finance reforms that otherwise have been most analyzed in the literature are those implemented in the U S. Since the 1970s, all U S states have, at some point, reformed the school finance system to obtain more equal spend-ing across school districts. The background to these reforms is that many state courts have judged the school finance systems based on local property taxes
2 See Ahlin (2003) for more information on the school choice reform.
3 The effect of decentralization on school resources is only of the topics discussed in Björklund et
al Other topics are e g equality and efficiency, skills and earnings, teacher supply, and the
constitutional due to the different financial prerequisites it gives for schools in rich (high per pupil property value) and poor (low per pupil property value) dis-tricts. These verdicts forced states to undertake differently constructed reforms with the common denominator of increased reliance on state-level revenues in order to obtain less dispersion in district spending. Murray, Evans & Schwab (1998), among others, have investigated the effects of these reforms using school district data from a selection of U S states in a fixed effect model. Using a dummy to capture school finance reforms, they find that the centralization of schooling significantly decreased the degree of dispersion in school spending across wealthy and poor districts. Furthermore, they find that this happened through “leveling-up”, i e through an increase in spending in the poorest dis-tricts but with an unchanged spending in the richest disdis-tricts. Card & Payne (1998) study the effect of school finance reforms on the distribution of school spending across low and high income districts in California. More specifically they investigate to which extent state revenues and total spending vary with family income. They find that districts where the existing financing system was found unconstitutional tended to adopt more equalizing funding formulas over the 1980s. But even in absence of court actions, legislatively-induced school fi-nance reforms that reduced or eliminated flat grants and enlarged the share of state funding based on the districts’ ability to pay led to equalization in many states. However, in many states inequality in local revenues per student widened between richer and poorer districts, partially offsetting the equalizing effects of
changes in state aid formulas.4 Other studies, such as Manwaring & Sheffrin
(1997) and Silva & Sonstelie (1995), use national level data to investigate the effect of finance reforms on mean spending. While Manwaring and Sheffrin find that spending has risen in connection with the reforms, Silva and Sonstelie, concentrating on California, find that school-spending decreased.
One problem the evaluator of the U S reforms faces, but that the Swedish evaluator does not, is that the reforms undertaken are very heterogeneous, something that has been pointed out by, e g, Hoxby (1998). The way districts and states finance schooling differs across states both before and after the re-forms. In the Swedish system this is not problematic since all municipalities faced the same institutional setting both before and after the reforms and since the reforms were homogenously implemented across the country.
4 Card’s and Payne’s primary focus is on whether the reforms aimed at reducing spending
ine-qualities had any effect on the distribution of performance across students of different family background. Their findings indicate that students with a family background of low education tend to have higher academic achievement if attending school in a state where the inequality in spending has decreased.
4
Empirical strategy and data
4.1 Empirical
strategy
In the introduction we posed four questions for the paper: i) Did school re-sources become more unequally distributed across municipalities in connection with the reforms? ii) To what extent does the impact of local tax capacity on school resources differ before and after decentralization? iii) Does it matter in what form (general or targeted) grants are delivered? iv) What is the impact of local preferences, and did it change in connection with the reforms? This sec-tion will explain how we intend to answer these quessec-tions.
In order to investigate whether school resources became more unequally dis-tributed in connection with the reforms we will look at some descriptive statis-tics. Using Box-whisker plots and by calculating different statistical measures of inequality, we will compare the evolution before and after the reforms.
In order to answer the next three questions we will estimate the following fixed effect model with a main effect and three interaction effects:
mt t m mt mt mt mt mt
D
D
D
y
=
x
α
+
(
91−92x
)δ
1+
(
93−95x
)δ
2+
(
96−02x
)δ
3+
υ
+
υ
+
ε
(1)The dependent variable, ymt, denotes compulsory school resources in
municipal-ity m in year t. x is a vector of independent variables including tax base, total in-tergovernmental grants and different preference variables described more
be-low. Interaction terms are created through the dummy variables
D
91−92,D
93−95,and
D
96−02 representing the three different decentralized regimes. They thusequal one for the years 1991–92, 1993–95, and 1996–2002, respectively, and
zero otherwise. The estimated parameter
α
will capture the impact of x onschool resources prior to decentralization, and δ1, δ2 and
δ
3 will tell uswhether this impact differs for the decentralized regimes.
υ
mare unobserved,municipality-specific fixed effects5, and
t
υ
are time-dummies capturingcom-mon macroeconomic trends and shocks. Estimating a fixed effect model implies that we identify the parameters using variation within cross-sectional units (mu-nicipalities), something that is typically preferred in many empirical studies. Also, it is a way of minimizing omitted variable bias, since the fixed effects control for everything that is constant across time within municipalities. Finally,
5 We have conducted Hausman test testing whether the municipality specific effects can be seen
mt
ε
is an error term that in the empirical analysis is clustered on cross-sectionalunit (municipality) in order to allow for general autocorrelation in the school re-sources. The estimated standard errors will also be heteroscedasticity-consistent.
Once equation (1) is estimated it is possible to test whether decentralization has entailed increased inequality in schooling resources across municipalities of different tax capacities. If this has happened, we would see an increasing, posi-tive impact of the local tax base on school resources over time. Since local gov-ernment possibilities to use tax revenues to hire teachers was introduced in con-nection with the 1991 reform (when teachers became municipal employees), we might expect the main change in the impact of tax base on teacher-pupil ratio to be visible in connection with this reform rather than from 1993 and ahead. On the other hand, during the period 1991–93, municipalities were still not allowed to increase their tax rates. Therefore, we might suspect that it took a while for taxable income to have an effect on school resources even after the decentraliza-tion. Furthermore, we can investigate whether the effect of grants has differed across time. Given that grants were partly targeted up to the 1993 reform, we expect grants to have a greater impact on school spending the early years than from 1993 onwards, since municipalities after 1993 no longer were forced to
spend a given amount on school resources.6 On the other hand, grants decreased
in 1993, and it is possible that municipalities react differently to increases and decreases in grants, something indicated by evidence in Karlsson (2006) who finds asymmetric effects of grants on school spending in Sweden. Finally, we will test whether local preferences matter more after the reforms than before. We expect this to be the case, since one of the main arguments for decentraliz-ing publicly provided service is that there will be a better matchdecentraliz-ing to local preferences in a decentralized organization. However, given that the economy entered into a deep recession in the first half of the 1990s, municipalities may not have been able to increase school resources as much as desired.
4.2 Data
Our data covers 2777 municipalities over the period 1989–2002. It would have
been desirable to start the study even earlier, but comparable data is not avail-able before 1989. We use two different definitions of municipal compulsory
6 Note that we use total grants during the whole period. The grant-definition does thus not differ
between regimes.
7 We have excluded nine municipalities (Nyköping, Borås, Örebro, Gnesta, Trosa, Bollebygd,
Lekeberg, Södertälje and Nykvarn) from the data since they have been affected by consolidations during the studied period, and three (Gotland, Göteborg and Malmö) since they handled activities that are normally handled by the counties.
school resources. The first is total spending per pupil attending compulsory
pub-lic schools in the municipality8, excluding costs for premises and school
trans-ports. Costs for premises are excluded since differences in these capture the principles for how to calculate these costs rather than actual differences in quan-tity and quality, and also since the principles differ extensively over municipali-ties as well as over time. Costs for school transports are excluded, since there is no available data for 1992. The second definition of school resources is the teacher-pupil ratio; the number of full-time teachers per 1,000 pupils. We argue that none of these two measures is to be preferred over the other, but that they reflect different aspects of school resources. Note that there is, by definition, a link between the two measures, where teacher-pupil ratio times teacher wages is one of the components in spending per pupil.
We measure municipalities’ taxing capacity with municipal tax base. Inter-governmental grants include total targeted and general central government grants plus equalization grants the whole period. We capture local preferences by using a political dummy indicating whether the left-wing bloc has a majority
in the municipal council9, the share of females in the municipal council, and by
the share of inhabitants with higher education. Left-wing governments are typi-cally assumed to prefer a larger public sector than right-wing governments, but whether this is true for school resources as well is an open question. Also, fe-male participation is often assumed to matter for policy outcome, for example, both Svaleryd (2002) and Ågren et al (2007) find that Swedish female politi-cians have higher preferences for schooling than their male counterparts. Fi-nally, we use the share of the population with higher education as a way of measuring local preferences. We expect higher education to be positively asso-ciated with stronger preferences for higher school spending and teacher-pupil ratio (that is for example what Ågren et al find for both voters and politicians).
In order to avoid omitted variable bias, we include a number of other covari-ates that might influence school resources. These are the population share of school-aged individuals, the share of school-aged children born abroad, the
8 Total spending per pupil is available for practically all municipalities for the period 1992–2002.
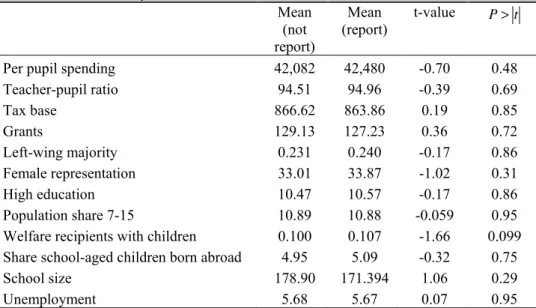
However, for 1989–91 reporting data was voluntary, and the variable is therefore missing for some municipalities. There may be a selection problem if the municipalities that did not report during these years are not random, but differ in some important aspect from those that did report. In order to investigate this, we have compared summary statistics for the two groups for 1992. Testing on the 5-percent level, we cannot reject the null hypothesis that the means are the same across the two groups. Results from these tests are reported in Table A2 in the Appendix. The t-test builds on equal variances in both groups.
9 Even though Sweden is a multi-party system, it is standard to treat Sweden as a bipartisan
sys-tem among political scientists and economists (see, e g, Alesina, Roubini & Cohen, 1997). The parties can be divided into a left-wing and a right-wing bloc.
number of households with school-aged children receiving welfare per capita, and the average number of students per school. Since some of these variables
likely are correlated with income, grants and preferences,10 it is not obvious
whether one should control for these or not. In the estimations we will therefore estimate the model both with and without these control variables. Also, we will estimate models both where the impact of these control variables are assumed to be the same across regimes and where they are allowed to differ.
Finally, as mentioned in Section 2, the first two reforms coincide with a deep recession. Effects of the downturn that are homogenous across municipalities are controlled for via year dummies. It is however likely that the economic downturn hit different municipalities differently. If, at the same time, the reces-sion affected school resources as well as some of the regressors, this would cause a bias in the estimated parameters. We therefore include municipal unem-ployment as an additional regressor.
Exact definitions and summary statistics of all the variables used are given in the Appendix.
5 Results
5.1
Did school resources become more unequally
distrib-uted across municipalities after the decentralization?
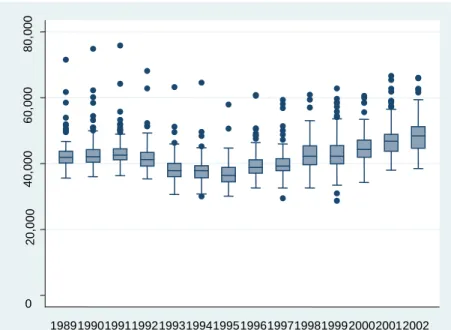
11One way to investigate whether resources have become more unequally distrib-uted is to look at their evolution over time. We are mainly interested in whether the variation changed in 1991 when the responsibility for schooling was trans-ferred to the municipalities, in 1993 when intergovernmental grants underwent a large reform, and in 1996 when teacher wages were individualized. Figure 1 (per pupil spending) and Figure 2 (teacher-pupil ratio) present Box-whisker
plots12 showing the development of school resources 1989–2002.
10 Costs arising due to these control variables are for example compensated for via the equalizing
grant system.
11 We have in this section chosen to study a balanced panel, so that the different number of
ob-servations across time does not cause differences in variation. The sample used consists of 260 municipalities over 14 years. The estimations in next section will use all available data.
12 The line in the middle of the box represents the median of data. The box itself constitutes the
interquartile range (IQR), that is, it extends from the 25th percentile of the data to the 75th. The
lines emerging from the box are called the whiskers and they extend to the upper and lower adja-cent values. The upper adjaadja-cent value is defined as the largest data point less than or equal to the 75th percentile + 1.5*IQR and the lower adjacent value is defined as the smallest data point
greater than or equal to the 25th percentile - 1.5*IQR. Observed data points more extreme than
As can be seen from Figure 1, spending per pupil decreased when the grant system was changed in 1993, but started to increase again in 1996. The decrease in 1993 might be an effect of the reduction in total grants in connection with the reform, rather than of the decentralization. Regarding the variation in spending it is hard to give a clear answer; the number of outliers seems to have decreased over time, but if we concentrate on the box, the variation seems to have grown somewhat. Turning to the teacher-pupil ratio in Figure 2, we can identify a small increase in 1991, the year of decentralization. Thereafter, there has been a small downward trend that did not end until 1999. Looking at the variation, there is a clear tendency that it decreased from 1995 and onward.
Figure 1 Per pupil compulsory school spending, 1989–2002
0 20,000 40,000 60,000 80,000 19891990199119921993199419951996199719981999200020012002
Figure 2 Teacher-pupil ratio in compulsory school, 1989–2002
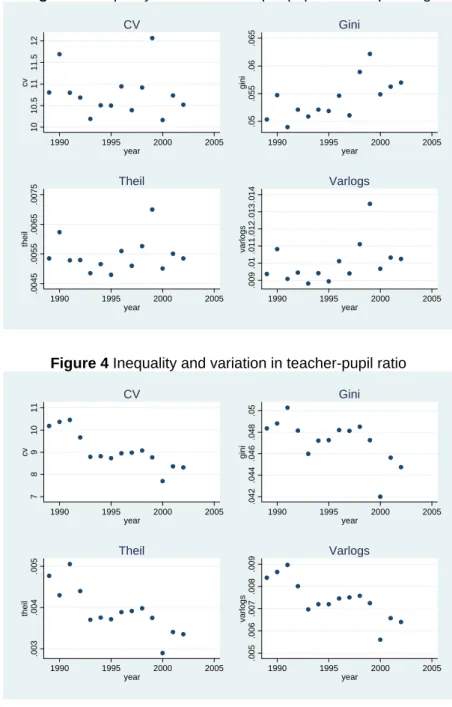
In order to get a clearer picture of what has happened with the variation in school resources, we have calculated a number of different statistics describing inequality and variation. The interesting question is then to look at how these have changed over time. The measures we have chosen are the coefficient of variation (CV), the Gini-coefficient, the Theil entropy measure, and the vari-ance of logs. The Gini-coefficient is defined as the ratio of the area between the Lorentz curve of the distribution and the curve of the uniform distribution, to the area under the uniform distribution. It can vary between 0 and 1 (where 1 is the same as perfect inequality). The Theil entropy measure builds on the laws of
statistical physics and can vary between 0 and lnN (in our case 5.56).13 Higher
values on the statistics imply that spending/teacher-pupil ratio is more unequally distributed. Figure 3 (per pupil spending) and Figure 4 (teacher-pupil ratio) show the development over time of the four statistics. Starting with per pupil spending, it is hard to detect any clear pattern, except that 1999 seems to have been an extreme year for per pupil spending. The variation in the teacher-pupil ratio, on the other side, has decreased over time, making the municipalities
13 For formulas of the Gini coefficient and Theil’s entropy measures see, e g, Mills & Zandvakili
(1997). For a discussion of the intuition behind Theil Index, see Conceição & Ferrera (2000). The calculations are performed in Stata SE8.
0 50 100 150 200 19891990199119921993199419951996199719981999200020012002
more similar. Note however, that the variation in school resources is quite low to begin with. For example, the Gini coefficient never higher than 0.056 and the Theil measure is always below 0.01.
Figure 3 Inequality and variation in per pupil school spending
10 10.5 11 11.5 12 cv 1990 1995 2000 2005 year CV .05 .055 .06 .065 gini 1990 1995 2000 2005 year Gini .0045 .0055 .0065 .0075 theil 1990 1995 2000 2005 year Theil .009 .01 .011 .012 .013 .014 varlogs 1990 1995 2000 2005 year Varlogs
Figure 4 Inequality and variation in teacher-pupil ratio
7 8 9 10 11 cv 1990 1995 2000 2005 year CV .042 .044 .046 .048 .05 gini 1990 1995 2000 2005 year Gini .003 .004 .005 theil 1990 1995 2000 2005 year Theil .005 .006 .007 .008 .009 varlogs 1990 1995 2000 2005 year Varlogs
5.2
Did decentralization cause structural shifts in school
resources?
In this section we present the results from estimating equation (1) for per pupil spending and teacher-pupil ratio one at the time.
5.2.1 Per pupil spending
Starting with per pupil spending, the results are given in Table 1. In column i) we do not control for any additional covariates other than those showed in the table, in column ii) we control for the covariates presented in section 4.2, but assume that their effects are the same during the whole time-period, and in col-umn iii) we interact the other covariates with the three reform-dummies as well. For each regressor, we first present the main effect, and thereafter interaction ef-fects for the different decentralized regimes. An insignificant result of a interac-tion term implies that the effect is the same for the centralized as for the decen-tralized regime. In Table 2 we then test the null that the total effects for the
three different decentralized regimes are equal to zero (i e
1,2,3 i , 0 δi = = +
α
).Starting with municipal tax base we see from the Table 1 that it has a posi-tive and significant effect on per pupil spending regardless of if and how we control for other covariates. An increase in the tax base with 100 SEK (100 SEK corresponds to approximately 14.7 US dollars or 11.1 euros) increases per pupil spending with something more than 10 SEK. However, the effect of tax base does not seem to change when the school sector was decentralized; the pa-rameter estimates of the interaction terms are all statistically insignificant, and the tests in Table 2 show that all three total effects are significantly different from zero. Hence, even after the cap on tax rates was lifted, the tax base had the same effect on spending as before.
Turning to the grants variable, we see that grants have a positive and signifi-cant effect on per pupil spending: 100 SEK more in grants increases per pupil spending with 30 SEK. An increase in grants hence yields a larger increase in spending than an equal increase in own revenues (tax base), a phenomena called the “Flypaper effect”, often found in the empirical literature (see, e g, Hines & Thaler, 1995 for an overview). However, during the time period directly after the grant-reform (1993–95) grants have no effect on per pupil spending (the P-value in Table 2 is clearly above 0.1). During the other two decentralized re-gimes the effects of grants arte smaller than during the centralized regime, as expected from economic theory, but the difference is not statistically
signifi-cant.14 The fact that the grant-effect disappears during 1993–95 could be a result of asymmetric effects of increasing and decreasing grants, similar to those found by Karlsson (2006).
Do preferences matter more for per pupil spending after the decentralization than before? Looking at the effects during the centralized regime we see that municipalities led by a left-wing government spend approximately 800 SEK less on schooling than other municipalities. This effect however more or less disappears during the second decentralized regime, but is there before 1993 and after 1995. One explanation for this might be that municipalities with a right-wing government were unable to increase spending above the minimum stan-dards stipulated by laws, since they were not allowed to increase taxes during most of the period. The percentage of females has a negative, significant, effect during the last regime (1996–2002) where 1 percentage point more females im-ply approximately 50 SEK less per pupil spending, but is statistically insignifi-cant before 1996. The last variable we use in order to capture local preferences (the share of the population with higher education) does not seem to affect per pupil spending neither in a centralized nor a decentralized setting. Remember however that we use within-variation in order to identify the parameters. Prefer-ences that are constant over time are hence captured by the municipality specific fixed effects.
Table 1. Results: Per pupil spending
i) ii) iii) Tax base 12.96 ** (6.06) 11.03 * (5.87) 10.62 ** (4.54) Tax base *
D
91−92 -0.633 (4.39) -0.200 (4.45) 1.98 (3.54) Tax base *D
93−95 -2.46 (4.55) -2.62 (4.59) 0.207 (3.42) Tax base *D
96−02 -0.068 (4.17) 1.90 (4.20) 3.51 (3.33) Grants 33.24 ** (13.06) 34.08 *** (13.05) 35.79 *** (11.94) Grants *D
91−92 -14.35 (10.95) -9.56 (10.87) -12.21 (11.75) Grants *D
93−95 -32.00 *** -25.45 ** -31.43 ***14 Remember that we use total intergovernmental grants the whole period, that is regardless of
i) ii) iii) (12.39) (12.79) (11.27) Grants *
D
96−02 -18.23 (16.41) -10.21 (16.55) -13.47 (11.60) Left wing -959.68 ** (434.35) -778.89 ** (444.93) -829.54 ** (422.26) Left wing *D
91−92 312.01 (380.06) 138.31 (373.95) 302.34 (473.14) Left wing*D
93−95 979.49 ** (472.53) 816.93 * (471.76) 797.76 * (452.35) Left wing *D
96−02 90.52 (505.38) -97.02 (489.16) -152.68 (432.18) Female representation 16.23 (31.63) -12.01 (32.42) -14.27 (26.36) Female representation *D
91−92 -16.57 (26.18) -10.91 (26.73) -3.30 (29.82) Female representation*D
93−95 -26.94 (32.13) -7.932 (33.58) -2.76 (28.31) Female representation *D
96−02 -69.42 * (35.94) -38.04 (37.23) -45.20 (28.68) High education 268.13 (289.31) 322.07 (282.34) 258.73 (185.22) High education *D
91−92 -73.94 (83.65) -102.52 (82.30) -134.86 (82.23) High education *D
93−95 -85.36 (103.04) -125.43 (100.15) -146.66 (82.05) High education *D
96−02 -68.66 (114.35) -133.64 (112.02) -149.48 (90.56) Municipality fixed effects Yes Yes YesTime dummies Yes Yes Yes
Covariates No Yes Yes
Covariates * D No No Yes
No of observations 3,662 3,638 3,638
R2 within 0.6331 0.6419 0.6464
Notes: Robust standard errors clustered on cross-section unit within parentheses. ***, **
Table 2 F-tests for the decentralized regimes. 1991–92 1993–95 1995–2002 Specification i) Income 9.44 (0.002) 6.39 (0.009) 8.38 (0.004) Grants 6.51 (0.01) 0.03 (0.86) 1.77 (0.18) Left wing 2.77 (0.10) 0.00 (0.95) 5.97 (0.02) Female representation 0.00 (0.99) 0.21 (0.65) 3.72 (0.05) High education 0.59 (0.44) 0.70 *** (0.40) 0.95 (0.33) Specification ii) Income 7.38 (0.007) 4.74 (0.03) 9.00 (0.003) Grants 11.47 (0.001) 1.46 (0.23) 4.20 (0.04) Left wing 2.79 (0.10) 0.01 (0.91) 5.97 (0.02) Female representation 0.81 (0.37) 0.75 (0.39) 3.32 (0.07) High education 0.80 (0.37) 0.86 (0.36) 0.89 (0.35) Specification iii) Income 11.06 (0.001) 11.00 (0.001) 19.40 (0.00) Grants 11.95 (0.001) 0.66 (0.42) 9.23 (0.002) Left wing 2.72 (0.10) 0.02 (0.90) 17.46 (0.00) Female representation 0.70 (0.40) 0.95 (0.33) 11.57 (0.001) High education 0.59 (0.44) 0.67 (0.41) 0.84 (0.36) Notes: F-test that α+δi =0,i =1,2,3. Prop>F within parentheses. A p-value smaller
5.2.2 Teacher-pupil ratio
Let us next turn to the teacher-pupil ratio. Results for these estimations are pre-sented in Table 3 and the F-tests in Table 4. The models in columns i), ii) and iii) are specified as above.
The results in columns i) and ii) indicate that income has a positive signifi-cant effect during the centralized regime; an increase in tax base with 100 SEK increases the teacher-pupil ratio with 0.03 more teachers per 1,000 pupils. However, the more decentralized the school sector became; the smaller is this effect and for the two latter periods we cannot reject the null that the effect is zero. In column iii) where we allow the parameters for the control variables to differ between regimes the positive significant effect for the centralized regime disappears. Some sensitivity tests (not shown in the paper) where we have ex-cluded the other covariates one at the time as well as assumed their effects to be the same across all regimes, also one at the time, reveal that it is the share school-aged children born abroad that “kill off” the effect.
Turning to intergovernmental grants, Table 3 shows that these had a positive significant effect during the centralized regime; 100 SEK more in grants lead to an increase in the teacher-pupil ratio with 0.09 more teachers per 1,000 pupils. Just as for per pupil spending, the effect of grants is hence larger than the effect of tax base. In 1991, when the responsibility for the school sector was shifted to the municipalities, the effect became somewhat smaller but was still signifi-cantly different from zero. However, after the grant-reform in 1993 the effect of grants is no longer statistically significant as shown by Table 4, and it stays insignificant as the economy recovers. These results indicate that the less tar-geted grants are, the less will be spent on the number of teachers.
Finally, looking at the preference, we see from Table 3 that municipalities with left-wing majorities have lower teacher-pupil ratio than others during the centralized regime, but not during the decentralized regimes (see Table 4). The higher the percentage of females in the municipal council is, the more teachers there are per pupil during the centralized regime (One percentage point more females, 0.13 more teachers per 1,000 pupils). The effect turns insignificant as the school sector is decentralized. These two results are somewhat strange, since the municipalities could not affect the teacher-pupil ratio before 1991. Therefore, we suspect that these two variables (left-wing majority and female representation) actually captures something else than local preferences. The share of the population with higher education does not seem to matter at all, just as for per pupil spending.
Table 3 Results: Teacher-pupil ratio (number of full-time teachers per 1,000 pupils) i) ii) iii) Tax base 0.030 ** (0.012) 0.028 *** (0.013) 0.009 (0.012) Tax base *
D
91−92 -0.008 * (0.004) -0.007 (0.005) -0.002 (0.005) Tax base *D
93−95 -0.019 ** (0.009) -0.018 * (0.010) -0.007 (0.009) Tax base *D
96−02 -0.027 *** (0.009) -0.022 ** (0.010) -0.009 (0.009) Grants 0.088 *** (0.026) 0.093 *** (0.029) 0.069 *** (0.023) Grants *D
91−92 -0.034 * (0.014) -0.032 * (0.017) -0.012 (0.016) Grants *D
93−95 -0.090 *** (0.025) -0.086 *** (0.030) -0.073 *** (0.020) Grants *D
96−02 -0.113 *** (0.035) -0.109 *** (0.040) -0.082 *** (0.027) Left wing -1.70 ** (0.796) -1.85 ** (0.863) -2.67 *** (1.023) Left wing *D
91−92 1.80 *** (0.552) 1.90 *** (0.621) 2.64 *** (0.855) Left wing *D
93−95 2.27 *** (0.857) 2.42 *** (0.917) 3.05 *** (1.08) Left wing *D
96−02 0.974 (0.967) 1.06 (0.977) 1.93 ** (1.04) Female representation 0.138 ** (0.059) 0.133 ** (0.063) 0.135 ** (0.063) Female representation *D
91−92 -0.028 (0.040) 0.067 (0.044) -0.060 (0.045) Female representation *D
93−95 -0.096 ** (0.059) 0.120 * (0.063) -0.106 * (0.062) Female representation *D
96−02 -0.121 * (0.066) 0.116 * (0.068) -0.127 ** (0.066) High education 0.240 (0.508) 0.371 (0.499) 0.662 ** (0.461) High education *D
91−92 0.076 (0.099) 0.036 (0.111) -0.057 (0.117) High education *D
93−95 -0.019 -0.104 -0.298 *i) ii) iii) (0.167) (0.174) (0.170) High education *
D
96−02 0.124 (0.210) -0.023 (0.216) -0.234 * (0.206) Municipality fixed effects Yes Yes YesTime dummies Yes Yes Yes
Covariates No Yes Yes
Covariates X D No No Yes
No of observations 3,864 3,699 3,699
R2 within 0.7893 0.7887 0.7984
Notes: Robust standard errors clustered on cross-section unit within parentheses. ***, **
Table 4 F-tests for the decentralized regimes. 1991–92 1993–95 1995–2002 Specification i) Income 4.69 (0.03) 2.34 (0.13) 0.18 (0.67) Grants 9.82 (0.002) 0.02 (0.89) 1.29 (0.26) Left wing 0.02 (0.90) 1.07 (0.30) 1.21 (0.27) Female representation 4.08 (0.04) 0.92 (0.34) 0.09 (0.77) High education 0.48 (0.49) 0.31 (0.58) 1.08 (0.30) Specification ii) Income 4.73 (0.03) 2.30 (0.13) 0.81 (0.37) Grants 12.95 (0.000) 0.25 (0.62) 0.49 (0.49) Left wing 0.00 (0.95) 1.14 (0.29) 1.41 (0.24) Female representation 1.57 (0.21) 0.09 (0.76) 0.10 (0.75) High education 0.84 (0.36) 0.47 (0.49) 0.98 (0.32) Specification iii) Income 0.57 (0.45) 0.16 (0.69) 0.01 (0.93) Grants 10.73 (0.001) 0.06 (0.81) 0.38 (0.54) Left wing 0.00 (0.97) 0.48 (0.49) 1.26 (0.26) Female representation 2.02 (0.16) 0.48 (0.49) 0.02 (0.88) High education 2.14 (0.16) 1.04 (0.31) 1.78 (0.18) Notes: F-test that α+δi =0,i =1,2,3. Prop>F within parentheses. A p-value smaller
6
Summary and concluding
discus-sions
In this paper, we have analyzed how the decentralization of the Swedish school sector affected the allocation of school resources. Just looking at data over the period 1989–2002 it seems like the variation in the teacher-pupil ratio decreased following decentralization, whereas not much happened to per pupil spending. The descriptive analysis of the Swedish case is thus contrary to both the U S and the Chilean evidence, but in line with the evidence in Björklund et al (2004). It is also opposed to what one would have expected from basic fiscal-federalism theory. One potential explanation for the decreased variation could be strategic interaction; given that local politicians know that they will be held accountable for their decisions after the decentralization they may not want to deviate too much from the their neighboring municipalities.
Turning to the regression analysis, we aimed at investigating whether mu-nicipal own income (measured with mumu-nicipal tax base) became more important determinant of school resources after the decentralization. This question is partly motivated by some peoples’ fear that pupils living in poor municipalities would suffer from the reform. We find that local income does not seem to mat-ter more afmat-ter the decentralization than before for per pupil spending. For the teacher-pupil ratio, on the other hand, the effect of own tax base is smaller after the decentralization than before and tax base does not seem to matter at all after the 1993-grant reform. There is hence no evidence supporting that where you live has become more important for school resources.
We were also interested in examining whether the way grants arrives (tar-geted or general) matter for the municipalities spending decisions. We find this to be the case for the teacher-pupil ratio but not for per pupil spending; the less targeted grants are, the less will be spent on the number of teachers. We also find that during the period with decreasing grants (1993–95) grants have no sta-tistically significant effects on either per pupil spending or the teacher-pupil ra-tio. One explanation for the lack of effects during the period with decreasing grants could be that municipalities react asymmetrically to increases and de-creases in grants, something that is also found by Karlsson (2006).
Finally, our results for local preferences are less clear cut. The political ma-jority in the municipal council, if anything, matters less after the decentraliza-tion than before, which is strange given the low degree of local impact possible before the decentralization. There are however two reasons why it might be hard to estimate effects of preferences. First, since we in the model control for municipality specific fixed effects, our preference-variables do not capture pref-erences that are constant across time. Second, there are only elections every
third or fourth year in Sweden, implying that political majority and female rep-resentation does not vary over every year.
Was the Swedish decentralization of compulsory schooling successful or not? There are at least two ways to interpret the results in this paper giving two very different answers. The optimistic interpretation would be that Sweden, thanks to an ambitious equalizing grant system and a common curriculum, man-aged to decentralize schooling without making education more unequally dis-tributed. The pessimistic answer would be that not much happened when the school sector was decentralized and that the municipalities just continued to do business in the same way as during the centralized regime. Before being able to choose between these two answers, more work is called for. For example, it could be the case that the allocation of school resources within the school sector has become more efficient after the reforms. We hence need more research fo-cusing on efficiency aspects, which unfortunately is not trivial. Also, it is per-haps in the allocation within the school sector that municipalities start to differ after the decentralization reforms. Studying the allocation of resources within the school sector should therefore be on the top of the future research agenda.
References
Ågren, H, M Dahlberg & E Mörk (2007) “Do Politicians’ Preferences Corre-spond to those of the Voters? An Investigation of Political Representation”,
Public Choice, vol 130, pp 1–2.
Ahlin, Å (2003) “Does School Competition Matter? Effects of a Large-Scale School Choice Reform on Student Performance.” Working Paper 2003:2, De-partment of Economic, Uppsala University.
Alesina, A, N Roubini & G Cohen (1997) Political Cycles and the
Macroecon-omy, MIT Press, Cambridge.
Björklund, A, Edin, P-A, Fredriksson, P & A Krueger (2004), Education,
Equality and Efficiency – An analysis of Swedish School Reforms During the 1990s, Report 2004:1, Institute for Labour Market Policy Evaluation (IFAU),
Uppsala.
Boadway R & E Mörk (2004) “Division of Powers”, in P Molander (eds) Fiscal
Federalism in Unitary States, Kluwer Academic Publishers.
Card, D & A A Payne (2002) “School Finance Reform, the Distribution of School Spending and the Distribution of SAT Scores” Journal of Public
Eco-nomics, vol 83, pp 49–82.
Conceição, P & P Ferrera (2000) “The Young Person’s Guide to the Theil In-dex: Suggesting Intuitive Interpretations and Exploring Analytical Applica-tions”, UTIP Working Paper 14.
Hines, J & R Thaler (1995) “Anomalies: The Flypaper Effect”, Journal of
Eco-nomic Perspectives 9, vol 4, pp 217–226.
Hoxby, C M (2001) “All School Finance Equalizations are not Created Equal”
Quarterly Journal of Economics, vol 116, pp 1189–1231.
Karlsson, M (2006) “Do Municipalities Respond Asymmetrically to Changes in Intergovernmental Grants? Empirical Evidence from Sweden”, mimeo, De-partment of Economics, Uppsala University.
Manwaring, R L & S M Sheffrin (1997) “Litigation, School Finance Reforms and Aggregate Educational Spending” International Tax and Public Finance, vol 4, pp 107–127.
Mills J A & S Zandvakili (1997) “Statistical Inference via Bootstrapping for Measures of Inequality” Journal of Applied Econometrics, vol 12, pp 133–150. Murray S E, W N Evans & R M Schwab (1998) “Education-Finance Reform and the Distribution of Education Resources” American Economic Review, vol 88, pp 789–812.
Oates, W E (1972) Fiscal Federalism, Harcourt Brace Jovanovich, New York. OECD (1998) Education at a Glance. OECD Indicators 1998, Paris: OECD, Centre for Educational Research and Innovation.
Silva, F & J Sonstelie (1995) “Did Serrano Cause a Decline in School Spend-ing?” National Tax Journal, vol 48, pp 199–215.
Svaleryd H (2002) ”Female Representation – Is it of Importance for Policy De-cisions?”, Working Paper 2002:7, Department of Economics, Stockholm Uni-versity.
Winkler, D R & T Rounds (1996) “Municipal and Private Sector Response to Decentralization and School Choice” Economics of Education Review, vol 15, pp 365–376.
Appendix
The variables used in this paper are defined in the following way: Per pupil spending:
Cost per pupil attending public school in the municipality, excluding costs for premises and school transports, SEK (2001 prices).
Teacher-pupil ratio:
Number of full-time teachers per 1,000 pupils. Tax base:
Taxable income in the municipality, 100 SEK per capita (2001 prices). Grants:
Intergovernmental grants from the central government, 100 SEK per capita (2001 prices).
Left-wing majority:
A dummy variable taking the value 1 if the social democrats and the left party have more than 50 percent of the votes in the municipal council.
Female representation
Percent of the representatives in the municipal council that are women. High education:
Percent of the population with tertiary level education.
Population share 7–15 years:
Percent of the population older than 6 and younger than 16. Welfare recipients with children:
Number of households with children on welfare, per capita. Share school-aged children born abroad:
Percent foreign citizens among people aged 7–15. School size:
Number of students per school. Unemployment
Table A1 Summary statistics
Variable Mean St dev Min Max
Per pupil overall 42,421 5,768.5 28,052 75,816
spending between 3,818.2 36,342 64,844
within 4,320.5 23,545 63,499
Teacher-pupil overall 84.10 11.12 59 178
ratio between 6.46 73.50 127.86
within 9.06 51.24 134.24
Tax base overall 933.04 165.86 591.04 2,300.0
between 120.55 728.09 1,760.6 within 114.13 603.89 1,472.5 Grants overall 92.22 40.416 -114.27 289.97 between 36.14 -6.62 214.67 within 18.34 -15.42 195.05 Left-wing overall 0.385 0.487 0 1 majority between 0.423 0 1 within 0.241 -0.401 1.17 Female overall 37.71 7.25 11.11 54.90 representation between 4.87 21.90 48.45 within 5.38 22.21 50.66
High education overall 11.70 5.07 4.45 42.66
between 4.80 6.45 35.51 within 1.64 0.926 18.85 Population overall 11.61 1.29 6.46 16.61 share 7–15 between 1.05 6.93 15.39 within 0.761 9.81 14.24 Welfare overall 0.094 0.037 0.0006 0.267 recipients between 0.026 0.024 0.187 with children within 0.027 -0.013 0.184 Share school- overall 4.53 3.22 0 32.04 aged children between 2.99 0.542 29.47
born abroad within 1.19 -1.79 9.96
School size overall 185.72 61.71 56.00 441
between 58.08 75.90 337.62
within 21.37 53.86 364.47
Unemployment overall 4.91 2.73 0 13.80
between 1.34 1.85 10.02
Note:Per pupil spending is given in SEK (1 SEK equals 0.11 euros or 0.15 USD), tax base and grants are measured in 100 SEK per capita and teacher-pupil ratio in number of full-time teachers per 1,000 pupils. The between is given by
x
i, and the within coun-terpart by xit−xi+x.Table A2 Tests of equal means in 1992
Mean (not
report)
Mean
(report) t-value P>t Per pupil spending 42,082 42,480 -0.70 0.48
Teacher-pupil ratio 94.51 94.96 -0.39 0.69 Tax base 866.62 863.86 0.19 0.85 Grants 129.13 127.23 0.36 0.72 Left-wing majority 0.231 0.240 -0.17 0.86 Female representation 33.01 33.87 -1.02 0.31 High education 10.47 10.57 -0.17 0.86 Population share 7-15 10.89 10.88 -0.059 0.95 Welfare recipients with children 0.100 0.107 -1.66 0.099 Share school-aged children born abroad 4.95 5.09 -0.32 0.75 School size 178.90 171.394 1.06 0.29
Unemployment 5.68 5.67 0.07 0.95
Note: Mean (not report) denotes the mean values for the municipalities that did not report figures for 1989– 91, Mean (report) denotes values for the municipalities that did. The t-test test the null that the means are equal for the two groups (i.e. mean (not report) = mean (report). A p-value larger than 0.05 indicates that we cannot reject the null of equal means at the five percent level.