SICS Technical Report T2007:02
ISRN:SICS-T–2007/02-SE
ISSN 1100-3154
Entropy injection
by
Lars Albertsson
2006-08-25
lalle@sics.se
Swedish Institute of Computer Science
Box 1263, S-164 29 Kista, Sweden
Abstract:
Testing is the predominant software quality assurance method today, but it has a major flaw — it cannot reliably catch race conditions, intermittent errors caused by factors that cannot be controlled during testing, such as unpredictable timing behaviour in concurrent software.
We present entropy injection, a extension of traditional test methods, which enable developers to create tests for arbitrary types of race conditions in any software application, reusing the application’s existing test cases. An entropy injector runs the software under test in an instruction set simulator, where all factors that normally are unpredictable can be explicitly controlled. The injec-tor provokes race condition defects by artificially changing the timing behaviour of the simulated processors, hardware devices, clocks, and input models. Pro-voked defects can be debugged by developers in a non-intrusive, programmable debugger, which allows race condition defects to be reproduced and provides access to all software state in a distributed system. Developers can use its ser-vices to create application-specific injection strategies and directed regression test cases that monitor application state and test specific interleavings of events. Our proof-of-concept entropy injector implementation Njord is built on Nornir, a debugger environment based on the complete system simulator Simics. Njord provokes test case failures by suspending simulated processors, thereby injecting delays in the processes in a concurrent application. We demonstrate Njord on a small test routine, and show how a developer can write a race condition regression test that triggers errors with very high probability, or provoke errors with good probability without using application knowledge.
Keywords: entropy injection, noise making, race condition, complete system simulation, full system simulation, Nornir
1
Introduction
In the early days of computing, almost all programs were functional — the pro-grams read data, performed a computation, and produced output data. Pro-gram output depended only on the input data. We call this functional behaviour or determinism, and it implies that program executions are reproducible. It is a very convenient property from a quality assurance perspective. If a developer can assume that a certain input data set results in the same output data for every execution, he only needs to execute a certain test scenario once in order to ensure that the scenario will work properly when the program is put in pro-duction. Reproducibility is also an unusual property in engineering. In other engineering disciplines, one cannot safely assume that a particular test execu-tion is representative for all test execuexecu-tions with a certain input. The result of running a product test of a physical product or machine is also determined by factors that cannot be completely controlled, such as temperature, moisture, material fatigue, exact timing, fuel quality, corrosion, etc.
Reproducibility allows software developers to use test case based testing with automated regression test suites as the primary defect detection method. When a defect has been detected, the developer debugs the failing scenario and understand the defect in order to correct it. The execution of a functional com-puter program can usually be observed without affecting the result, e.g. by using a symbolic debugger, or inserting print statements. This is referred to as non-intrusive debugging/observation, or absence of probe-effect. If a defect in a deterministic program can be non-intrusively observed, it can be debugged by repeating the program execution, each time obtaining more information about the erroneous behaviour. Eventually, the developer will trace the error symp-toms back to the error source. This procedure is called cyclic debugging.
Regression testing in combination with cyclic debugging is cost-effective, in comparison to other quality assurance methods in engineering. It is therefore the predominant software quality assurance method today.
Software has changed, however, and most programs today are nondetermin-istic and cannot be fully observed and debugged without affecting the execution. Traditional test methods allow test engineers to control most factors that affect execution, such as input data and hardware and software environment config-uration. Some factors, for example process scheduling order and input arrival times, are typically outside the testers’ control. Software applications therefore have intermittent defects caused by such uncontrollable execution factors. The most common type of intermittent defect is race conditions, defects dependent on uncontrollable timing factors. Since we have no cost-effective method for detecting race conditions, they are common in production software.
Race conditions are becoming increasingly common as computer systems be-come more concurrent and asynchronous. The drift towards more concurrent computer systems is gradual but inevitable. It started early in the history of computing, with the introduction of asynchronous hardware services, such as imprecise traps, and with reactive programs, which receive new input data dur-ing execution. Programs that receive interrupts or input data asynchronously
become sensitive to arrival times and ordering of interrupts and input data, and are therefore not deterministic. The nondeterminism in computer systems has continued to increase with the introduction of multitasking operating systems, multiprocessor machines, and networked computers. Recently, the processor vendors have unanimously concluded that it is not worthwhile to spend more efforts and silicon on improving single-thread performance. Instead, they put multiple processor cores on each chip. This change in technology will force soft-ware vendors that care about performance to write parallel softsoft-ware, and to convert their existing sequential software. Developing parallel software is in-herently difficult, and race conditions are frequently introduced in the process. The proliferation of multicore processors will therefore drastically increase the need for test methods that are capable of detecting race conditions.
Most previous research in race condition detection has focused on detecting data races in homogeneous shared memory programs. There are tools that either analyse and report suspicious memory access behaviour, or control the behaviour of a single normally uncontrollable factor, e.g. process scheduling, and apply heuristics to explore new scheduling interleavings. Existing methods are able to detect some race conditions, but leave some factors uncontrolled, and do not achieve full reproducibility.
Entropy injection, described in this paper, is a simulation-based test method where all factors affecting test execution are explicitly controlled. Its main purpose is to provide means for developers to create directed regression test cases for detecting all classes of race condition defects. An entropy injector artificially changes timing and interleaving of events in the simulated system, and enables race condition defects to be reliably caught within the traditional test and debug process, something that has previously not been possible for software in general purpose computer systems. An entropy injector is built on a holistic debugger [Alb06b], a programmable debugging environment that provides non-intrusive access to all software state in a distributed system, and developers can use the holistic debugging services to create race condition stress tests (aka noise makers) guided by application-specific monitoring. Moreover, entropy injection places minimal requirements on the application under test, and is applicable for testing all types of applications, including distributed systems with heterogeneous hardware, operating systems, middleware, and programming languages, and for detecting errors involving multiple abstraction layers. We will mostly use simple shared variable accesses as examples; they are simple to explain and easy to reason about. The reasoning does not assume shared storage, however, and applies equally well to similar scenarios in all classes of systems.
We have built a proof-of-concept entropy injector, Njord, in the holistic debugging environment Nornir, which is based on the complete system simulator
Simics [MCE+00]. We demonstrate Nornir with a unit test of a simple routine,
and show how unguided random injection has little effect, whereas injection strategies that monitor application progress or targets a specific known bug provoke defects with high probability.
condition taxonomy in the next section. Nornir and holistic debugging will be described briefly in Section 3 and entropy injection is described in Section 4. Section 5 contains a description of Njord and the simple demonstration. Related work is described in Section 6, some discussion regarding entropy injection as a method in Section 7, and conclusions in Section 8.
2
Race conditions
There are a number of different definitions of race conditions (or races for short). In this paper, the most general definition the author was able to find will be used: “A condition in which two or more actions for an operation occur in an undefined order” [MBKQ96]. In other words, a race condition occurs in a concurrent system when two (or more) processes (A and B) race towards some points in their execution (Ac and Bc, respectively). No program construct controls whether Ac or Bc occurs first, and the execution path and the result of the program depends on the outcome of the race. Hence, a race condition makes the program execution and its results nondeterministic. Processes participating in a race need not be computational processes that execute instructions, but may also be other processes contributing to system progress, such as communication channels or clocks.
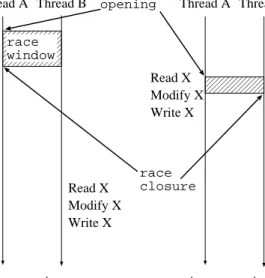
A race condition is born when some event in program execution happens and creates the race between A and B. We will call this event the race opening. It is usually the execution of an instruction in either A or B, but not necessarily. The opportunity of a race exists until either Ac or Bc occurs. We will call the event that either Ac or Bc happens the race closure, and the period of time between race opening and race closure a race window. Race windows are often short, and one closure is often much more likely than other closures. We will call this closure the common race closure. The common closure does usually not cause a program error — if it did, the developer could easily fix the error. We will call less likely closures uncommon race closures, or erroneous race closure if they cause an incorrect execution of the program. An erroneous race closure is also called triggering a race condition, since in many texts concerning race conditions, the uncommon closure is assumed to be erroneous. We will use the term race event as a common name for all events affecting race conditions. An execution of a concurrent system can be specified as the initial system state, the input to the system, and the interleaving of race events.
A race condition can involve more than two processes. In order to keep the examples simple, we will only describe races between two processes in this article. The reasoning and methods described in the article apply to any number of racing processes, however.
A common form of race condition is a data race [SBN+97, AHB03], which
occurs when processes access a variable in shared memory without using a syn-chronisation mechanism that prevents simultaneous access, and at least one of the access operations is a write. In the example illustrated in Figure 1, two processes race to increment a shared variable X with a load, an increment, and
Read X Modify X Write X
a: common closure b: uncommon closure
race opening race closure Read X Modify X Write X Read X (Bc) Modify X Write X Thread B
Thread A Thread A Thread B Read X
Modify X Write X (Ac)
race window
Figure 1: Data race.
a store instruction. The race window opens when a process executes the load instruction. The common closure occurs when the same process executes the store instruction. The uncommon closure occurs when the other process exe-cutes the load instruction (which opens another race as the processes race to the store instruction).
Some previous attempts to define race conditions are unnecessarily restricted to data races [NM92, HM94]. This is understandable, as data races is the only type of races that has received significant research attention. In this paper, we will instead use the broader definition above of racing processes connected in an arbitrary manner, which is applicable also to distributed systems without shared storage, and to race conditions that include non-computational processes.
2.1
Malign and benign races
A race condition is not a defect in itself. Most programs have expected non-deterministic behaviour. For example, in database applications, it is common to have multiple processes racing to commit transactions, and in multithreaded programs, threads often race to acquire locks. In these cases, all possible execu-tion path resulting from a race condiexecu-tion are correct execuexecu-tions of the program. We will call these types of races benign races. In other cases, one of the exe-cution paths leads to incorrect application behaviour. We will call such race
conditions malign races.1
1
Helmbold and McDowell [HM94] use the term critical races, which the author considers somewhat misleading.
There is no generally applicable method for distinguishing a malign from a benign race. Whether an execution path is correct or not is subjective. The most popular form of distinguishing correct execution paths from incorrect paths is to run test cases and check the result. The race detection method we present therefore assumes that the application developer supplies test cases and some mechanism for detecting incorrect executions. This requirement is typically easy to fulfill, since applications with quality requirements tend to have automated regression test suites, which can be used without modification.
There are classes of races that are uncommon in correct programs, and it makes sense to construct tools that report such races as potential programming errors. Tools for detecting unsynchronised accesses to shared data are discussed in the related work section 6.
Figure 2 illustrates pseudo code for a simple race condition that is neither obviously benign or malign. The output of the program will be “6” on most executions, but can also be “5”, although it is unlikely. If “6” is the only expected output from this application, the race condition is malign, whereas it is benign if 5 is also an acceptable output. If we assume that the expected output is “6”, and the race is malign, this example has two important properties: there is no concurrency pattern that can be identified as anomalous (the program uses correct synchronisation), and there is no result that can be easily identified as erroneous (classifying an incorrect execution requires an external oracle and a test harness). Many race conditions in industrial software have these two properties.
2.2
Classes of race conditions
Computer programs execute synchronously and deterministically most of the time. In order for a race condition to occur, there must be some nondeterminism, asynchrony, or concurrency present. Nondeterminism in computer systems can either come from the program itself, the underlying system, or from the external environment. We can classify causes for race conditions in the following groups: Program concurrency Modern programs are often divided into multiple threads or processes on one or more physical machines. If these processes communicate, the program result becomes dependent on the scheduling between these processes, and on the arrival times of messages sent between them. The process communication can be explicit messages sent between the processes, or accesses to shared storage, such as main memory, files, database tables, tuple spaces, etc.
System nondeterminism There are various system services that have non-deterministic or timing-dependent behaviour. These fall into the following subcategories:
Asynchronous input/output Non-blocking and asynchronous I/O ser-vices depend on the availability of input data or free buffers, and produce different results depending on communication speed, which
lock L; integer val; a() { do_small_amount_of_work(); acquire(L); val += 1; release(L); } b() { do_lots_of_work(); acquire(L); val *= 2; release(L); } main() { val = 2; t1 = thread_create(a); t2 = thread_create(b); join(t1); join(t2); print(val); }
Figure 2: Example program with nondeterministic output.
is unpredictable. Services that poll for I/O completion, such as the
selectand poll system calls also fall into this category.
Interrupts Services that interrupt normal execution, such as hardware interrupts and Unix signals, may arrive at any point in execution, and therefore cause nondeterminism.
Unpredictable system services Some system interfaces have nonde-terministic results by definition. Some examples are entropy-based random devices (e.g. /dev/random in Linux), clocks, and operating systems with randomised address layout.
Run-time system execution Underlying run-time systems, such as Java virtual machines, are designed to be mostly transparent, but in some cases, their execution can be observed by the software running in the virtual machine. For example, garbage collectors can affect applications at arbitrary points in execution, since they invalidate weak references and cause finaliser routines to execute. Moreover, virtual machines with dynamic optimisation can change the program code during execution if either the optimiser or the application has defects.
from a software perspective, other hardware devices are not. De-vices that perform direct memory access (DMA) can change memory contents at arbitrary points in execution. The memory system itself is asynchronous, and in a multiprocessor machine that provides a weak memory consistency model (which most high-end multiproces-sors do), the cache coherence protocol may reorder memory opera-tions nondeterministically.
Environment nondeterminism Modern computer programs are reactive and interact with the outside world, which is unpredictable in nature. Input may appear at any time and in any order, and if the program ei-ther receives interrupts when input arrives or polls for available input, the arrival time and order affects execution. Moreover, high-availability applications also need to handle faults in the services that the environ-ment provides, for example hardware faults, timeouts, and communication errors. These may appear at any time during execution.
Although many of the examples mentioned above refer to low-level services, nondeterminism and asynchrony appear at all abstraction levels, and can gen-erally not be avoided. Some asynchronous constructs, for example variables in shared memory, are results from design or implementation decisions. They can be circumvented with a different design, or by serialising the implementation at a loss of performance. In many application scenarios, however, the problem itself is concurrent and cannot be serialised. For example, an online store must be able to serve multiple customers simultaneously; it is not acceptable to seri-alise the implementation by having new customers wait until the first customer has decided what items to buy.
2.3
Regarding the likelihood of triggering a race condition
Time spent executing a race window is usually small in comparison to time spent outside race windows. If the race window is large, it can be triggered easily during testing, and developers can debug and correct the program with reasonable effort.
Figure 1a illustrates the typical execution scenario of a race condition — the race window opens by a process and closes shortly thereafter by the same process, and the likelihood that the race will be closed by another process and get triggered is very small. In the case of a typical data race, there is a read-modify-write sequence on each process, and the erroneous race closure only triggers if a read from another process takes effect between the read and the write. The race window is often small; in this data race example, the race window is only a few instructions long. In contrast, the number of instructions executed between the race windows is counted in billions or trillions. Hence, the likelihood of an erroneous race closure is very small. One might think that the
probability of triggering an erroneous closure would be on the order of 10−9 to
10−12. Under some circumstances, however, the erroneous closure probability
As an example of a situation where the probability of an erroneous data race closure becomes higher than usual, assume that the code in Figure 1a runs on a large shared memory multiprocessor computer. If variable X is frequently read by most nodes in the system, the data caches of most processors are likely to contain the cache line corresponding to X in shared state in a MOSI cache coherence protocol, i.e. most processors have the permission to read variable X. When a processor enters the read-modify-write sequence, the load instruction is processed quickly, since the load memory operation is a cache hit. The store instruction, however, cannot be committed until the processor obtains the cache line in owned state in MOSI. If many other processors store the cache line in shared state, it may take a long time for the processor to receive write per-mission to the cache line, perhaps on the order of thousands of cycles. Hence, the probability of an erroneous race closure increases with several orders of magnitude.
Another example where erroneous closure probability increases is when the process executing the race window has to wait during window execution, for example due to an I/O request or a cache miss. As an extreme case, consider again the tiny race window in the read-modify-write sequence. If the sequence of instructions happens to cross a virtual memory page boundary in the machine, it may happen that the second memory page is absent from main memory and resides on disk. Since a disk request requires tens of milliseconds, the race window widens with about seven orders of magnitude.
Cache misses at various levels can also cause synchronisation among threads, which can increase erroneous closure probability. Consider the case where both processes in Figure 1 read the same file before executing the read-modify-write sequence. If the file is absent from the file system cache when the first process enters the sequence, it has to wait for it to be retrieved from disk. If the second process executes the file read operating during this wait period, it will also wait, and both processes will wake up when the file has been retrieved. Hence, the processes will execute the read-modify-write sequence at approximately the same time, which increases the probability of uncommon closure.
The bottom line of this section is that although erroneous race closures are very unlikely in the most common scenarios, there are plausible scenarios where they suddenly become likely and may affect software operation. These scenarios cannot easily be predicted, and preproduction software testing can therefore only catch a small fraction of the malign race conditions in an application. They instead appear in production scenarios, when the software experiences new load patterns, or is simply struck with bad luck, for example if race windows are placed on virtual memory page boundaries. Malign race conditions can be very expensive when experienced in production software, and there is therefore an incentive for spending resources on detecting them during testing, even though they are unlikely to appear in a given scenario.
3
Nornir
Nornir is a test and debug environment designed for all classes of applications, but focused on applications that have properties that make them difficult to debug with traditional tools: concurrent, distributed, reactive, real-time, and heterogeneous applications. Traditional quality assurance tools have fundamen-tal limitations that prevent them from being applicable from these application classes, and from scaling to complex applications:
1. All factors affecting execution cannot be controlled, as discussed above. Therefore, intermittent defects often remain undetected in production software.
2. Test executions are not reproducible. Hence, even if an intermittent defect surfaces during testing, it cannot be reproduced and debugged.
3. The act of debugging and observing the system changes system behaviour. This is called probe effect [Gai85] and has limited the power and popularity of debuggers.
4. Traditional debugging tools only operate on a single process, at a single abstraction layer, whereas the application logic may be spread over mul-tiple processes and abstraction layers, and written in mulmul-tiple languages. Item one and two are consequences of computer vendors’ design decisions to build asynchronous and nondeterministic computers — exact instruction execu-tion times, and in some cases the results as well, are not architecturally specified. Item three (and therefore also two) is a consequence of implementing observa-tion facilities in the same system as the observed software. Item four is a side effect of items two and three. It does not make sense to build and use scalable debugging tools if the underlying observation services are unpredictable, and if increased usage of observation services causes degradation in the accuracy of observation due to probe effect.
Nornir therefore runs the software under test in a artificial, separate environ-ment — an instruction set simulator, which is not affected by items 1–3 above. It is therefore a suitable base for building testing and debugging tools, and for creating scalable and automated debugging environments.
From a testing perspective, Nornir has a few unique properties:
• In Nornir, a failed test run can be reproduced and debugged with a variant of the GNU debugger that does not affect the execution. Developers can also write debugging routines that verify internal application state using holistic debugging services, described in Section 3.2.
• Since a simulator is implemented in software, the simulation model can be modified easily, and all factors affecting program execution can be con-trolled by the test engineers and regarded as test input to the application. In this paper, we show how testers can control ordering of all events, in-cluding those with undefined ordering. Similar techniques can be used for
controlling time flow, occurrence of faults, unusual responses from hard-ware or softhard-ware services, etc.
• All software state can be observed from a programmable environment, as described in Section 3.2. This increases debugging efficiency, since developers can write debugging routines that validate internal state, and these can later be reused by other team members. It is also useful for writing white-box regression tests that compare internal state in different parts of a distributed application, and for steering test input based on the internal state of the application. Guided entropy injection, described in Section 4, is an example of such steering.
3.1
Instruction set simulation
A discrete event simulator makes simulation progress by processing events; in an instruction set simulator, the most common event is the execution of the next instruction. The simulator has a time model, and for each instruction processed, the simulated time is increased according to the time model. Time is quantified, and we call the smallest representable time unit a simulation cycle or simply a cycle. A cycle has a static time length, which often matches the period of a simulated processor, e.g. 10 ns for a 100 MHz processor. In this article, we will, unless otherwise noted, assume a simple time model, where each instruction requires a single cycle and memory operations execute instantaneously.
There are also other types of events that are processed and contribute to simulation progress. These are posted in event queues and processed when simulated time reaches the value corresponding to each event. Models for simu-lated non-processor entities use event queues to schedule the model processing for hardware devices, input and environment models, communication devices, and fault models.
3.1.1 Complete system simulation
Instruction set simulators have suitable characteristics to serve as debugging platforms: they provide models that are detailed enough for running applica-tions in binary form, but still run sufficiently fast to run large applicaapplica-tions. We
have built Nornir on Simics [MCE+00], a complete system simulator (also called
full system simulator). A complete system simulator has models for all hardware devices that provide services visible to software, i.e. processor, memory, disks, network cards, etc. It is binary compatible with general purpose computers, and runs unmodified commodity operating systems and applications in binary form.
Simics can simulate multiprocessor machines and multiple networked com-puters, which may be heterogeneous in architecture. It is designed to be deter-ministic; if a simulation scenario starts in a well defined simulation state, and the input model is synthetic and predictable, it will produce exactly the same scenario for each simulation.
Simics runs roughly two orders of magnitude slower than the host machine when modelling a machine similar to the host. It is slow enough to be a sig-nificant drawback for simulation as a method, but fast enough to allow large applications to be observed. The simulation speed depends on the accuracy of the timing model. We usually run with a coarse model, where every instruction takes one clock cycle. This model is sufficient for detecting logical errors, which is the scope of this article. If the simulator should be used for performance analysis, a more accurate timing model may be desirable. Simics allows users to model cache memory hierarchies, providing a good timing approximation with-out sacrificing much simulation performance. It also supports detailed models of processor pipelines, out-of-order execution, and speculative execution, at the price of severe performance degradation. Magnus Ekman’s dissertation [Ekm04] contains some benchmarks on Simics with different timing models. Complete system simulator timing models have been validated and discussed by Gibson
et.al. [GKO+00].
Simics has two performance features that reduce the cost of simulation in many scenarios. First, the entire state of the simulated system can be stored to disk in a checkpoint and later retrieved. This feature may cut down exe-cution time in scenarios where the test setup is costly, but may be reused for multiple tests. Simics also performs idle loop detection, and fast forwards pro-cessors waiting in the operating system’s idle loop to the next asynchronous event. This improves simulation performance for I/O-bound workloads and many distributed application scenarios.
A complete system simulator allows users to control all types of nondeter-ministic behaviour mentioned in Section 2.2, either through services exported by the simulator, or by developing simulation model extensions. The Simics configuration used for the demonstrations below uses standard Simics device and clock models, and a sequentially consistent memory model.
3.1.2 Time and clocks
If the simulated system has multiple processors, the simulator executes instruc-tions on the processors in a round-robin order. Hence, the resulting simulation is a serialisation of the concurrent execution of a distributed application. In a simple simulator implementation, there will be a single simulated clock, and each processor will execute at most one instruction in each simulation cycle. If the processors have different frequencies, or if some instructions take more than a cycle, some processors will stall in some of the cycles. Simulating all pro-cessors each simulation cycle, however, has negative implications on simulation performance, as it prevents some efficient implementation techniques. There-fore, in an efficient simulator implementation, the simulator will execute a large number of instructions on one processor before switching to another processor. This simulated time period is called a time quantum, and is often on the order of a thousand cycles or more. In such an implementation, each processor has its own clock, and the clocks temporarily drift apart, at most a time quantum. If the time quantum is small, software will not notice that there is a slight
drift between the processors. If the time quantum is large, on the order of seconds, and if multiple simulated clocks can be observed by software, it is possible to write programs that observe time going backwards. In such scenarios, the simulator may induce incorrect software behaviour, but these situations are fortunately rare.
Software running outside the simulated world, such as device models and observation software, can also observe multiple simulated clocks, which are tem-porarily unsynchronised. Hence, when writing such software, one needs to be careful and ensure that the software can handle decreasing time values. When developing Nornir, we have several times noted that it is easy to make a mistake and assume that clock readings always provide increasing values. In order to simplify implementation of observation software, we have introduced two arti-ficial clocks: head clock and tail clock, and the corresponding time scales head time and tail time. The head clock value is the largest value of all simulated clocks, and the tail clock value is the smallest simulated clock value. These artificial clocks are monotonically increasing, and are therefore simpler to use than dealing with multiple unsynchronised clocks tied to processors.
3.1.3 Memory consistency
A simulated symmetric multiprocessor machine with a shared main memory
im-plements a sequential memory consistency by default.2 The processors directly
access a single image of main memory, and the interleaving of memory transac-tions follows the interleaving of simulated processor execution. If the simulated machine includes a model of a cache memory hierarchy, the cache model typ-ically only affects the time model, and does not model consistency effects of data caching; the memory transactions still go directly to main memory, but the instruction requires more than a single cycle.
A simulated machine with a sequential consistency model is insufficient if a developer wants to test whether a shared memory application works correctly in the presence of memory transaction reorderings on a multiprocessor machine with a weak memory consistency. In order to test for software defects result-ing from memory transaction reorderresult-ing, one needs to implement a memory consistency model where processors observe different memory images. Imple-menting such a memory consistency model is possible if the simulator allows user extensions to intercept and modify memory transactions. Such a model could be created by improving upon an existing time model that implements a realistic cache coherency protocol model, and make it also serve processors with cached data. An alternative approach would be to add reorder buffers to and/or from processors and any shared caches. These buffers could stall and reorder data according to the architectural memory consistency model for the
2
Actually, simulated multiprocessor machines provide an even stronger consistency model, linearisability (with respect to a monotonically increasing global time, i.e. head time, tail time, or time on a single processor). Software in the simulated system cannot distinguish between sequential consistency and linearisability, however, and it is hard to come up with a simulated scenario where it makes a difference, so the issue is mostly of academic interest.
simulated machine. This could result in a complex implementation in the gen-eral case, for relaxed consistency models. Stronger consistency models, such as total store order (TSO) could probably be modelled with few and simple reorder buffers, however. In the case of relaxed memory consistency models, it may be more straightforward to use a separate copy of the entire main mem-ory for each processor, and have reorder buffers that stall modifications from other processors before they modify each processor’s main memory. Simics does provide the necessary services to intercept and modify memory transactions, and also a memory consistency controller, but the author is not aware of any instruction-set simulator implementations of weak memory consistency models for the purpose of software testing, and this area is future work.
3.2
Holistic debugging
Nornir is a framework designed for programmable, non-intrusive observation of all system state that is visible to software, even in complex and distributed sys-tems. We call such an observation environment a holistic debugger [Alb06b]. A holistic debugger does not assume any properties of the system under test, ex-cept that it must be feasible to simulate the hardware and external environment (e.g. interactive users, sensor input). It assumes nothing about the software, and supports non-intrusive debugging and comparisons of execution state in multiple programs, written in different languages, at multiple abstraction lev-els, running in multiple, heterogeneous computers, etc. Our implementation is of course limited to a few configurations for practical reasons, but the concep-tual method is free from the inherent limitations of traditional debugging and analysis methods.
A complete system simulator provides non-intrusive access to all system state visible to software. Unlike standard debuggers, which use probing services sup-plied by the runtime system to probe the state of running processes, the holistic debugger must use non-intrusive probing techniques, and cannot rely on runtime system services. It probes the simulator for machine state, but the information retrieved is raw, binary information. The information has been obfuscated by symbolic transforms, i.e. compilers, and by machine transforms, i.e. virtual machines and operating systems, and it is no longer easily comprehensible. In order to make this information useful for a programmer, it must be translated back to the abstraction level the programmer deals with, i.e. to variables and types in the programming languages used in the application.
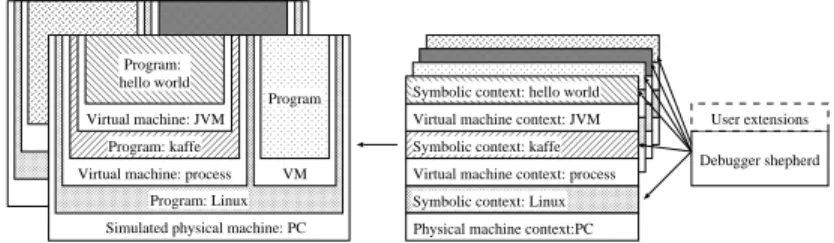
In a holistic debugger, there is an associated abstraction translation stack for each inspected process in the simulated system. A translation stack con-sists of symbol context probes and machine context probes, corresponding to the language environments and virtual machines of the inspected process. The structure is shown in Figure 3. When the user inspects a particular program, a translation stack is instantiated. The top of the stack is a symbolic probe that lets the user inspect the execution and state of the program, similarly to a standard debugger. The symbolic probe queries the underlying machine con-text probe for program state data. If the machine concon-text refers to a physical
Program: Linux Simulated physical machine: PC Virtual machine: process
Program: kaffe Virtual machine: JVM Program: hello world VM Program
Symbolic context: Linux Virtual machine context: process Symbolic context: kaffe Virtual machine context: JVM Symbolic context: hello world
Debugger shepherd User extensions
Physical machine context:PC
Figure 3: Holistic debugger structure with example applications. machine, the machine context probe forwards the query to the simulator. If the machine context below is a virtual machine (e.g. a Java Virtual Machine or a Unix process), however, the corresponding machine context probe is a virtual machine translator (VMT). The VMT parses the virtual machine’s data struc-tures, and maps virtual machine storage to storage in the underlying machine. This parsing is done through the symbolic context probe for the underlying program providing the virtual machine.
Nornir supports debugging applications in simulated Sparc/Linux systems, written in a language supported by GDB. GDB acts as symbolic probe for the applications. GDB requires a backend service that allows it to control and probe a single Linux process. It therefore communicates with a Linux VMT that translates GDB’s requests for virtual memory and register contents to the cor-responding physical memory and registers contents, which are retrieved from Simics. Breakpoints and other basic debugger services are handled similarly. The VMT also exports services for suspending execution on events that are not tied to a specific process, for example the start of a particular application or arrival at a certain point in time. We call such generic breakpoints eventpoints. When probing the kernel data structures, the VMT uses a static symbolic trans-lator, a set of automatically generated classes that contain methods for parsing kernel data structures in binary form. There is one such class for each type in the kernel, and the static symbolic translator thereby provides a robust, strongly typed programmable probing system for the kernel.
Abstraction translation stacks enable users to probe software state at arbi-trary level, in any process, without affecting the execution. In order to debug a distributed application, the user can attach a symbolic debugger to each partic-ipating process, or write automated debugging routines. In a holistic debugger, all symbolic probes are connected to a debugger shepherd, a programmable global debugger that allows debugging routines to probe the state of the entire system. Nornir’s debugger shepherd, Verdandi, is written in Python and pro-vides a Python programming interface. It creates an instance of GDB for each process the user wishes to monitor. The user validates internal state by writing monitoring routines, called causal path monitors, that observe a data flow path by waiting for a set of eventpoints to trigger, probe application state via GDB, wait for a new set of eventpoints, etc. Causal path monitors run independently of each other and concurrently. The causal path monitors can be saved an reused
in future debugging sessions, or used as white-box tests in regression testing. The user can also define application-specific eventpoints, and use causal path monitors to determine when the eventpoints should be triggered. Examples of useful application-specific eventpoints would be the arrival of a specific class of http request or an SQL query matching a specific pattern.
A holistic debugger is a program observation framework that places minimal requirements on the system under test, and it works for arbitrary distributed software systems. Nornir is a research prototype and has limited capabilities that are suited for our experiments, but the method itself makes very few as-sumptions. It assumes that it is feasible to simulate the system under test and its external input, and the holistic debugging services require a virtual machine translator for each abstraction layer involved. In practice, this requires source code access to the virtual machine, or that the virtual machine or operating system vendor supplies a translator. Source code access to all parts of the application is not required, however, and errors in binary components can be detected, reproduced, and reported to the vendor.
The holistic debugging concept and Nornir’s implementation is described in more detail in the author’s previous works [Alb06b, Alb06a].
4
Entropy injection
In order to detect race conditions during testing, one must put the software under more stress that it will experience when put into production. Trying to increase the general stress level by raising the load is not effective — it is likely that the program would execute a few set of execution paths and event interleav-ing patterns over and over again. Instead, one should strive to push the software under test to go through new event interleavings that can possibly appear when the software is put in production, but are unlikely to appear during lab testing. This is technique bears some resemblance to fault injection, a well established technique for testing high-availability features. Instead of injecting component faults that the application is supposed to handle, however, one injects timing chaos, and ensures that the application handles it gracefully. We will therefore call this technique entropy injection, and the mechanism or tool that performs the injection will be called an entropy injector.
Consider again the common data race scenario in Figure 1a. The race win-dow is small and the program is spending most of the time executing outside the race window. Hence, the uncommon closure is unlikely to occur. In order to determine whether the application executes correctly in both possible sce-narios, one should provoke the uncommon race closure, run the application to completion, and have a test oracle determine the correctness. By preventing thread A from making progress, the race window is artificially expanded and the uncommon closure is provoked, as illustrated in Figure 4. In the general case, controlling computation progress is difficult or infeasible in real computers, but with a computer system simulator, one can modify the machine model and achieve an artificial delay in the process executing the race window. How to
perform this injection in practice is described in Section 4.1. Thread A Thread B Artificial delay Read X Modify X Write X Read X Modify X Write X
Figure 4: Provoking a race condition by artificial delay injection. If the application is run in a simulator, and the location of race windows are known, one can provoke different race closures in an application, and use the test suite’s oracle to determine whether the application is correct or not. Unfortunately, developers do not know where the race windows are; if they did, it would be easy for them to correct the program. Instead, in order to test for race conditions, the locations of race windows must be guessed by the injection mechanism, potentially guided by an application developer.
Searching through the whole state space of all possible interleavings of race events is usually infeasible; the state space is too large for applications with non-trivial communication patterns. Instead, the injector inserts delays at points in execution that could be within a race window. It should avoid repeatedly testing the same potential race windows and the same interleaving patterns, and strive towards test coverage in terms of event interleaving. For example, if one wants to test for malign races resulting from interleaving of communication in a distributed application, inserting multiple delays in one process only improves coverage if the process has communicated with other processes between the delays. Hence, the injector needs a strategy in order to make educated guesses on where to insert delays that provoke application errors. Entropy injection strategies are discussed in Section 4.2.
An injector inserts delays randomly, with a pseudo-random number gener-ator. When an error has been provoked and reported by the test suite, the developer can reproduce the failing execution by using the same random seed, and debug the error in the traditional cyclic manner, either interactively with a non-intrusive symbolic debugger, or programmatically with a holistic debugger. Since entropy injection relies on the application’s test suite to distinguish correct executions from incorrect executions, there will be no false positive re-ports. Thus, even in cases where there is an apparent race condition, for example a data race where a variable is accessed without proper synchronisation, but the
application contains logic for preventing unsynchronised accesses, or if all race closures result in an execution that is deemed correct, the test suite only looks at the final result and does not produce false error reports. The absence of false positives is an important improvement over static and dynamic race condition detection tools (described in Section 6, which can only warn about suspicious concurrent program behaviour according to heuristics, and tend to produce nu-merous false positive reports.
4.1
Execution flows
In order for an injector to affect the interleaving of unsynchronised events, it can either modify the state of the software, or control the progress of simulated entities in the system. Modifying the software state is undesirable for a number of reasons: It means that the released software is not the software tested, it can complicate reasoning about test coverage, and it can make it difficult to deter-mine whether provoked errors can appear in real systems. Since all interleavings of race events that are feasible in a real machine can be provoked by controlling the progress of simulated entities in an appropriate manner, the latter method is sufficient for most test scenarios, and the one we have pursued.
The simulation model can be thought of as having multiple simulation flows, where each flow corresponds to the progress of a simulation entity. If a flow is enabled, the modelled entity performs as usual, but if the flow is disabled, the entity is stalled and makes no progress. In normal simulation, all flows are enabled and the simulation progresses as usual. An injector may disable flows in order to provoke new interleavings of machine events. The progress of a flow can affect the execution actively, for example by inserting event notifications in the event queue. It can also affect the execution passively, e.g. a modelled temperature sensor that only yields values when polled by software. For a passive flow, progress means that subsequent polls may yield different values; a disabled passive flow yields a fixed value. Simulation flows can be categorised as follows:
Processor flows There is a processor flow associated with each simulated pro-cessor. Processor flows only affect the simulation actively, by executing instructions. A disabled processor flow corresponds to a stalled processor, which is prevented from executing instructions.
Device flows Each simulated device processes requests from software and re-sponds through interrupts, direct memory access (DMA), or by memory-mapped I/O. A device flow can be both active and passive. A disabled device flow inserts no events in the event queue, and values read from its mapped memory region remain fixed.
Input flows The simulation scenario has a synthetic input model for each of the external sources of input affecting the simulation, for example human users, network sources, and temperature. Since external input is received
by the simulated computers by hardware devices, input flows overlap with device flows.
Communication flows Each communication link between nodes in the sim-ulated system has its corresponding flow. When a communication flow is disabled, the data on the link are queued and delivered when the flow is enabled again.
Clock flows The flow of time also affects simulation, and race conditions where a process races against the clock are common. Hence, a complete entropy injector should be able to achieve arbitrary interleavings with the progress of processes and the progress of simulated time. In order to achieve ar-bitrary interleavings, the simulator must be able to halt a clock while executing instructions on the corresponding processor, and to forward the clock without executing instructions.
Memory consistency flows A memory consistency flow corresponds to data transfers in the cache coherency mechanism of a multiprocessor machine. Disabling and enabling memory consistency flows affects the order in which memory operations are observed.
Fault injection flows Each simulated device with a fault injection model has a corresponding fault injection flow. Faults are only injected if the flow is enabled.
A particular class of flows can be enabled and disabled if the simulation model provides an appropriate service or allows supplying user-defined models for entities. Adding the ability to control clock flows and memory consistency flows require some support from the simulator core for an efficient implementa-tion, but controllability for the other classes of flows are easy to implement.
At each point during simulation, a non-empty set of flows are enabled. We will call such a set of enabled flows a flow configuration. An entropy injector alternates between flow configurations, and thereby achieves desired interleav-ings of hardware events. It is not necessary that all possible flows in a simulated scenario are considered in the flow configuration selection process. It may be the case that some flows do not significantly affect the software under test, or that the simulator implementation does not allow control over some flows. Flows that are not explicitly controlled by the injector are either implicitly enabled or connected to another flow.
In most test scenarios, detecting the race conditions that can appear would only require controlling one or a few types of flows. When testing multithreaded applications on simulated multiprocessor computers, controlling the processor flows is a simple strategy for triggering races between multiple threads. Indi-vidual threads can be suspended by disabling the processor they are currently running on. If a multithreaded application runs on a simulated uniprocessor computer, however, disabling the only processor does not achieve the desired effect. Instead, the injector must alternate disabling the processor flow and the
clock flow in order to provoke the operating system to schedule a new thread when desired. In a test scenario with an application distributed over multiple nodes, controlling the time flow is less important for provoking race conditions, and controlling processor flows, communication flows, and communication fault injection flows may be more appropriate. Some classes of flows, such as mem-ory consistency flows and hardware fault injection flows, will usually not be necessary to control, except for certain classes of applications.
The flow model matches the simulation setup well when the simulation has a static set of flows that correspond to simulated entities that all process events serially, e.g. processors or input devices. It does not match equally well to entities that do not process events serially, e.g. communication links that reorder messages, memory systems with weak consistency, etc. One could support a dynamic number of flows, or map dynamic flows to a static set of flows, but it could complicate the injector implementation and potentially have performance implications. The author believes that the flow model will have to be revised and extended as more experience is gained with entropy injection, but that it is sufficient for creating entropy injectors that are theoretically capable of catching most classes of race conditions.
The flow classes mentioned above are all low-level flows, corresponding to the level of simulation that we are using. If a simulator that model computers at another abstraction levels is used, flows at that abstraction level would be appropriate. For the purpose of testing application race event interleavings, it may be more useful to control flows at higher abstraction layers, for example processes or database transactions. This is discussed further in Section 4.2 and there are examples in Section 5.1.
4.2
Injection strategies
An injector can insert artificial delays in execution by alternating between flow configurations. Inserting delays completely randomly is unlikely to be effective in most cases, however. If an application test suite with an injector is run infinitely many times, all intermittent defects will be found, if the test suite can detect them and the injector can provoke them with the set flows it controls. Unfortunately, since the number of possible race event interleavings is large, it would take an unreasonable number of test executions to find all race conditions in an application.
An entropy injector therefore needs an injection strategy that searches through the space of possible interleavings in an intelligent manner, inserts delays where the application is likely to be vulnerable to race conditions, and avoids excessive testing of redundant test cases that have equivalent interleav-ings of application events. A strategy is comprised of multiple combined injec-tion tactics. Most tactics are provoking and have noinjec-tions of where race windows are located, and strive to insert delays in randomly picked race windows. If a race window is hit and a sufficiently large delay is inserted when the window is open, there is a good chance that some process will execute an uncommon race closure. For example, a tactic for provoking concurrency errors in a database
could insert delays in processes that have started transaction processing, but not yet completed commit phase. A provoking tactic typically concentrates on a particular type of event that is assumed to be important for race event inter-leavings in the application under test, and distributes injections with uniform probability over these events.
In theory, any instruction or event in a process in the system can affect other processes. A very simple injection tactic could have each flow enabled for a ran-dom number of instructions (or other events), and then disable the flow until a random number of instructions have been executed in other flows. We will call this tactic RandomTime. If the random numbers are picked from an open-ended random distribution, e.g. an exponential distribution, RandomTime can trigger any intermittent error. RandomTime regards all executed instructions as equally important, and inserts evenly distributed delays over the dynamic stream of executed instructions. RandomTime is a simple but unguided tactic, and therefore not sufficient for triggering defects on its own, which is demon-strated in Section 5.2.
In practice, only a few types of events will affect interprocess communication in a given application. These events are typically unevenly distributed over the instruction stream, and RandomTime will therefore produce many equivalent and redundant test cases while missing relevant test cases. As an example, as-sume that a developer wants to test a distributed application for defects that depend on the order of messages sent between the nodes. RandomTime would probably generate many redundant test cases where delays are injected at dif-ferent points in execution that have no communication event between them, illustrated in Figure 5b. It would also miss injecting delays in many interesting cases where there are two communication events separated by a small number of instructions. Such cases, shown in Figure 5c, are desirable to test and increase test coverage.
a: without injection b: redundant test cases c: coverage improving test case Node B messages Node C Node A injected delays
An injector will be more effective if its strategy involves guided tactics, which monitor execution events that are likely to affect race event interleavings, and distribute delays randomly and evenly over these events. Such tactics can be general, and insert delays at events that are likely to be race events in many applications, e.g. shared variable accesses or interprocess communication. They can also be domain- or application-specific, and insert delays at application events known to be sensitive to races, for example at telephone call state transi-tions, during online software upgrades, or during database transaction commit phases.
A tactic that only needs to monitor events at the hardware level can be implemented on a simulator without a holistic debugger. Tactics for provoking defects in high-level applications, however, will need to monitor events on an ab-straction layer above the hardware, such as events in a Unix or Java process, and must rely on a holistic debugger to provide the necessary programmable debug-ging services. A tactic can follow the progress of an execution flow at a higher abstraction level by using holistic debugger services to place process-specific eventpoints on the monitored process, e.g. code breakpoints, data watchpoints, or time breakpoints. When the tactic determines that the monitored process should be delayed, it manipulates an appropriate hardware flow to achieve this effect. It is straightforward to delay a process by disabling the processor it is running on. It is also possible to affect operating system’s process scheduling by fast forwarding the clock, thereby forcing timer interrupts and thread preemp-tion. Similar techniques may be used in order to force other run-time systems to control flows at higher abstraction layers.
If a holistic debugger is unavailable, it is possible to create other means for monitoring high level application events and controlling high level flows, by manipulating the code or the state of the operating system or the application under test. Such test scenarios would be intrusive, however, and the software under test would differ from production software. Intrusion has a number of disadvantages; it may mask defects that cannot be found due to the modifica-tions, it may trigger defects that cannot appear in real systems, it complicates test configuration, and it complicates reasoning about test coverage. In some cases, however, it can be a more cost-effective solution if the holistic debugger can be replaced with simpler debugging services.
An aggressive injector can create simulated scenarios that can never appear on real machines, and these scenarios can potentially trigger false defects that can never appear in production. In such scenarios, some device exhibits be-haviour that violates the assumptions made by the application designers. For example, if an injector delays a disk device and it therefore takes a few seconds for it to respond, the operating system device driver may report a timeout error, and if the application does not handle the error gracefully, it will fail. In this case, if the application designers has decided that disks are assumed to work, and that any failures resulting from disk failures are acceptable, this test case is invalid, and should not be reported as a failure. Applications can also fail if the simulated machine violates some basic assumptions made by software. Con-sider a simulated scenario with multiple processors, each having its own clock.
If the simulated clocks are artificially delayed and drift apart, the operating system could perform a clock reading on one processor, and later another clock reading on another processor, this time resulting in an earlier time value. Such anomalies may confuse the operating system or other software on the system, and cause application failures.
In order to avoid creating false positive reports, developers can write detec-tion routines that identify invalid test cases when a timeout or similar undesired execution pattern appears, and discard the results of these tests. An alterna-tive method for avoiding false posialterna-tive reports is to use restricalterna-tive tactics, which prevent the simulated machines from exhibiting unrealistic behaviour by limit-ing the duration of artificial delays. Such a tactic would monitor the progress of a simulated entity, and if the entity is delayed for an unreasonable amount of time, or falls behind related entities, the restrictive tactic would enforce the entity to become enabled in order to avoid anomalous system behaviour.
An injector holds a number of active tactics, combined to a strategy. The tactics of a strategy have different priority, and high priority tactics get the first opportunity to affect the flow configuration. Lower priority tactics can decide to enable or disable flows that have not been decided by higher priority flows. Restrictive tactics need to have high priority in order to take effect. The guided tactics that are expected to accurately guess the likely locations of race conditions should have medium priority. Unguided tactics can be added at a low priority, with the purpose to add noise and provoke local variations of similar execution patterns.
Tactics can also be composite, and combine multiple subtactics. A composite tactic could use all subtactics or alternate between them, either randomly or depending on application behaviour. Composite tactics allow developers to create arbitrary hierarchies with tactics.
5
Njord
We have implemented a simple entropy injector, Njord, as an extension to Nornir. The purpose of Njord is to demonstrate a proof-of-concept implemen-tation, and to gain some understanding of how the method behaves in practice by studying test executions with simple, synthetic test scenarios. Njord injects artificial delays by controlling processor flows, which is sufficient for provoking most race conditions on multiprocessor computers and in distributed systems. Other flows in the simulated system, e.g. clocks, hardware devices, etc, are en-abled and progress as usual according to the simulation model. Njord supports the same simulated platform that Nornir supports, i.e. simulated UltraSPARC systems running Linux.
5.1
Njord injection strategies
Njord implements two simple, generic entropy injection tactics. More com-plicated, application-specific tactics are likely to be more effective for realistic
applications, but these simple tactics allow us to demonstrate how an applica-tion developer could provoke race condiapplica-tions and write a regression test case, and to gain some understanding of entropy injection behaviour.
A Njord injection strategy consists of a list of tactics, ordered by priority. Tactics are responsible for monitoring execution events they consider interesting by using appropriate eventpoints, and can decide to request flow configuration reevaluation when an eventpoint is triggered. When reevaluation is requested, Njord iterates over the tactics in priority order. Each tactic can set a flow to enabled, disabled, or leave it to be decided by lower priority tactics. No tactic may disable all flows. After consulting all tactics, Njord sets all undecided flows to enabled, imposes the new flow configuration on the simulator, and resumes simulation.
Tactic implementations use holistic debugger services to monitor events of interest. Since a holistic debugger can monitor arbitrary software events, tactics can react on any type of eventpoint in a simulated system, e.g. code execution, memory access, time eventpoints, process creation and termination, file access, network message reception, web server query, and database table access. Hence, injection strategies can be used for provoking malign race conditions at any abstraction level.
5.1.1 RandomTime
The first implemented tactic is RandomTime, as described in Section 4.2. Pseudo code for RandomTime is shown in Figure 6. It imposes a flow con-figuration with a random set of processors enabled, waits for a (exponentially distributed) random number of cycles, and repeats the procedure. RandomTime has two configurable parameters: the number of processors enables (Processors-Enabled) and the average delay period (Delay).
while (true) {
enableAllProcessors();
while (numProcessorsEnabled() > ProcessorsEnabled) disableProcessor(random() \% numProcessors()); do {
nextFlowChange = currentCycle() + randomExponential(Delay); awaitOneOf(CycleCount(nextFlowChange),
FlowConfigurationChanged()); } while (currentCycle() != nextFlowChange); }
Figure 6: Pseudo code for RandomTime tactic.
As discussed below, RandomTime alone is not sufficient for provoking de-fects, but it is useful for adding random noise to the entropy injection, which can prevent all test runs from reexecuting a small set of patterns. It can also be used as a restrictive tactic in order to limit the delays introduced by other tactics, in this case with a long Delay setting and ProcessorsEnabled set to the number of processors in the system.
5.1.2 RandomInstruction
The second implemented tactic, RandomInstruction, spreads delays evenly in a static set of instructions, in contrast to RandomTime, which spreads its de-lays evenly over the dynamic set of executed instructions. The assumption of RandomInstruction is that there is a race window open when a certain code statement is executed, and if the injector injects a delay when that statement is executed, the race is likely to manifest. The pseudo code for RandomInstruction is shown in Figure 7. The basic algorithm is simple: Set a number of break-points at random addresses in the application’s processes. When one of the breakpoints are hit, inject a delay in the corresponding process by disabling the processor that hit the breakpoint. Disable all breakpoints, wait for a random number of cycles, enable the processor again and reenable the breakpoints that have not yet been not hit. The breakpoint addresses are automatically obtained from debug information generated when the program was compiled.
RandomInstruction has a number of parameters. The AddressRegions pa-rameter allows developers to specify the set of instructions that are candidates for breakpoints. The current implementation of RandomInstruction is adapted to multiple threads that run identical program code in one address space. An implementation for processes with multiple address spaces would be slightly different, but have similar complexity. The Fraction parameter specifies the number of breakpoints, as a fraction of the address region size. There is also a Fallthrough parameter, which the developer can use to specify a probability that a breakpoint should be ignored when hit. This gives some chance of triggering defects that do not appear the first time the faulty piece of code is executed.
When performing a full application test, the normal procedure would be to run the application with an injector, and then repeat the whole scenario a number of times, but with different random seeds. When testing multithreaded functions or modules, however, calling the module under test multiple times from a test driver program is more efficient. In this case, the injector should reconsider the set of breakpoints between the invocations of the module under test. There is therefore a ProcessThreshold parameter, and whenever the num-ber of application processes drops below this numnum-ber, the tactic restarts the algorithm, ensuring that each iteration of the module test is run with a new set of breakpoints. The ProcessThreshold parameter is not necessary for Ran-domInstruction to operate, but illustrates how developers can use application knowledge to improve test performance.
If processes in the application under test communicates with a regular mech-anism, for example with global variable accesses, network messages, or database accesses, developers can create similar strategies for spreading injections evenly over communication events deemed important. In this case, the strategy would follow the same pattern, but the execution breakpoints would be substituted with variable read/write watchpoints, message eventpoints, or database access eventpoints, respectively.
while (true) {
if (numApplicationProcesses() == 0) awaitOneOf(ProgramStart());
else if (numApplicationProcesses() < ProcessThreshold) awaitOneOf(ProcessCreation(), ProcessDestruction()); else {
for (i = 0; i < max(AddressRegions.size() * Fraction, 1); ++i) breakpoints.add(insertRandomBreakpoint(AddressRegions)); while(numApplicationProcesses() >= ProcessThreshold) { event = awaitOneOf(BreakpointHit(breakpoints), ProcessDestruction()); if (event.type() == BreakpointHit) { if ((random() \% 1000) > (Fallthrough * 1000)) { breakpoints.remove(event.breakpoint()); disableProcessor(event.processor());
delayEnd = cycleCount() + randomExponential(Delay); while (currentCycle() < delayEnd) {
delayEvent = awaitOneOf(CycleCount(delayEnd), ProcessDestruction()); enableAllProcessors(); if (delayEvent.type() == ProcessDestruction) { if (numApplicationProcesses() < ProcessThreshold()) { breakpoints.clear();
break; // Ignore delay and wait for process creation. } } } } } } } }
Figure 7: Pseudo code for RandomInstruction tactic.
5.2
Demonstration
In order to demonstrate how entropy injection behaves in practice, we have arranged a scenario with a unit test for a simple multithreaded routine that contains a race condition. The routine, increment n, creates n threads that perform some random work, and then increment a shared variable, sum. The variable increment is performed without using synchronisation, and there is a typical data race, as described in Section 2. In case the uncommon window closure occurs, it is detected by comparing sum with n. Figure 8 shows the pseudo code for increment n, the routines it calls, and a unit test. The numbers S and R change for the experiments.
The example is contrived, but is representative in the sense that the race window is very short, the program performs lots of activities in between, and the race only triggers if the threads arrive simultaneously, which is unlikely but plausible.
increment_n(int N) { for (i = 0; i < N - 1; ++i) threads[i] = thread_create(increment_one); increment_one(); for (i = 0; i < N - 1; ++i) thread_join(threads[i]); } increment_one() { spinAmount = random() \% S; for (i = 0; i < spinAmount; ++i)
doRandomWork();
++sum; // Lock missing here. }
doRandomWork() {
switch (random() \% x) { case 0: readAFile(); break; case 1: writeAFile(); break; case 2: doSomeSystemCalls(); break; case 3: fibonacci(); break;
case 4: useSomeMemory(); break; /// And so on. } } test_increment_n() { E = 0; for (i = 0; i < R; ++i) { sum = 0; increment_n(2); if (sum != 2) ++E; } }
Figure 8: Pseudo code for the test example.
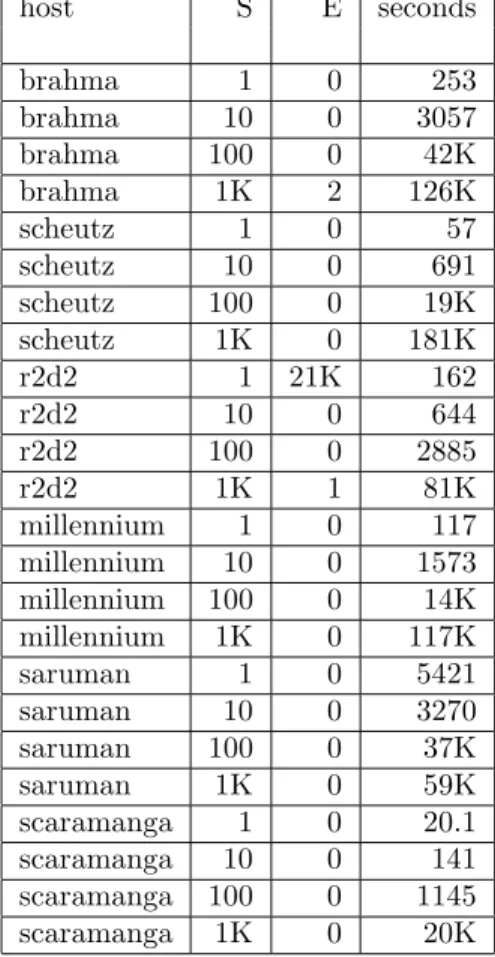
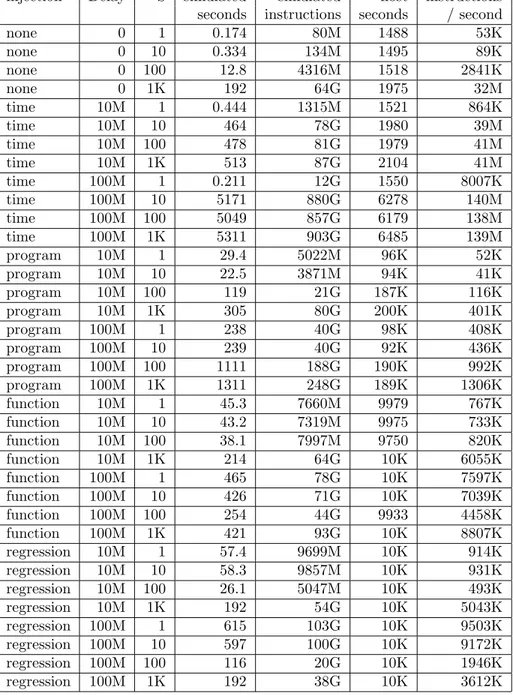
5.2.1 Test results on real hosts
When run on real machines, the race in the example above triggers, but only rarely. Statistics from running the test program on a variety of multiprocessor machines, ranging from very old to modern, are shown in Figure 9. The following machines were used for the test runs:
brahma Sun SPARCstation 10, 2 x 40 MHz SuperSPARC scheutz Sun Ultra Enterprise 4000, 8 x 250 MHz UltraSPARC II r2d2 2 x 600 MHz Intel Pentium III
millennium Sun Fire T1000, 1 x 1 GHz UltraSPARC T1, 6 cores, 4 threads/core