THESIS
ANALYSIS OF ADVANCED VAPOR SOURCE FOR CADMIUM TELLURIDE SOLAR CELL MANUFACTURING
Submitted by
Tejas Harshadkumar Khetani Department of Mechanical Engineering
In partial fullfillment of the requirements For the Degree of Master of Science
Colorado State University Fort Collins, Colorado
Summer 2013
Master’s Committee:
Advisor: Walajabad Sampath Hiroshi Sakurai
Copyright by Tejas Harshadkumar Khetani 2013 All Rights Reserved
ii
ABSTRACT
ANALYSIS OF ADVANCED VAPOR SOURCE FOR CADMIUM TELLURIDE SOLAR CELL MANUFACTURING
A thin film CdS/CdTe solar cell manufacturing line has been developed in the Materials Engineering Laboratory at Colorado State University. The original design incorporated infrared lamps for heating the vapor source. This system has been redesigned to improve the energy efficiency of the system, allow co-sublimation and allow longer run time before the sources have to be replenished. The advanced vapor source incorporates conduction heating with heating elements embedded in graphite.
The advanced vapor source was modeled by computational fluid dynamics (CFD). From these models, the required maximum operating temperature of the element was determined to be 720 C for the processing of CdS/CdTe solar cells. Nichrome and Kanthal A1 were primarily selected for this application at temperature of 720 °C in vacuum with oxygen partial pressure. Research on oxidation effects and life due to oxidation as well as creep deformation was done, and Nichrome was found more suitable for this application. A study of the life of the Nichrome heating elements in this application was conducted and the estimate of life is approximately 1900 years for repeated on-off application. This is many orders of magnitude higher than the life of infrared heat lamps. Ceramic cement based on aluminum oxide (Resbond 920) is used for bonding the elements to the graphite. Thermodynamic calculations showed that this cement is inert to the heating element. An earlier design of the advanced source encountered failure of the element. The failed element was studies by scanning electron microscopy and the failure was attributed to loss of adhesion between the graphite and the
iii
ceramic element. The design has been modified and the advanced vapor source is currently in operation.
iv
ACKNOWLEDGEMENTS
I would like to thank Dr. Sampath for guiding me throughout my Master`s program, Dr. Sakurai for answering the silliest questions about computational fluid dynamics, and Dr. Sites for being my committee member and his continues support .
I would like to thank Kevin Walters and other lab mates for helping me out in understanding CdTe manufacturing technology and techniques.
I would like to thank to my family and friends for providing enormous support to
achieve my goals. Finally I want to thank Tuli for encouraging me through ups and downs during these years.
v
TABLE OF CONTENTS
ABSTRACT ... ii
ACKNOWLEDGEMENTS ... iv
TABLE OF CONTENTS ... v
LIST OF FIGURES ... vii
Chap. 1. Introduction ... 1
1.1 Energy, Environment and Humanity: ... 1
1.2 Greenhouse gases and their effects ... 4
1.3 Renewable Energy Sources ... 5
1.4 PV Solar cells comparison – Why CdTe? ... 8
1.5 CdTe Solar thin film solar cell ... 10
1.5.1 CdTe Device Manufacturing ... 11
Chap. 2. Motivation behind new research ... 12
2.1 Creation of Advance Research Deposition System (ARDS) ... 12
2.2 Development of embedded heating element deposition source ... 13
A) Power Requirement ... 13
B) Longer running source ... 14
C) Motivation: Co-Sublimation ... 16
Chap. 3. Computational fluid dynamics modeling and results ... 17
3.1 Problem Approach ... 18
3.2 CFD Analysis Results ... 28
3.2.1 Results: No shielding... 29
vi
Chap. 4. Heating Element. ... 33
4.1 Heating Element Requirements ... 33
4.2 Available options for heating element. ... 34
4.3 Nichrome and Impurities ... 36
4.3.1 Life of nichrome element in the advanced Vapor Source ... 37
4.4 Resistance to Oxidation and Effects of different elements. ... 39
4.4.1 Effect of Manganese and Silicon oxide formation. ... 45
Chap. 5. Ceramic Cement ... 47
5.0.1 Resbond 920 ceramic ... 48
5.2 Procedure to attach heating element and ceramic inside a groove. ... 49
5.3 Heating element failure ... 50
1) Vacuum:... 51
2) Impurities in Nichrome:... 51
3) Overheating ... 52
5.4 Reactions between heating element and ceramic cement ... 54
Chapter 6: Conclusion and Future Study ... 57
6.1 Conclusion ... 57
6.2 Future Study ... 57
vii
LIST OF FIGURES
Figure1.1.1 Energy requirement by 2035[3] ... 1
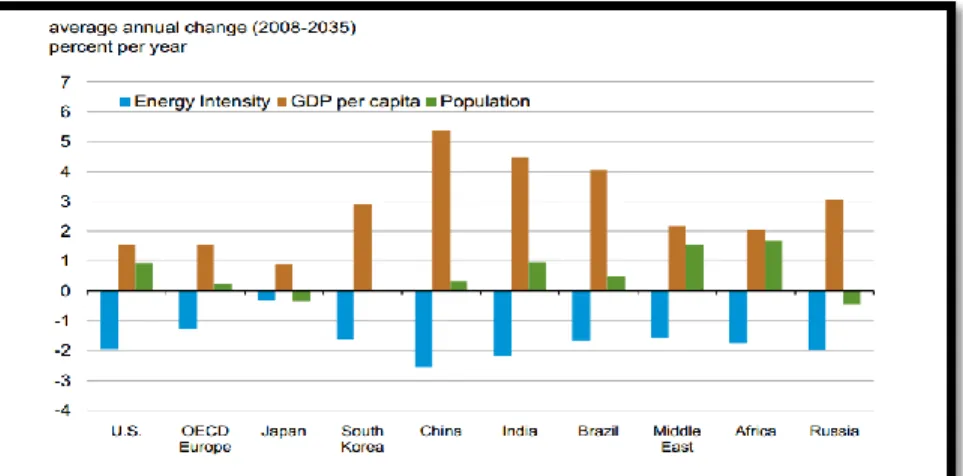
Figure1.1.2 Energy intensity required by different country based on GDP and Population Growth[3] ... 2
Figure 1.1.2 describes average annual change energy intensity based on GDP per capita and population growth in the span of 2008 to 2035. Figure indicates that as GDP per capita and population are the major contributors of energy intensity in India, and China. ... 2
Figure1.1.3 World Energy Consumption by fuel quadrillion BTU[3] ... 3
Figure1.2.1 CO2 level in Billion Tones by 2030[2] ... 4
Figure1.2. 2 CO2 level in PPM by year[1] ... 4
Figure1.2.3 Temperature Change due to Green house ... 5
Figure 1.3.1 Solar Energy availability according to different region ... 7
Figure1.3.2 Favorable Impressions of Energy and Environmental Concept ... 8
Figure1.3.3 U.S. Annual PV Installation and US Global market share ... 8
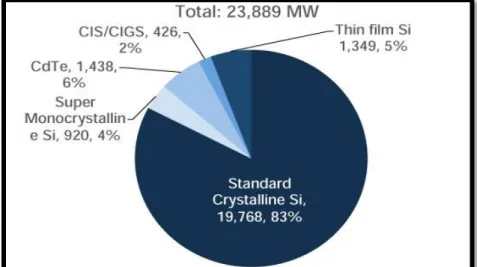
Figure 1.4.1 Different Solar cell and its share ... 9
Figure1.5.1 CdTe Device structure ... 10
Figure1.5.2 CdTe Device manufacturing[6] ... 11
Figure2.1.1 Advance Research Deposition System (ARDS)[6] ... 12
Figure2.2.1 Schematic diagram Radiation Heating Source (Current Source) ... 13
Figure2.2.2 Schematic diagram Conduction Heating Source ... 14
Figure2.2.3 Schematic diagram Advanced Vapor Source with increased depth of 3×3 pocket .. 15
Figure2.2.4 Schematic diagram Co-Sublimation at different temperature using Advanced Vapor Sources ... 16
viii
Figure3.0.1 2D schematic diagram of complete system. ... 17
Figure 3.1.1 Approach to computational fluid dynamics modeling[6] ... 19
Figure3.1.2 CAD Model of Advanced vapor source[6] ... 20
Figure3.1.3 Mesh Generation ... 21
Figure 3.1.4 Name selection of different walls ... 22
Figure3.1.5 CAD Model exported to Ansys Fluent ... 23
Figure3.1.6 Surface to Surface (S2S) Radiation model selection ... 24
Figure3.1.7 View Factor associated with radiation exchange between surfaces dAi and dAj[7] 25 Figure3.1.8 Boundary Condition set up for different wall that participates in View Factor Calculations... 26
Figure 3.1.9 Surface Clusters ... 27
Figure 3.2.1 Graphics and Animations window[7] ... 28
Figure3.2.1.1 Temperature Contours 3×3 pocket source ... 29
Figure3.2.1.2 3×3 surface contours showing heat distribution ... 30
Figure 3.2.1.3 3 ×3 surface contours showing heat distribution at 620 °C ... 31
Figure 3.2.2.1Heat Distribution at 3×3 pocket* ... 32
Figure4.3.1 Creep deformation vs. number of on-off cycle to failure.[10] ... 37
Figure 4.4.1 Growth of oxide layer [16] ... 40
Figure 4.4.2 Oxide Formation[15] ... 40
Figure 4.4.3 x-ray diffraction profiles of Nichrome containing manganese after the Thermo-gravimetric test a)Scale formed on Ni-20Cr-1Man oxidized 1 week at 1200 °C b) Uniform scale on Ni-20Cr-3 Mn oxidized 3 week 1200°Cc)Same sample as (b) showing irregular scale.[14] ... 42
ix
Figure 4.4.4 Concentration profiles in scales formed on Ni-20Cr-1 Mn oxidized 2 weeks at
1200°C[14] ... 43
Figure 4.4.5 Concentration profiles in scales formed on Ni-20Cr-3Mn oxidized 2 weeks at 1200°C[14] ... 43
Figure4.4.6 Structures of scales formed on Ni-20Cr containing silicon (a)Ni-20 Cr-1Si oxidized 2 weeks at 1200°C. Nearly complete layer of SiO2 between Cr2O3 and metal. (b) Ni-20Cr-1 Si oxidized 1 week at 1200 °C. Isolated particles of SiO2. (c) Ni-20Cr -3Si oxidized 1 week at 1200°C . Continuous film of SiO2 between metal and Cr2O3 layer.(d) Ni-20Cr-3Si oxidized 2 days at 1000°C. Three-phase film showing no SiO2[14]. ... 44
Figure 4.4.7 Ni-20Cr-1Si Oxidized 2 weeks at 1200°C[14] ... 45
Figure 5.0.1 Advance vapor source system ... 47
Figure 5.2.1 Cross sectional bottom view of Advanced Vapor source, Heating arrangement (Not to the scale)[6]... 49
Figure5.2.2[6] ... 49
Figure5.3.1 Failed element ... 50
Figure 5.3.2 SEM test result of Failed Element ... 51
Figure 5.3.3 Ceramic breaking off the system (a) Condition: Conduction (b) Condition: Radiation ... 52
Figure 5.3. 4 Modified Design ... 54
Figure5.4.1 Ellingham Diagram ... 55
1
Chap. 1. Introduction
1.1 Energy, Environment and Humanity:
Since early stage of its evolution, mankind has always strived for better facilities and safety. First humans started to cut trees for energy, and then started exploring new resources such as coal, oil etc. for better transportation and facilities. Since then humans haven’t stopped and continue to use those resources. Due to those resources, pollution has increased day by day.
In the nineteenth century due to industrialization, the energy demand started to increase, and with the discovery of petroleum in 1869, an era of energy abundance began. Moreover in 1888 first petrol powered car was made and in 1902, Daimler-Motoren-Gesellschaft (DMG) started mass production of the first cars. By the end of the third decade of the twentieth century, United States alone had about three million cars moving on the road. Due to these two reasons mankind’s energy requirement increased exponentially.
2
As shown in figure 1.1.1 the energy requirement rose up to approximately 550 Quadrillion BTU (QBtu) in 2012. Organization for Economic Co-operation and Development (OECD) countries and non-OECD countries requires approximately 260 and 300 QBtu energy respectively. The energy requirement is expected to increase by 53% by 2035, where non-OECD countries will require around 482 QBtu and OECD countries will require 288 QBtu of energy.
Figure1.1.2 Energy intensity required by different country based on GDP and Population Growth[3]
Figure 1.1.2 describes average annual change energy intensity based on GDP per capita and population growth in the span of 2008 to 2035. Figure indicates that as GDP per capita and population are the major contributors of energy intensity in India, and China.
3
Figure1.1.3 World Energy Consumption by fuel quadrillion BTU[3]
Figure 1.1.3 shows that until the end of the twentieth century, fossil fuels (including biofuels) were the major energy source; it continues to be till 2008 with the contribution of 85% in International Energy Consumption. Even through fourth decade of the twenty first century it will continue to provide 80% of the world energy requirements. However, a huge problem of greenhouse gases emission is associated with it. Fossil fuels emit considerable amount of greenhouse gases (carbon dioxide, methane and carbon monoxide), which would create adverse effects on the earth’s environment. Due to this major disadvantage it was the order of the day to find a reliable energy source, which generates less pollution and is sufficiently available to satisfy the world energy requirement. It is seen that since 1990 renewable energy sources (wind energy, hydro energy and solar energy) have started providing energy. Renewables are seen as the world’s fastest growing energy source, at 2.8% per year. Renewables are anticipated to have a share of roughly 15% of produced energy in 2035, 5% increase since 2008. Liquid fuel (including biofuels) contribution is expected to reduce from 34% in 2008 to 29% in 2035[4].
4
1.2 Greenhouse gases and their effects
As world’s energy requirements are increasing year by year, it`s an increasingly important task to satisfy those requirements. As of now fossil fuels are the best energy sources owing to their low cost and best available technology to use them. Moreover it’s easily available. But as described earlier greenhouse gases are the major problem associated with these fuels.
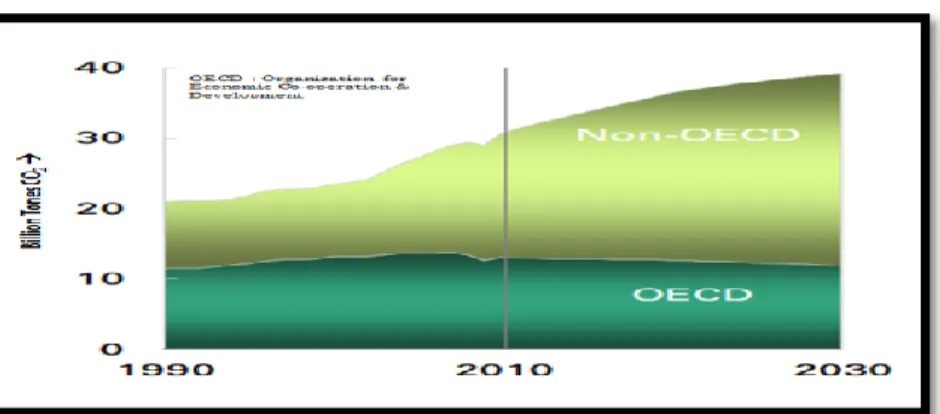
Figure 1.2.1 shows CO2 emission in the atmosphere by 2030. It is expected that by 2030 CO2
emission will increase up to 40 billion tons in atmosphere. This includes 10 billion tones by OECD Countries and about 30 billion Tones by Non-OECD Countries. With respect to overall amount, parts per million (PPM) level is also important that should be taken into account. There were 5 models that were taken into account as shown in figure 1.2.2.
Figure1.2.1 CO2 level in Billion Tones by 2030[2]
5
With the lower emission scenario the level of CO2 is predicted to be around 550
ppm which is 100 ppm above the permissible limit. And with maximum Emission scenario it is predicted to go beyond 900 ppm by 2100. Due to this high amount of CO2, the
temperature of earth is expected to change. As shown in figure 1.2.3 Earth’s temperature is expected to increase up to 7°F by 2100.
Figure1.2.3 Temperature Change due to Green house
1.3 Renewable Energy Sources
Climate change as well as high oil prices plus increased government; subsidized support to establish new policies for renewable energy has increased private enterprise’s interest to move towards that sector. Thus Renewable electricity installation has increased in United States in recent years.
6
Renewable energy sources includes different energy sources like,
1) Geothermal energy 2) Wind energy
3) Hydropower energy 4) Biomass
5) Solar Energy
Earth itself is the largest source of energy, which is considered to be geothermal energy. Geothermal energy source taps this energy from the earth to generate electricity. Electrical generators utilize already existing reservoirs of steam or hot water.
Wind is a great source of energy. Wind is used to rotate the wind turbine generating electricity. The wind turbine is connected to aerodynamically engineered blades that act much like airplane wings. A low pressure pocket is generated at the down side of the blade, and the upper side contains high pressure. This phenomenon lifts the blade and rotates the turbine. Hydropower is power derived from the energy of falling or running water, to run the turbine and hence electricity is generated. Out of all energy sources solar energy is predicted to be biggest hope that could become major source of energy, certainly not till 2035.
It won’t become a major source of energy till 2035 because presently solar cell efficiency is very low in comparison to other energy sources like fossil fuels. Moreover solar cell requires higher space to generate the same amount of energy as fossil fuels. But it is predicted to be a game changer mainly because of its comparative ease of to manufacturing, requirement of
7
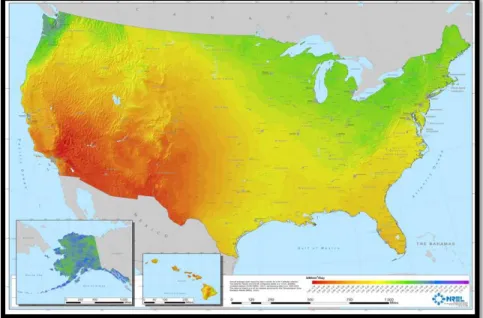
less investment and less space in comparison of other renewable energy sources. Due to high cost and location constraints it is not possible to built hydropower station and wind power plants everywhere. Solar power stations meet all the requirement of a reliable energy source. Moreover favorable location of the USA as well as public opinion supports the argument, as shown in Figure 1.3.1 and 1.3.2, presenting a strong case for Solar Cells in the future. Investments in production of solar PV modules are increasing as shown in figure 1.3.4. Worldwide installment and support for Photovoltaic power plants are being increased day by day. This motivated the department of energy to start the SunShot program, which holds a main objective “to bring down installing cost of PV module to $0.66/watt,” nearly 78% of the decrease of what it currently holds. This has already achieved.
8
Figure1.3.2 Favorable Impressions of Energy and Environmental Concept
Figure1.3.3 U.S. Annual PV Installation and US Global market share
1.4 PV Solar cells comparison – Why CdTe?
A number of different types of solar cells are available on the market, which includes crystalline silicon (C-Si), cadmium telluride (CdTe), and CIGS. Currently, C-Si PV cell
9
is a big player on the market. But since last decade Cadmium telluride has started to be used more because of the benefits which are stated below.
1) CdTe cells are environmentally friendly, as cadmium and tellurium are a byproduct of zinc and copper mining.
2) CdTe is not soluble in water due to higher stabilization; moreover its melting point is over 1000 °C, and it won’t get destroyed in house fires. Due to more than 20 years of research manufacturability and efficiency has increased which supports increasing production every year. The solar module cost for a CdTe module is $0.66/watt[5]. Due to all these advantages it is considered a most favorable source of renewable energy.
10
1.5 CdTe Solar thin film solar cell
Figure1.5.1 CdTe Device structure
CdTe solar cell consist of 4 layers
1) TCO i.e. transparent conductive oxide. 2) Cadmium sulfide (CdS)
3) Cadmium Telluride (CdTe) 4) Carbon Nickel acrylic contact
Sunlight enters the solar module through TCO, provides the required energy to release the electron. CdS is the N layer of P-N junction; it passes the photon to the next layer, which is CdTe. In CdTe layer photon creates the hole and that generates the current.
11
1.5.1 CdTe Device Manufacturing
Figure1.5.2 CdTe Device manufacturing[6]
As described earlier, photovoltaic cells are used for converting sunlight into electricity. For many decades it has been recognized that to meet the current energy requirements solar energy is the best option. The only drawback was that it was impossible to mass produce these panels at a lower cost. There are many ways to produce the CdTe thin films solar cells. The deposition system that was developed by W.S. Sampath, K.L. Barth and R.A. Enzenroth at Colorado State University is the method in focus here. The system was a continuous inline manufacturing system using heated pocket deposition. It was used to study the CdTe Solar cell manufacturing process. Heated pocket deposition source that consist graphite crucible and top substrate heater is the main part of the technology; it is heated by infrared lamps. This technique made it possible to produce CdTe solar panels every two minutes.
12
Chap. 2. Motivation behind new research
2.1 Creation of Advance Research Deposition System (ARDS)
Original research for manufacturing the CdTe devices helped to start the company, Abound Solar, in 2008. By 2009, it was found out that system could be improved in many ways, to improve the manufacturing as well as flexibility. This opened the doors for future research. It was decided to completely redesign the manufacturing system for better flexibility and efficiency. The major deviation of new research was a single system load lock design from inline belt driven system. This new research was given name of Advance Research Deposition System. On load lock system, engineers can research at different stations for different process time and process. With the help of this new system complicated processes like sublimation of magnesium as well as optical measurement techniques for inline process control were easily incorporated.
Figure2.1.1 Advance Research Deposition System (ARDS)[6]
13
2.2 Development of embedded heating element deposition source
Development of a new system gave engineers opportunity to make the system more flexible and user friendly for the research purposes. As shown in figure 2.2.1, earlier the system has temperature variation of 200 °C to 620°C and the atmosphere around the source contains nitrogen having pressure of 40 miliTorr. It is the best suitable environment required for the IR lamps to give sufficient radiation on the source to generate required heat. There are some of the disadvantages associated with the use of IR based system.
A) Power Requirement
The power requirement of IR lamp is a lot higher. Moreover, out of the generated radiation, only half of the radiation is used for increasing the source temperature. The other half is directed to support structure as well as shielding. This causes heating of those parts and consequently results in damages to the support system and causes alignment problems. So overall it is really tough to direct all radiation towards the source.
14
Figure2.2.2 Schematic diagram Conduction Heating Source
(Advance Vapor Source)
As a solution to these problems a new form of heating was developed, to create required temperature levels. 2D schematic of conduction heating source is shown in figure 2.2.2. In this source heater is used to achieve required temperature. Here ceramic works as a bridge between heating coil and graphite vapor source.
B) Longer running source
Solar cell being a major source to contribute to the future and due to high energy demand it is important that, sufficient number of solar modules be every year to meet the required energy demands. It is also equally important to have faster manufacturing processes to meet that demand. It was tough to achieve that with current vapor source
It is difficult to achieve uniform heating when using radiation heating source especially along the depth. Moreover due to non-uniform heating, it could create problems of hotspots at different points on the system.
15
Figure2.2.3 Schematic diagram Advanced Vapor Source with increased depth of 3×3 pocket
Due to this limitation it is not possible to fill up the source beyond a certain limit. This leads to stopping process for two days every week, this is approximately 90 days a year. That’s approximately 64,000 modules every year, to cool the source replenish the source and
heat the source considering every two minutes, one module is manufactured. Advanced vapor source provides this flexibility. The depth of a 3×3 pocket source can be increased.This system can be uniformly heated from all side of vapor source . That could lead to effective and fast paced solar cell manufacturing and less down time per year.
16
C) Motivation: Co-Sublimation
A recent development in CdTe solar cell shows that sublimation of magnesium (Mg) along with CdTe increases its efficiency. It is very complex to achieve this in a radiation source as cadmium telluride sublimates at 540 °C, but magnesium sublimates at 400 °C.
Figure2.2.4 Schematic diagram Co-Sublimation at different temperature using Advanced Vapor Sources
Advanced vapor source can be modified to have different temperature on different sublimation as shown in figure 2.2.4. It’s comparatively easy to achieve than in Current vapor source. Figure 2.2.4 shows that primary source is running at 620 °C to sublimate the CdTe and secondary source is running at 400°C to sublimate Mg, through holes provided inside primary source.
17
Chap. 3. Computational fluid dynamics modeling and
results
Due to the advantages of the advanced vapor source, the research on these sources are focus of the studty . Research included thermal analysis as well as heating life cycle analysis. Thermal analysis was required to see if it was possible to achieve required the temperature span of 200°C to 620°C with this new embedded system. The main aim of the analysis was to estimate the temperature of the element for source temperature of 620°C.
Traditionally it could have been achieved by manufacturing prototype and adjusting all the required parameters. But there are some disadvantages related to this type of analysis, which are as given below:
1) Higher time required as it was required to manufacture all the parts of the system, then adjust them.
2) Possibility of failing in experiment; it could lead to major loss of research expense. 3) It’s hard to adjust all the thermocouple and parameters on the heater.
18
It was decided to go for CAD/CAE modeling. This is a lot less time consuming, it has a lot of flexibility in terms of changing the parameters, mechanical movements and is easy to handle and economic.
3.1 Problem Approach
Computational fluid dynamics is a branch of fluid mechanics. It is mainly computer based application. Computer uses numerical methods and algorithms to solve and analyze problems that involve fluid flows and thermal analysis. Computers are used to for calculation required perform complex calculations of liquid and gases interactions with surface defined boundary conditions with high accuracy.
First of all it is mandatory to check if CFD analysis is required or not. As, sometimes problem solution can be achieved by some basic calculations. If not, then CFD should be approached. Now, before starting, objectives of the analysis must be decided. CFD helps in defining the mesh, and obtaining the required result. For example different types of mesh are required for the aerodynamic analysis and thermal analysis of the same object.
19
Figure 3.1.1 Approach to computational fluid dynamics modeling[6]
Figure 3.1.1 shows the approach to the CFD model. Objectives for this analysis are as follows:
1) To find out the heat distribution at different surfaces of the advance vapor source
2) To see how much temperature is required for heating element to achieve temperature of 620°C at 3×3 pocket of the bottom source.
CAD Model generation: First task was to create a 3-Dimensional model of the advance vapor source, which is known as CAD model. To create this model the current model was completely referred, and Kevin Walters created the CAD model of advance vapor source, with precisions.
20
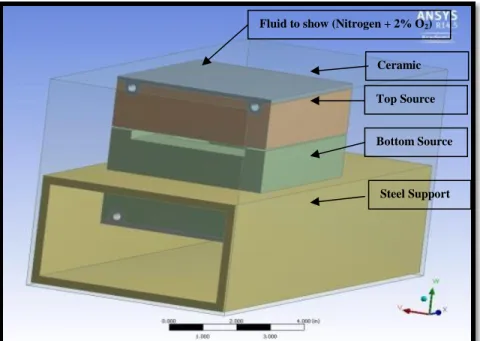
Figure3.1.2 CAD Model of Advanced vapor source[6]
Figure 3.1.2 shows the CAD model of advanced vapor source. The model includes different parts as shown below:
1) Fluid: To assign nitrogen and 2% oxygen at 40 miliTorr. That surrounds the vapor source in real systems.
2) Bottom and top source: These are the main parts of the overall vapor source system. These parts provide the required heat for CdTe material to sublimate on the source. 3) Ceramic: works as a bridge between heating element and graphite vapor source.
4) Steel support: steel is used to support the overall system. This accounts for some of the heat losses too.
Fluid to show (Nitrogen + 2% O2)
Ceramic Heater Top Source
Bottom Source
21
These parts are modeled in fluid state or solid state, based on the characteristics.
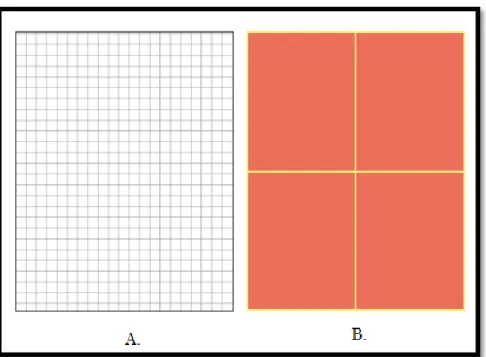
Mesh Generation: “After this CAD model is generated, this model is transferred to meshing software. In Computational Fluid Dynamics, meshing is a discrete representation of the geometry that is involved in the problem. Essentially, it assigns cells or smaller regions over which the flow is solved. Several parts of the mesh are grouped into regions where boundary conditions may be applied to solve the problem.”
Figure3.1.3 Mesh Generation
The CAD model is divided into discrete finite numbers of volume, based on different mesh controls. The mesh contained 675,925 tetrahedral cells. It had orthogonal ratio and skewness of 0.11 and 0.89 respectively. These both are considered a mesh metric; it shows the quality of generated mesh. The mesh generated is considered to be of acceptable quality.
22
It is mandatory to assign different names to different zones once the mesh is
generated. Boundary condition is the main aspect based on which, name selection is done.
Figure 3.1.4 Name selection of different walls
As shown in the figure 3.1.4, different walls have been given different named selection. The most important name in that is C and D, which signifies walls of bottom and top wall heaters respectively.
Meshed model is exported to the Ansys Fluent 3D module. Parallel processing and double precision was selected, as it provides high speed and high accuracy.
Transient and steady state models both are selected; transient model provides the
23
Mesh quality reported for the fluent analysis is around 0.12, which is considered to be of
acceptable quality. [As shown in figure 3.1.6 the outline of different parts as well as different parameters need to be set up before starting an analysis]
Figure3.1.5 CAD Model exported to Ansys Fluent
Once general setup is done, model selection comes next. To do the radiation in this study analysis, out of the entire available models, surface to surface radiation model was selected as shown in figure 3.1.6.
24
Figure3.1.6 Surface to Surface (S2S) Radiation model selection
Same earlier analysis was done with the help of Discrete Ordinate (DO) model[6]. It was necessary to verify with the help of different model. S2S model can be used for the gray surface in an enclosure. The energy exchange between both the surfaces depends on three factors:
1) Size of Surface
2) Distance of separation between them 3) Orientation of the surfaces
25
Figure3.1.7 View Factor associated with radiation exchange between surfaces dAi and dAj[7]
These parameters are accounted by geometric function called view factor.
The gray-diffuse model is what is used in ANSYS FLUENT. “Also, as stated earlier, for applications of interest, the exchange of radiative energy between surfaces is virtually unaffected by the medium that separates them. Thus, according to the gray-body model, if a certain amount of radiant energy (E) is incident on a surface, a fraction (ρE) is reflected, a fraction (αЄ) is absorbed, and a fraction (τE) is transmitted. For most applications the surfaces
can be considered opaque. The transmissivity, therefore, can be neglected. It follows, from the conservation of energy, that α+ρ=Є, since α=Є (emissivity), and ρ=1- Є”
26
Figure3.1.8 Boundary Condition set up for different wall that participates in View Factor Calculations
Fluent by default sets all outside surfaces to participate in view factor calculation. But some of the surface may or may not be participating in the radiation. So, it’s important to find out those surfaces and take it out from the view factor calculations by unchecking “Participates in View factor calculations.”
Surface clusters are additional facility provided by fluent, to make S2S radiation calculations easy and faster. For example, figure 3.1.9.A shows numbers of cells on the surface that radiates energy.
27
Figure 3.1.9 Surface Clusters
But it is complex and time consuming to calculate view factor, if each and every cell is taken into account. So, higher numbers of small cells are divided into smaller numbers of larger cells as shown in figure 3.1.9.B. This reduces the significant amount of time required to calculate view factor.
After, the boundary condition is set up, and view factors are calculated. The numbers of different user defined materials are added; different cell zone conditions are established. After that final results are calculated[7].
28
3.2 CFD Analysis Results
After all the parameters have been set up, fluent does the calculation. It solves the equation by numerical methods. The result could be displayed based on using Graphical Display windows.
Figure 3.2.1 Graphics and Animations window[7]
It can show the contours based on temperature vs. static temperature, total temperature, enthalpy, etc. It’s also possible to generate a data file, to see temperature at different individual points. Moreover, fluent allows the new surface generation, using what temperature contours of that surface can be measured to see, if it achieves the uniform temperature distribution or not.
29
3.2.1 Results: No shielding
While manufacturing the CdTe solar cells, shielding is provided to prevent the heat loss.. It also prevents foreign contamination. Boundary conditions used for the application without shielding are as given below.
1) Heat flux provided – 72514 W/m2 2) Emissivity of graphite : 0.8
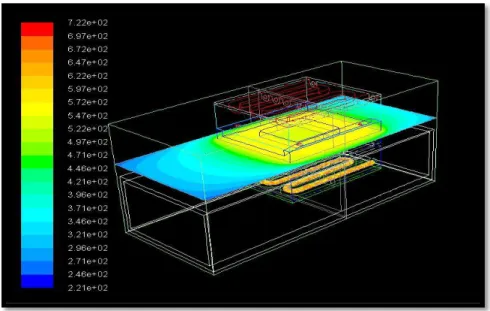
Figure3.2.1.1 Temperature Contours 3×3 pocket source
Figure 3.2.1.1 shows temperature contours of 3×3 pocket source. It shows that the temperature variations are in the range of 221°C to 540°C. The temperature range from 221°C to 421°C shows the radiation happening in nitrogen + 2% oxygen. The achieved results are as given below.
30
Table 3.2.1.1 shows that with the no shielding application when the heater was kept at 720 °C, the temperature achieved at 3×3 pocket source with S2S model was 540 °C and with Discrete Ordinate model is 555 °C[6], which is about 2% of the difference between both results.
Figure3.2.1.2 3×3 surface contours showing heat distribution Table 3.2.1.1 No. Element Temp °C Bottom source temp °C S2S model
Bottom source temp °C Discrete Ordinate
model
Difference
1. 720 540 555 2%
31
Figure 3.2.1.3 3 ×3 surface contours showing heat distribution at 620 °C
Moreover to achieve required temperature of 620°C the required heater temperature was 769°C. Table 3.2.1.3 is achieved with respect to Figure 3.2.1.1 and 3.2.1.2.
3.2.2 Result: With Shielding
The effect of one shield was modeled by reducing the emissivity of graphite from 0.8 to 0.4.
32
Table 3.2.2.1 Result with Shielding
No. Element Temp ºC Bottom Source Temp ºC Required Temp at 3 × 3 Pocket ºC Difference ºC 1. 720 619 620 1
Figure 3.2.2.1Heat Distribution at 3×3 pocket*
With shielding around the system, heat loss due to radiation reduces, (i.e. more heat is contained inside the system). This helps to achieve 620 °C at 720 °C element temperature. As shown in figure 3.2.2.1, which shows heat distributions at 3×3 pocket source. It shows that temperature of 619°C is achieved. It differs by 1°C to the required temperature of 620°C.
33
Chap. 4. Heating Element.
As per design procedure, once the modeling model is achieved, next comes the research. It was found out that the Advanced heater model can achieve temperature of 620°C with required heat distribution. It was concluded that Advanced heater concept is feasible. It could meet all the possible requirements desired for more efficient production. But the only material that was already available and used in CFD analysis was graphite. Research for the heating element material as well as ceramic material was required. Based on the previous literature review and CFD analysis, some of the requirements for heating elements were established, which are as given below.
4.1 Heating Element Requirements
The heating element is the major part of overall system. Being the embedded part, it was required that it satisfies some of the main requirements to reduce the operational or maintenance cost. As in case of frequent failure, it would be hard to remove it or replace it. Those main requirements are as given below:
1) High creep resistance
2) Sustain under temperature range of 200 °C to 720 °C 3) High oxidation resistance
4) Sustain under the process pressure of 40 miliTorr.
5) Chemically neutral with nitrogen and oxygen under 200°C to 720°C with operation pressure of 40 miliTorr.
34
It should sustain the temperature fluctuations in the span of 200°C to 720°C as the system works on the on-off application. Undergoing this high amount of temperature fluctuation could increase the thermal stress inside the material. This could increase creep deformation in the material, due to which it can come off the ceramic.
Sometimes heating materials react with different gases under elevated temperatures with low pressure. It is most important to prevent it. Chemical reaction with oxygen oxidizes the material. Oxidation at specific point increases the resistance of that point. Joule`s Law of Heating suggests that the temperature of the element is directly proportional to resistance, and the square of current. So with increase in the resistance temperature of that specific point will increase. Due to which element could fail. Ceramic is used to embed the heating element inside graphite. Therefore it`s most important that the ceramic doesn`t react with nichrome.
4.2 Available options for heating element.
As shown in Table 4.2.1, there are number of high temperature application available in market. These include refractory metals like molybdenum, tantalum and tungsten. The maximum temperature that it can sustain is from 1760 °C to 2482 °C main disadvantage
35
Table 4.2.1 Favorable candidate for Heating Element[8]
Metal Maximum Sustainable Temperature Remarks
°F °C
Refractory Metals
Molybdenum 3200 1760
Works well with vacuum and doesn`t tolerate oxygen.
Tantalum 3700 2038
Tungsten 4500 2482
Nickel-Iron 2200 1204 Annealing, Brazing ,
Degassing Nickel-Chromium 35-19 1800 982 Annealing, Brazing, Degassing 68-20 2200 1010 60-16 1850 1010 80-20 2100 1149
Vacuum and Tolerate oxygen < 1050°C
Kanthal A1 1000 1830
Iron-Aluminum
2200 1204
Lower life than NiCr alloys
Chromium-Aluminum
3000 1649
with, these metals are it can’t tolerate the presence of oxygen. It oxidizes very fast. Iron- aluminum and chromium – aluminum have shorter life at high temperature compare to Nickel Chromium elements. Nickel chromium elements are able to sustain high temperature very well. But only nickel-chromium (80-20) and kanthal A1 are the only element that can tolerate vacuum (pressure < 1 Atm.) and the presence of the oxygen, they have higher oxidation resistance.
36
4.3 Nichrome and Impurities
Table 4.3.1[9] Element Data Nichrome Kanthal – A1 Compositio n Cr% (Si+Mn) %
Ni% Cr% (Si+Mn)% Al% Ni
% 19-21 < 3 Bal. 20.5-23.5 < 1-1.2 5 Bal. Max Sustainable Temperatur e 1068°C 1955 °F 1106°C 2025°F Approx. Elongation at 800 °C 2% 27%
As previously described the final two elements that can be sustained in vacuum with partial pressure of oxygen are nichrome and kanthal-A1. Finally nichrome was selected as it has high creep resistance[9].
As shown in figure 4.3.1 number of on-off cycle to failure is almost same for kanthal-A1 and nichrome, however the deformation of the kanthal-A1 is approximately 25 % more than nichrome. Figure 4.3.1 shows that number of on-off cycle to failure is approximately 1900. It`s really easy to understand that in high temperature application it wouldn`t satisfy the condition of the higher life. Then select this element?
37
Figure4.3.1 Creep deformation vs. number of on-off cycle to failure.[10]
Shimotori, K., et al. worked on life of nichrome with a sheath and without a sheath. The power loading given for the experiment was 9 w/cm2 to 11 w/cm2. The required heatflux to achieve 720°C is 7.25 w/cm2. This is huge difference when using the element for high temperature application.
4.3.1 Life of nichrome element in the advanced Vapor Source
How long will the nichrome element last under the temperature of 720°C ? Observations of a different graph showed that nichrome life approaches the parabolic curve. The Arrhenius equation is used to find the answer[11].
Arrhenious Equation : 1/t =A × ( e^(-Q/R'T)) A= Pre-Exponential Factor
Q = Activation Energy, Calories
A – Nichrome Sheathed Heater B – Nichrome bare heater C – 25Cr-5Al-Fe D – Kanthal A1
38
R = Gas Constant , cal K−1 mol−1
T = Temperature, °K
Considerable efforts were made to find the literature that supports the following arguments. The Electric Kiln Usermanual provided life of Nichrome at different temperatures that are as given in the table 4.3.2. It is noted that these tests were done under cyclic condition[12]],
Table4.3.1 Life of Nichrome at different temperature[13]
No. Temperature Life of Heater t’
hours Rate of degradation 1/t’ °C °K 1. 1100 1373 1200 1/1200 2. 1150 1423 500 1/500 3. 720 993 t -
Using Arrhenius Equation
1/1200 = A exp [-Q/2 × 1373]……….Eqn. 1 1/500 = A exp [-Q/2 × 1423]……….Eqn. 2 Q = 68,418 Calories 1/t = A exp [-Q/2 x 993] {Temperature: 720°C t = 16591277 hrs. t = 1941 years t ≈ 1900 years Approximately
The nichrome heating element will have very long life in advanced source. This is very important conclusion of the study. It shows that the advanced source design is suitable for
39
industrial application; the life of the radiation halogen lamps used in the heat source is typically 3000 hrs. So the heating method used in advanced source greatly extends the life of the heating units.
4.4 Resistance to Oxidation and Effects of different elements.
Excessive oxidation can cause failure of the heating element. The initial oxide layer formed slows element oxidation. The initial oxide should be adhered to the surface of the alloy even at high temperature. Chromium (Cr) contents in nichrome help forming the Cr2O3.
Generally Cr2O3 form alloy contains 15% or more Cr as well as less than 2-3% Aluminum (Al).
When nichrome is exposed to the oxidizing atmosphere; nuclei of all possible oxides are formed as shown in figure 4.4.1.S1. It shows oxides of nickel (NiO/Nickel Oxide) as well as oxide of Chromium (Cr2O3/ Chromium oxide) are being formed. Nuclei of NiO grow till
numbers of metal alloy atoms are equal to surface of alloy as shown in figure 4.4.1.S2. The NiO nuclei grow laterally at an unpredicted growth; it will grow outward till the time it will outgrow the protective oxides of Cr2O3. As shown in figure 4.4.1. S3-S4 Cr2O3, will keep growing
because of its higher stability. It will keep growing until the surface is covered with a continuous layer of oxide. “At that time the growth of NiO layer will completely cease, and the overall oxidation rate is controlled by the growth of the protective layer.”[14]
40
Figure 4.4.1 Growth of oxide layer [16] Figure 4.4.2 Oxide Formation[15]
Figure 4.4.1 Growth of Cr2O3 formation over nichrome. Figure 4.4.2 shows
continues layer of Cr2O3 formation over nichrome.
Table 4.3.1 describes the final two elements selected with the impurities it has. nichrome was selected due to higher creep resistance. Moreover detailed study of nichrome showed that, it contains silicon and manganese as impurities. Generally, nichrome is described as Ni20Cr. It contains 80% of nickel and chromium varies in the variation of 15-20%, with aluminum, silicon and manganese being the balance. Mainly silicon and manganese are as impurities. So, it is important to understand the effects of them on the life of nichrome.
Douglass and Armijo et. Al. performed thermo-gravimetric tests were performed in Cahn Recording Microbalance find out oxidation of nichrome.
41
“Because of the small sample, size and the high sensitivity of the balance, convection currents markedly affected the results and so it was necessary to perform the oxidation test in a closed system at the oxygen partial pressure of 0.21 atm.”[14]
Even if the test was done at different temperature and different atmosphere than the system used for CdTe manufacturing lab, it is considered because the objective is to check whether Mn and Si help in increasing oxidation resistance or not.
Table4.4.1 Chemical analysis of specimen used for experiment.
After the thermo-gravimetric test was performed x-ray diffraction and electron microprobe techniques were used to characterize the oxide formation on the nichrome. The Specimen was dissolved the in solution ethyl acetate with 10% bromine at 75°C. “The oxides were not affected by solution ethyl acetate or bromine and were collected, cleaned and subjected to various diffraction tests. The technique was particularly useful for identifying those oxides that did not spall from the sample.” [14]
Alloy Designation Percentage by weight Cr Si Mn Ni Ni20Cr-1Mn 19.17 0.047 0.99 Balance Ni20Cr-3 Mn 19.15 0.1 2.85 Balance Ni20Cr-1Cr 19.18 0.89 0.001 Balance Ni20Cr-3Cr 18.97 2.91 0.006 Balance
42
Figure 4.4.3 x-ray diffraction profiles of Nichrome containing manganese after the Thermo-gravimetric test a)Scale formed on Ni-20Cr-1Man oxidized 1 week at 1200 °C b) Uniform scale on Ni-20Cr-3 Mn oxidized 3 week
1200°Cc)Same sample as (b) showing irregular scale.[14]
Nichrome containing higher amount of manganese showed higher spinel formation.
43
Figure 4.4.4 Concentration profiles in scales formed on Ni-20Cr-1 Mn oxidized 2 weeks at 1200°C[14]
Figure 4.4.5 Concentration profiles in scales formed on Ni-20Cr-3 Mn oxidized 2 weeks at 1200°C [14]
To have, a more extensive look at the oxide layers; a concentration profile was formed. Nickel oxide (NiO) and Spinel were found on the top of Cr2O3 oxide. It is observable
44
NiO was not detected on it. Manganese is seen in higher content in outer layer than in inside layer.
Figure4.4.6 Structures of scales formed on Ni-20Cr containing silicon (a)Ni-20 Cr-1Si oxidized 2 weeks at 1200°C. Nearly complete layer of SiO2 between Cr2O3 and metal. (b) Ni-20Cr-1 Si oxidized 1 week at 1200 °C. Isolated
particles of SiO2. (c) Ni-20Cr -3Si oxidized 1 week at 1200°C . Continuous film of SiO2 between metal and Cr2O3
45
Nichrome containing 1% Si doesn`t form silicon oxide; as it isn`t sufficient to form layer of oxide. As well as, nichrome containing 3% Si forms continues layer of Silica.
Figure 4.4.7 Ni-20Cr-1Si Oxidized 2 weeks at 1200°C[14]
Concentration profile of Ni-20Cr-1Si is shown figure 4.4.7. The silicon oxide was formed in between chromium oxide and nichrome
4.4.1 Effect of Manganese and Silicon oxide formation.
Addition of Mn formed layer of spinel MnCr2O4.
MnCr2O4 is dense, continues layer of spinel between base metal and
46
Ni-20Cr-3Mn has increased oxidation resistance than Ni-20Cr-1Mn. Silicon is also capable of forming continuous film of SiO
Increase the oxidation resistance.
Higher the Si contains more continuous SiO layer 3% Si oxidized slower than that of 1% Si[14].
Diffusion of Oxygen atoms through these layers of oxides are slower, preventing the oxidation of the nichrome layer.
47
Chap. 5. Ceramic Cement
Figure 5.0.1 Advance vapor source system
As shown in figure 5.1 a ceramic cement forms a bridge between the heater material and the graphite source. The ceramic cement heat is generated with the help of the heater and is conducted to graphite. Ceramic is a porous media that is electrical insulator and heat conductor.
There are some advantages associated with ceramic, and are described below:
Due to ceramic, the heating element has less exposure to the atmosphere; this prevents the oxidation of the heating element, due to which the life of the heating element is increased.
The ceramic provides mechanical for prevents the heating element. The ceramic prevents the thermal deformation of the heating element.
Based on the application there are some requirements that needs to be satisfied, which are as given below.
48
It should not react with nichrome, nitrogen and oxygen.
It should be adherent to the graphite surface under elevated temperatures and vacuum (pressure < 1 Atm.).
It should bond with nichrome to have proper conductive heating.
It should have a co-efficient of thermal expansion similar to that of Graphite.
5.1 Resbond 920 ceramic
There were numerous ceramics available that could provide almost all requirements. But the co-efficient of thermal expansion of all the ceramics were different than that of graphite.Resbond -920 produced by Cotronics Corp. became the best choice for this application. It completes entire requirement.
The base material of Al2O3, is considered to be best possible oxide to protect from the
oxidation of nichrome. At temperature higher than 850°C Al2O3 forms with the help of
aluminum impurities available inside the nichrome.
Required working temperature for a ceramic is 720°C, but Resbond 920 can withstand up to 1620°C.
Ceramic and element should adhere to the graphite and the nichrome element so that heat is transferred by the conduction rather than radiation increasing life of the heating element.
Co-efficient of thermal expansion of Resbond 920 is 8.1 × 10⁻⁶ microns/ m ° C, which is really close to Graphite 8.5 × 10⁻⁶ microns/ m ° C.
49
5.2 Procedure to attach heating element and ceramic inside a groove.
Figure 5.2.1 Cross sectional bottom view of Advanced Vapor source,
Heating arrangement (Not to the scale)[6] Figure 5.2.1 shows guide way for coil and ceramic. For the heating element it is necessary to be at the equal height to have uniform heating. It`s difficult to maintain uniform height at each and every point as the heating element is completely embedded inside the ceramic.
50
As shown in figure 5.2.2 (a), the first half groove is filled up with a semiliquid ceramic. It is given some time to settle down and to increase its adhesiveness with graphite. After that as shown in figure 5.2.2 (b) the heating element is placed inside the ceramic. Once heating element is placed inside the ceramic, the system is vibrated to increase bonding between the nichrome and ceramic. The ceramic is given time to get solidified. Once it`s solidified, the other half of the groove is filled with ceramic as shown in figure 5.2.2 (c).
5.3 Heating element failure
As claimed previously the life of the heating element should be, 1900 years at 720°C. But as soon as the advanced vapor source was implemented, the heating element broke in a few days. That contradicts with the result achieved in section 4.3.
Figure5.3.1 Failed element
Figure 5.3.1 shows the failed element that was used for the advanced vapor source as a conduction heating element. Now, it was necessary to find out the reason behind the failure of the nichrome. There were three reasons that could have been associated with this failure.
51
1) Vacuum
2) Impurities in nichrome 3) Overheating
1) Vacuum:
“For vacuum heating, 80Ni-20Cr (vichrome) element have been used at
temperatures up to 1150 °C. The 80Ni-20Cr alloys generally are not satisfactory much above 1150°C, because the vapor pressure of chromium is high enough for chromium to vaporize from elements, resulting in poor life, contamination of the material being processed and loss of vacuum. ”
This proves that heating element didn’t failed due to the vacuum’s condition.
2) Impurities in Nichrome:
52
Scanning electron microscope test was performed to find out the composition of the nichrome heating element. The result of SEM test is shown in figure 5.3.2. It shows that oxygen, aluminum, magnesium, silicon, chromium and nickel were the major amount of elements.
Aluminum, nickel, chromium, magnesium and silicon form an oxide layer with the help of oxygen. Magnesium oxide also is ceramic that increases the oxidation resistance. All increase the life of nichrome as shown in section 4.4.
So, major impurities of the nichrome material actually help in increasing the oxidation resistance and so the life of material. It is clear that the element hasn`t failed due to impurities of nichrome metal.
3. Overheating
Figure 5.3.3 Ceramic breaking off the system (a) Condition: Conduction (b) Condition: Radiation
53
Figure 5.3.3 (a) shows an embedded heating element prepared using the
procedure described in section 5.2. Figure 5.3.3(b) shows the ceramic came off the system, due to this heating element radiates the heat.
Heating element coil diameter = 0.25"
Closed coil length = 20.5"
When it de-bonds, the worst case is when half the coil is exposed. Radiation coupled to the source and the other half is covered by ceramic and radiates much less.
The area exposed in this case is
A = (3.14×0.25×20.5/2) = 8.05 sq. in
= 0.0051 sq. m.
1200 Watts required to achieve the required temperature of 720°C for the heat. When 1200 watts is applied to de-bonded coil the element temperature T
∴ Q = ƐσT4
× A Stephen Boltzmann Constant, σ = 5.67×10⁻⁸ W/(m²·K4)
Emissivity, Ɛ= 0.0051; Radiation Heatflux ,Q
54
T= 1158°C
At 1158°C, the life of Nichrome is less than 500 hours as shown in table 4.3.1; at 1150°C the life is 500 hours.
Figure 5.3. 4 Modified Design
Figure 5.3.4 shows modified design of the heating element and ceramic cement assembly. Extra groove is provided, to increase the support to the ceramic. This increases the ceramic adheration to the graphite. This increases the life of nichrome.
5.4 Reactions between heating element and ceramic cement
It is important to check if there is any reaction between nickel and chromium with aluminum oxide based ceramic because, the reaction between them could reduce the performance of the system, as well as affect the life of different elements.
55
To check this, the Ellingham diagram is the best tool available. It works on the basis of Gibbs Free energy. “Gibbs free energy (ΔG) of reaction is a measure of thermodynamic driving force that makes a reaction occur. A negative value for ΔG indicates that a reaction can
proceed spontaneously without external inputs, while positive value indicates that it will not. The equation for Gibbs free energy is :
ΔG= ΔH - T ΔS
Where ΔH is the enthalpy, T is absolute temperature, ΔS is entropy.”
Figure 5.4.1 shows the Ellingham diagram. It shows Gibbs free energy for the reactions of nickel oxide, chromium oxide and aluminum oxide.
Figure5.4.1 Ellingham Diagram
56
ΔG for Nickel Oxide (NiO) = -310 KJ
ΔG for Aluminum Oxide (Al2O3) = -890 KJ
ΔG for Chromium Oxide (Cr2O3) = -575 KJ
Table 5.4.1 ΔG for the possible reactions between Ceramic and Nichrome
Reaction Name ΔG Product - ΔG Reactants ΔG reaction
Al2O3 + Ni 3NiO + 2Al -310 - (-890) +580
Al2O3 + 2Cr Cr2O3 +2Al
-575 - (-890) +315
Table 5.4.1 shows that the reaction between the ceramic and nichrome has positive ΔG and the reaction will not happen.
57
Chapter 6: Conclusion and Future Study
6.1 Conclusion
Following conclusions are made based on research and analysis of advanced vapor source and material.
1) Computational fluid dynamics modeling of the advanced vapor source showed that the source was able to reach temperature of 620°C with the heating element temperature of 720°C. The results of computational fluid dynamics model matched closely with earlier results of an earlier study.
2) Calculation based on Arrhenius equation showed that the life of the Nichrome heating coil is approximately 1900 years. The Arrhenius Equation was developed from the data from the literature.
3) Based on the data from literature heating element made from Nichrome and Kanthal A1 was suitable for the application. Nichrome was preferred due to higher creep resistance. 4) A design was developed to provide additional support to the ceramic to prevent
de-bonding. This solved the problem of heating element failures that were observed earlier.
6.2 Future Study
Design the whole system with a factor of safety. Sometime, during the operation due to system error or instability, the temperature of the system may increase. So it is important to know the maximum temperature that the system can withstand.
58
The system can be modified, to have heating elements on all sides, improving heat distribution.
59
References
1. EPA, http://www.epa.gov/climatechange/science/indicators/.
2. Outlook, A.E., Energy Information Administration. Department of Energy, 2010. 3. Gruenspecht, H., International Energy Outlook 2011. Center for Strategic and
International Studies, 2010.
4. U.S. Energy Information Administration.
5. http://www.solarserver.com/solar-magazine/solar-news/current/2012/kw44/first-solar-revenues-decline-margins-maintained-in-3q-2012-as-manufacturing-prices-fall.html. 6. Kobyakov, P.S., W.S. Sampath, and K.E. Walters, SUBLIMATION CRUCIBLE WITH
EMBEDDED HEATER ELEMENT. 2011, Google Patents.
7. ANSYS, F., Fluent user’s manual. Software release, 2006. 6: p. 449-456.
8. Calow, C., P. Bayer, and I. Porter, The solid state bonding of nickel, chromium and nichrome sheets to α-Al2O3. Journal of Materials Science, 1971. 6(2): p. 150-155. 9. Kanthal, A., KANTHAL HANDBOOk," Heating Alloys for Electric Household
Appliances. Printed in Sweden by Primatryck,-02.3000, 2001.
10. Shimotori, K., I. Izumi, and H. Murabayashi, Sheath heater. 1981, Google Patents. 11. Baran, G., Oxidation kinetics of some Ni-Cr alloys. Journal of Dental Research, 1983.
62(1): p. 51-55.
12. B76-90, A., ASTM B76 - 90, Standard Test Method for Accelerated Life of Nickel-Chromium and Nickel-Nickel-Chromium-Iron Alloys for Electrical Heating. 2007.
13. Fraser, H., The Electric Kiln: A User's Manual. 2000: University of Pennsylvania Press. 14. Douglass, D. and J. Armijo, The effect of silicon and manganese on the oxidation
mechanism of Ni-20 Cr. Oxidation of Metals, 1970. 2(2): p. 207-231.
15. Schmitt, J.F., et al., First steps of the Ni–20 Cr alloy oxidation studied by Auger electron microprobe. Surface and Interface Analysis, 1992. 18(12): p. 789-793.
16. Allam, IM and Whittle, DP and Stringer, J. "Improvements in High Temperature Oxidation Resistance by Additions of Reactive Elements or Oxide Dispersions."
Philosophical Transactions of the Royal Society of London. Series A, Mathematical and Physical Sciences 295.1413 (1980): 309-29. The Royal Society. Web.
![Figure 3.1.1 Approach to computational fluid dynamics modeling[6]](https://thumb-eu.123doks.com/thumbv2/5dokorg/5521713.144049/29.918.223.690.109.358/figure-approach-computational-fluid-dynamics-modeling.webp)

![Figure 3.2.1 Graphics and Animations window[7]](https://thumb-eu.123doks.com/thumbv2/5dokorg/5521713.144049/38.918.222.711.297.588/figure-graphics-and-animations-window.webp)